Acceptance Tests – FAT & SAT
An Empirical Case Study of Utility Poles
Hussni M.O. Al-Farra
Linköping University
Supervisor: Peter Cronemyr Examiner: Elisabeth Johansson
ISRN: LIU-IEI-TEK-A--16/02698--SE Institute of Technology, Linköping University, Sweden
September 2016 LIU-IEI
Upphovsrätt
Detta dokument hålls tillgängligt på Internet – eller dess framtida ersättare – från publiceringsdatum under förutsättning att inga extraordinära omständigheter uppstår.
Tillgång till dokumentet innebär tillstånd för var och en att läsa, ladda ner, skriva ut enstaka kopior för enskilt bruk och att använda det oförändrat för ickekommersiell forskning och för undervisning. Överföring av upphovsrätten vid en senare tidpunkt kan inte upphäva detta tillstånd. All annan användning av dokumentet kräver upphovsmannens medgivande. För att garantera äktheten, säkerheten och tillgängligheten finns lösningar av teknisk och administrativ art.
Upphovsmannens ideella rätt innefattar rätt att bli nämnd som upphovsman i den omfattning som god sed kräver vid användning av dokumentet på ovan beskrivna sätt samt skydd mot att dokumentet ändras eller presenteras i sådan form eller i sådant sammanhang som är kränkande för upphovsmannens litterära eller konstnärliga anseende eller egenart.
För ytterligare information om Linköping University Electronic Press se förlagets hemsida http://www.ep.liu.se/.
Copyright
The publishers will keep this document online on the Internet – or its possible replacement – from the date of publication barring exceptional circumstances.
The online availability of the document implies permanent permission for anyone to read, to download, or to print out single copies for his/her own use and to use it unchanged for non-commercial research and educational purpose. Subsequent transfers of copyright cannot revoke this permission. All other uses of the document are conditional upon the consent of the copyright owner. The publisher has taken technical and administrative measures to assure authenticity, security and accessibility.
According to intellectual property law the author has the right to be mentioned when his/her work is accessed as described above and to be protected against infringement.
For additional information about the Linköping University Electronic Press and its procedures for publication and for assurance of document integrity, please refer to its www home page: http://www.ep.liu.se/.
Abstract
The overall purpose of this project is to devise improved quality acceptance procedures to examine quality characteristics of utility poles at the factory of the supplier (FAT) and on-site upon receipt by the customer (SAT). To that end, the thesis draws upon available standards, literature, and industry practices regarding wood, fiberglass and steel poles.
As far as the design of the research, a single case study of a major power company was chosen. Then, a data collection plan was developed in order to build upon the existing knowledge found in the literature, and upon the data that can be collected from three of the Company’s suppliers, in addition to the Technical Research Institute of Sweden (SP). Documents’ analysis, interviews, observations, and a survey were the tools of that plan.
It was found that criteria, inspection and test methods of wood poles are all sufficiently covered in the standards and the literature; for wood is the most commonly used material for utility poles. Next, in coverage of research, are the steel poles; while there is currently no standard that covers fiberglass utility poles.
Indeed, quality characteristics, criteria, and acceptance procedures can altogether form parts of a sustainable solution, as long as the quality is managed as a process whether at the Company’s end or at the fabrication sites; that is especially true if there is some form of backward partnership between the Company and its suppliers.
Keywords
Factory acceptance test, quality control, quality inspection, utility poles, quality management
Acknowledgements
First, I would like to thank my academic supervisor, Mr Peter Cronemyr, for his guidance, not only throughout the thesis project but also during my Six Sigma project course as he was my supervisor as well. His perspicacious and pragmatic approach was the exact qualities I needed and learned from. In fact, each discussion with him is a learning experience. Additionally, I would also like to thank my previous examiner, Mr Jostein Langstrand, and my current examiner, Mrs Elisabeth Johansson, for widening my perspective in several ways. It goes without saying that writing a thesis is not an easy task if you have high standards that is especially true if the thesis is all about quality. Both gave me the kind of comments and tips that make all the difference and raise the quality of the end product.
Then, I would also like to thank my opponents, Messrs Raitis Rudbahs and Nanda Gunavathy, for their interesting comments. I used to tell them that “eyes become used to defects easily, and one always needs a fresh perspective to stay on track.” And they did their task deliberately.
Although the Company subject of the case study was anonymised, I should express my appreciation for giving me this opportunity in the first place. Additionally, I would like to express my deepest gratitude for my supervisor who contributed to the thesis by his generous time, deep knowledge and sound advices. Any journey is an opportunity for growth, and I shall take pride in accompanying him across the country visiting the stakeholders. On the same note, I shall extend my thanks to anybody who helped me throughout the data collection phase whether at the Company, the suppliers or at SP.
Last but not least, I want to thank my family for their patience and ultimate support, which was immensely important for me. One cannot easily reinvent himself without a solid backup and you were my oak tree and I hope that I live up to your expectations.
Linköping, September 2016.
Contents
Copyright ... ii Abstract ... iii Keywords... iii Acknowledgements ... v Contents ... vii List of Figures ... ix List of Tables ... ix Table of Abbreviations ... x 1. Introduction ... 11.1 Background and Problem Description ... 1
1.2 Aim ... 2
1.3 Research Questions ... 2
1.4 Scope ... 2
1.5 Limitations and delimitations ... 3
1.6 Thesis Outline ... 3
2. Frame of Reference ... 5
2.1 Quality ... 5
2.2 Acceptance Sampling ... 5
2.2.1 Acceptance Sampling Concepts and Techniques ... 6
2.2.2 Lot Formation... 12
2.2.3 Rejected Lots – Corrective Actions ... 13
2.3 Quality Management System (QMS) ... 14
2.4 ISO Standard of Quality Management System ... 14
2.5 Process Management and its Implementation ... 15
2.6 Process Development – Process Mapping ... 16
2.7 Process Improvement ... 17
2.7.1 Six Sigma ... 18
2.8 Summary ... 23
3. Research Method... 25
3.1 Overall Research Methodology ... 25
3.2 Frame of Reference Methodology ... 25
3.3.1 Observations ... 27
3.3.2 Interviews ... 27
3.3.3 Survey ... 28
3.3.4 Document Analysis... 28
3.4 Analysis Methodology ... 29
3.5 Research Method Discussion ... 29
3.5.1 Sources of Bias and Limitations and how they were handled ... 29
3.5.2 Validity and Reliability... 30
4. Empirical Case Study ... 33
4.1 Case Description ... 33
4.2 Empirics ... 34
4.2.1 The Company ... 34
4.2.2 The Wood Pole Supplier... 40
4.2.3 The FRP Pole Supplier ... 43
4.2.4 The Steel Pole Supplier ... 47
4.2.5 SP ... 49
5. Discussion and Improvement Suggestions... 53
5.1 First Research Question– Quality Characteristics and Acceptance Criteria ... 53
5.1.1 Wood Poles – Quality Characteristics and Criteria ... 53
5.1 2 Fibreglass Poles – Quality Characteristics and Criteria ... 53
5.1.3 Steel Poles – Quality Characteristics and Criteria ... 54
5.2 Second Research Question – FAT & SAT ... 54
5.2.1 Procedures of Sampling ... 54
5.2.2 Procedures of Tests ... 63
5.3 Third Research Question – Process Improvement and Sustainable Solution ... 67
5.4 Fourth Research Question – Quality Control Process ... 69
5.4.1 General Instructions and Comments – Improved Purchase Process ... 70
6. Conclusions ... 71
6.1 Summary of the Research Questions’ Results. ... 71
6.2 Main Contributions ... 73
6.3 Managerial Implications... 73
6.4 Future Research ... 73
6.5 Final words ... 74
7. References and Bibliography... 75
7.1 References ... 75
7.2 Bibliography ... 76
7.3 List of Standards ... 79
List of Figures
Figure 1. Illustration of the Problem with Accepting Sampling ... 5
Figure 2. Important Definitions in Sampling ... 6
Figure 3. Inspection Switching Rules – MIL STD 105E ... 9
Figure 4. Inspection Switching Rules – ISO 2859-1, 1999 (E) ... 9
Figure 5. Rectifying Inspection ... 13
Figure 6. Average Outgoing Quality Curve and AOQL. ... 13
Figure 7. Quality Management System Terms. ... 14
Figure 8. Swim Lane Chart - Problem Map ... 16
Figure 9. Development of Improved Process ... 17
Figure 10. Interpretation of Six Sigma ... 18
Figure 11. Process States ... 19
Figure 12. Some Sensitizing Rules for Control Charts ... 20
Figure 13. Illustration of the Western Electric Alarm Rules ... 20
Figure 14. Process Capability ... 21
Figure 15. Capability of Attribute Data ... 22
Figure 16. FMEA Process ... 23
Figure 17. Overall Research Design ... 25
Figure 18. Examples of Bleeding Defectives ... 36
Figure 19. Steel Poles – Wrong Supplied Items ... 37
Figure 20. Basic Structure of Electric Grid ... 38
Figure 21. p-Chart of Defects of Impregnation Penetration ... 41
Figure 22. Penetration Defect Binominal Capability Analysis-Wood Pole Supplier ... 41
Figure 23. SP Sampling Procedure ... 50
Figure 1. Sampling Plans for Sample Size Code Letter C ... 84
List of Tables
Table 1. Selected Poles and Protection Methods ... 2Table 2. Acceptance Sampling Procedures ... 6
Table 3. Standards for Acceptance Sampling Plans... 6
Table 4. Equations Related to p-Chart ... 21
Table 5. Summary of Data Collection Plan ... 26
Table 6. Comparison of Deflections in the FRP Pole Supplier Tests on G-13 ... 47
Table 7. ITP Relevant Information ... 47
Table 8. Salt Impregnation – SP Recommendations ... 50
Table 9. Comparison among Different Sampling Plans for Different AQL(s) ... 57
Table 10. An Example of a Single Sampling Acceptance Plan Using the Nomograph ... 58
Table 11. Wood Pole Nonconformities – Proposed Classification ... 59
Table 12. Wood Poles – Proposed Sampling Plan ... 59
Table 13. FRP Pole Nonconformities – Proposed Classification ... 60
Table 14. FRP Poles – Proposed Sampling Plan ... 60
Table 15. Steel Pole Nonconformities – Proposed Classification ... 60
Table of Abbreviations
EBR Elektrisk Byggnads Rationalisering, a standard provided by Svensk Energi AB
FAT Factory Acceptance Test
NTR Nordiska träskyddsrådet (Nordic Wood Preservation Council)
NWPC Nordic Wood Preservation Council
SAT Site Acceptance Test
SIS Swedish Standard Institute
1. Introduction
This chapter provides an understanding of the problem background, defines the aim of the research, translates the latter into research questions, reflects upon the limitations and delimitation plan and, finally, provides a general outline of the whole research.
1.1 Background and Problem Description
Beyond a shadow of a doubt, electricity is one of the vital basics of our societies. In fact, in the midst of our escalating needs of high technologies, electricity became indispensable and any interruption of its provision creates significant consequences, especially in critical nodes of the network. Poles that carry the power lines contribute to the stability of electricity provision. Traditionally, wood and steel are the mainly used types of utility poles; new types, however, have seen the light recently, such as fiberglass or veneer. Each type of poles has different advantages and disadvantages, and hence, preferred areas of application.
The capital investment incurred in purchasing utility poles and the operating costs of keeping them in the proper state are huge and vary a lot because of different factors; that is especially true if one takes into consideration the different life cycles and impact on the environment besides to the different characteristics of each type of poles. According to a Swedish major power distribution company, there are nearly five million utility poles and two million telecommunication poles in Sweden. In 2016 alone, this very company planned to invest in purchasing around 8,000 wood poles. When building a new power line, there are different types of costs to be incurred; for example, cost for maintenance, inspection, repair, replacement, and disposal. The poles’ cost represents around 10-20% of the total cost of the power line when it is built. There are also other factors that do affect the price; for example, raw material cost, availability, order quantity, delivery lead time and transportation (Western Wood Preservers Institute, 1997). Moreover, one should bear in mind that logistics plays a very important role in this equation; for example, an average cost of one wood pole could amount sometimes to only one-third of its shipping cost, if it is to be replaced individually. For all these reasons, ensuring the appropriate quality of utility poles, by implementing proper procedures of factory and on-site inspection acceptance tests, so-called FAT and SAT respectively, is of significant importance; for it would reduce the probability of the need to reject defective poles on-site and subsequently to incur extra cost in adjustment or disposal.
Little research was conducted on devising comprehensive procedures of FAT and SAT; therefore, this thesis will zero in the question at hand by means of conducting a single case study with the cooperation of a major power company, named the Company henceforth, besides to three of its suppliers; anonymized as follows, the Wood Pole Supplier, the FRP Pole Supplier, and the Steel Pole Supplier. It should be noted that different utility poles are inspected for different characteristics whether at the supplier’s facility, throughout the production process, or on-site, upon receipt of the poles. Devising a comprehensive procedure, that sentences the samples against certain criteria and keeping, both the criteria and the procedures, updated consistently requires a systematic approach to maintaining a sustainable solution; that is especially true since there are many stakeholders from different organizations involved in the process; i.e. the Company, the suppliers, and the contractors. Thus, this thesis tackled this aspect, as well, by analysing the current process map, pinpointing the problems and proposing a modified process that incorporated procedures of FAT and SAT.
1.2 Aim
The purpose of this research is to identify the current practices of quality acceptance tests performed both at the suppliers’ facilities (so-called Factory Acceptance Test and abbreviated as FAT) and on-site (so-called Site Acceptance Test and abbreviated as SAT) upon receipt of purchased products, and to propose an improved and sustainable quality acceptance procedure in both cases. Therefore, a case study was chosen to be conducted on the products of utility poles with the cooperation of a major power company that operates in the field of electricity distribution in Sweden.
However, in order to form a procedure to examine certain quality characteristics in the utility poles, there are a number of factors that should be taken into consideration. For instance, each type of poles has a specific set of characteristics that should be addressed differently, as mentioned in the previous section, hence, one should specify those characteristics according to the type of pole and consequently, define specific criteria in order to be able to differentiate between what is conforming and what is not. Based on these criteria and characteristics, and based on the current (and possible) tests’ methods and inspections, one can propose improved procedures. Finally, in order to tie the ends, one should consider how to make such solution sustainable by keeping every aspect updated in a consistent fashion.
1.3 Research Questions
RQ1. What specific quality characteristics are examined (or can be examined) in the wood, fibreglass, and steel utility poles before acceptance at the supplier’s end and on-site; and what acceptance criteria are used (or can be used) in order to examine those characteristics?
RQ2. What acceptance inspections and tests’ methods are conducted (or can be conducted) on wood, fibreglass and steel utility poles at the supplier’s end and on-site?
RQ3. How can the process of acceptance, in general, and the acceptance criteria, in particular, be updated continuously in order to obtain a sustainable solution?
RQ4. How can the quality control practices be evolved into a quality control process?
1.4 Scope
The case study is performed with the collaboration of a Swedish power distribution company and three of its suppliers. Only the most common types of utility poles were considered; i.e. only certain types of timber, fiberglass, and steel poles, in addition to certain protection methods of these poles were studied. That is because the added value of studying other types or methods is of limited importance since the chosen set of poles and protection methods are the most commonly used in the power industry in Sweden. Thus, it is not useful to broaden the scope of this particular study. The poles along with their protection methods are furnished in Table 1.
Table 1. Selected Poles and Protection Methods
# Pole Type Protection method Protection against
1 Wood Poles
I. Water-borne preservative
a. Tanalith E-7/Tanalith E 3492 b. Wolmanit CX-8
II. Creosote Oils
a. Creosote grade B b. Creosote grade C
# Pole Type Protection method Protection against
2 Fibreglass (FRP)
Poles Polyethylene
Sun ultra violet
radiation
3 Steel Poles Galvanization Corrosion
Additionally, inspections and standards related to electrical requirements and components, such as conductors, etc. are not considered within the scope of this study.
Finally, the three chosen suppliers conduct various and different quality inspections throughout their production processes; however, they do not necessarily conduct statistical quality control in their facilities. This study did not tackle the question of how to perform statistical quality control at the supplier’s end; nevertheless, the importance of such methodology – to reduce the variability in the long-run was highlighted on multiple occasions in the thesis.
1.5 Limitations and delimitations
There were certain limitations to cope with while conducting this research. In this section, those challenges were addressed first; afterwards, the delimitations, which were deployed in order to overcome those challenges were furnished.
1. The scope was quite broad, as it involved different materials of poles and different protection methods and subsequently, different test methods. In addition, many stakeholders were involved at the same time; the Company, the three suppliers, and SP. 2. The research handled different walks of science, not just quality, which should be the
main focus of the thesis.
3. Culture, business secrets, and Swedish management style imposed certain hurdles of confidentiality concerns.
In order to minimize the effects of the mentioned limitations the following plan was adopted: 1. The scope was narrowed, as mentioned in the scope section.
2. Side research was conducted; however, only the necessary literature review was included in the chapter of Frame of Reference; while additional reviews were attached to the Appendices; in order not to overload the thesis with information.
3. The author opted to respect anonymity as much as possible, by means of anonymizing the names of the companies and ruling out references to their literature.
1.6 Thesis Outline
The Frame of Reference provided the theoretical background and the starting point for the research; it furnished a synthesis of the current knowledge regarding quality, acceptance sampling, and process improvement; then, the research method explained the methodology used in the thesis, detailed the data collection plan and provided a reflection upon the validity and reliability of the research. A description of the case study and an analysis of the results, with the theory in mind, were packed into the chapter of Case Study Results. The following chapter tackled the research questions and answered them by means of deploying the Frame of Reference and identifying any potential gap, similarities or differences. The thesis was concluded in the last chapter, where a summary of the research questions was provided and a reflection upon the thesis’s contribution and implications was furnished; furthermore, potential areas for future research were also included in the same chapter. Finally, an annex was attached to the thesis, where some important appendices could be visited.
2. Frame of Reference
This chapter provides a synthesis of the literature review concerning topics strictly related to the quality aspect required to answer the research questions such as quality definition, acceptance sampling, quality management system, and process management and improvement.
2.1 Quality
There are many approaches to defining quality. For example, some shorten the word to the meaning of grade, for instance, when steel quality is referred to as such in connection with various categories of steel strength properties; some connect quality to customer needs, “Quality should be aimed at the needs of the customer, present, and future” (Deming, 1986); and some extend its ramifications to going beyond customers’ expectations. For instance, Bergman & Klefsjö (2010) proposed “the quality of a product is its ability to satisfy, or preferably exceed the needs and expectations of the customers.” This follows quality may be viewed as if it has dimensions; Garvin (1987) suggested that quality has eight dimensions, which are performance, reliability, durability, serviceability, aesthetics, features, perceived quality, and conformance to standards.
2.2 Acceptance Sampling
Acceptance sampling, according to Montgomery (2013), is an inspection of the conformance of a product (raw materials, semi-finished, or finished) with a certain standard and thereby, acceptance or rejection of that
product.
Montgomery (2013) stressed that this inspection is one aspect of quality assurance and it should not, at any rate, replace process monitoring and control; that is because implementing statistical quality control from the very beginning of the manufacturing process at the supplier’s end and even at his sub-suppliers will not only reduce the
variability but also can significantly reduce and sometimes eliminate the need for stringent inspection. Similarly, Bergman & Klefsjö (2010) argued that in modern quality philosophy, process improvement is the mainstream; companies are increasingly allying with their suppliers in order to actively improve quality so that to rule out fallouts on the long run and consequently abolish inspection altogether – in ideal circumstances. Nevertheless, ideal cases are rare and hence acceptance sampling is imperative.
Figure 1. Illustration of the Problem with Accepting
Sampling
Sampling is divided into sampling plans, schemes or systems. ISO 2859-1, 1999 (E) provided the following definitions and distinctions:
Sampling plan is a combination of sample size(s) to be used and associated lot acceptability criteria (acceptance and rejection numbers). Sampling scheme is a combination of sampling plans with rules for changing from one plan to another.
Sampling system is a collection of sampling plans, or of sampling schemes, each with its own rules for changing plans, together with sampling procedures including criteria by which appropriate plans or schemes may be chosen.
Figure 2. Important Definitions in Sampling
Source: ISO 2859-1, 1999 (E)
2.2.1 Acceptance Sampling Concepts and Techniques
In fact, there are different acceptance sampling techniques; each of which is preferred to be applied in certain circumstances. Table 2 depicts the most important acceptance sampling plans classified as either attribute or variable quality characteristics procedures, and as per deployment objectives (Montgomery, 2013). This section discusses some of the most important acceptance concepts and techniques, especially those that are relevant to the case study at hand. Table 2. Acceptance Sampling Procedures
Source: Montgomery (2013, p. 636)
Attribute Acceptance Sampling – it is a high-level classification of lot-by-lot acceptance sampling plans as opposed to single, double, or Dodge-Romig sampling plans (explained later). The common factor of attribute sampling plans is that they are used for quality characteristics that can be described as in “conforming” or “non-conforming” basis. Table 3 depicts the military versus the civilian counterparts for both attribute and variable acceptance sampling plans (Montgomery, 2013).
Table 3. Standards for Acceptance Sampling Plans
Type of Data Military Standard Civilian Counterpart Standard
Attribute MIL STD 105E:1989 ANSI/ASQC Z1.4, ISO 2859-1, 1999 (E)
Variable MIL STD 414 ANSI/ASQC Z1.9
Source: adapted from Montgomery (2013)
Variable Sampling Plans – These plans are used for quality characteristics that can be measured numerically on a scale. Montgomery (2013) compared variable versus attribute acceptance sampling and stated the advantages and disadvantages of both. In contrast to
attribute acceptance sampling plans, variable plans require smaller samples’ sizes, provided that they have the same level of protection. In terms of feasibility, the cost of sample reduction might be offset by the higher cost of variable data measurements; however, if a destructive test is the objective of the inspection, then evidently variable sampling can be more useful. Furthermore, variable sampling provides information with more details concerning the process because measurements are more expressive as opposed to the classification of items as conforming or nonconforming. On the other hand, variable plans are generally based on the normal distribution of the quality characteristics and the more abnormal the distribution is the more risk of deviation between the real and the tabulated acceptance or rejection risks. Moreover, if variable plans are used, there is a possibility to reject a lot without defective items; certainly, this will cause discontent in both supplier’s and consumer’s companies; especially, if production is disturbed or large cost is to be assumed (Montgomery, 2013).
As Table 3 depicted, variable acceptance sampling plans are standardized in the military standard MIL STD 414 and in its civilian counterpart ANSI/ASQC Z1.9. Both of which contain provisions for switching into tightened or reduced inspection plans. Switching is determined based on the process average, which is usually computed based on the preceding ten submitted lots, provided that the distribution of the quality characteristics is normal, as indicated earlier. A minimum of 100 observations should be tested for normality; and if the test result indicated an abnormality, then returning to attribute plans is mandatory. In fact, returning from variable to attribute sampling scheme using the standards, depicted in Table 3, while keeping the same AQL and sample code letter is possible; similarly, returning back from attribute to variable sampling is also possible provided that the data became normally distributed, as established by Montgomery (2013).
MIL STD 105E – a collection of sampling schemes for inspection by attributes; according to Montgomery (2013), it is the most commonly used sampling acceptance system. Issued during World War II in 1950, it has received four revisions since then; the latest version (E) was in 1989. Later, a quite similar civilian version was created, called ANSI/ASQCZ1.4. Thereafter, the International Organization for Standardization (ISO) adopted the standard and named it ISO 2859. The latter features three types of sampling plans; namely, single, double and multiple; each of which has three provisions for the three types of inspection severities, the wit normal, tightened and reduced, refer to Figure 3; where the inspection severities are dependent on the quality history of the supplier.
Quality Level – the percent of nonconforming or the number of nonconformities per hundred units, whichever is applicable, as per the following two equations.
% 𝐧𝐨𝐧𝐜𝐨𝐧𝐟𝐨𝐫𝐦𝐢𝐧𝐠 = 𝐝
𝐧×𝟏𝟎𝟎 Equation 1. Quality Level – Percent Nonconforming
Source: ISO 2859-1:1999 (E)
Where
d is the number of nonconforming items in the sample n is the sample size
𝐧𝐨𝐧𝐜𝐨𝐧𝐟𝐨𝐫𝐦𝐢𝐭𝐢𝐞𝐬 𝐩𝐞𝐫 𝟏𝟎𝟎 𝐢𝐭𝐞𝐦𝐬 = 𝟏𝟎𝟎𝐝 𝐧 Equation 2. Quality Level – Nonconformities per 100 Items
Source: ISO 2859-1:1999 (E)
d is the number of nonconformities in the sample n is the sample size
Process average – As per ISO 2859-1:1999 (E), the process average is the quality level averaged over a defined period of time, during which the process was in statistical control. As for the consumer, he can estimate the process average by considering the average of percent nonconforming or the average number of nonconformities per 100 items over multiple samples, as long as those samples were the one used for the original inspections, to wit, only first samples if double sampling is used. Montgomery (2013) proposed to estimate the process average using the percent nonconforming control chart for the first 25 lots; if any lot has a percent nonconforming that exceeds the upper control limit, then it should be disregarded, provided the assignable cause is known. The consumer keeps accumulating the results from the lots until he obtains 25 valid ones; and until that moment, it is recommended to use the largest process average.
Acceptance Quality Limit (AQL) – According to ISO 2859-1:1999 (E), AQL is the worst process average that the consumer would consider to be acceptable. AQL, together with the sample size code letter (refer to Figure A8-1), are used to index the sampling plan and scheme. Similar to the standard, Montgomery (2013) observed that both the supplier and the consumer should agree upon AQL and define its value in the purchase contract. Also, he noted that AQL is a property of the supplier’s manufacturing process; however, it is hoped that the fabrication process would be significantly better than the AQL, and this is in congruence with what the standard ISO 2859-1:1999 (E) stipulated; as it stressed that “AQL does not suggest that it is the desirable quality level.” In fact, ISO standards for sampling schemes are designed to inspire suppliers to obtain a process average that is always better than AQL; otherwise, there would be a high probability of “switching” the severity of the inspection into a more “tightened procedure”. Moreover, it is imperative, as per ISO 2859-1:1999 (E), for the supplier to understand and act upon the fact that AQL does not imply that he has the right to supply any nonconforming item. Furthermore, Montgomery (2013) mentioned that multiple values for AQL can be designated for different groups of nonconformities as per the quality requirements; in practice, AQL’s value is usually 2.5 % for minor defects and 1% for major ones, while critical defects are not accepted at all. ISO 2859-1:1999 (E) stipulated that at any rate AQL should not exceed 10% nonconforming or 1000 nonconformities per 100 items.
Lot Tolerance Percent Defective (LTPD) – the worst level of quality the consumer is willing to accept in an individual lot (Montgomery, 2013). The LTPD plans were developed by Dodge & Romig (1959). Montgomery (2013) noted that LTPD is not a characteristic of the sampling plan, it is rather a consumer-specified level of quality; also, Montgomery (2013) argued that Dodge-Romig LTPD plans, are usually superior to the AQL plans, that is especially true when the products are complex, process average fallout is low and there is a need to obtain more protection; additionally, they are very useful for inspection of semi-finished products and can only be applied when rejected lots are 100% screened. Dodge & Romig (1959) designed the LTPD plans for lot acceptance probability of 10% and furnished those plans in tables indexed by different LTPD values; furthermore, they contain single and double sampling plans.
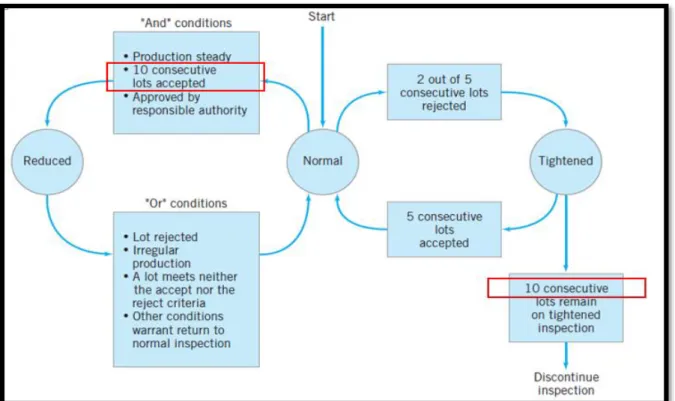
Different Severities of Inspections and Switching Rules – the military standard MIL STD 105E proposed different inspection severities (normal, tightened and reduced), and a method of switching among those plans according to the quality of the previous lots. Montgomery (2013) explained the inspection switching rules as can be seen in Figure 3. Similarly, the ISO 2859-1, 1999 (E) incorporated the same method but with some modifications as can be seen in Figure 4.
Figure 3. Inspection Switching Rules – MIL STD 105E
Source: MIL STD 105E, cited in Montgomery (2013, p. 656)
Figure 4. Inspection Switching Rules – ISO 2859-1, 1999 (E)
Source: adapted from ISO 2859-1, 1999 (E)
- Normal inspection – a sampling plan used when there is no reason to doubt that the process average of a lot is better than the AQL; as defined by ISO 2859-1, 1999 (E).
- Tightened inspection – a sampling plan used when the inspection results of a pre-defined number of consecutive lots point out that the process average could be poorer than the AQL; as defined by ISO 2859-1, 1999 (E).
- Reduced inspection – a sampling plan used when the inspection results of a pre-defined number of consecutive lots point out that the process average is better than the AQL; also, the sample size is smaller than that of a normal inspection plan but with a comparable acceptance criterion; as defined by ISO 2859-1:1999 (E).
- Switching score (SS) – an indicator used by the standard ISO 2859-1, 1999 (E) to decide, according to the current inspection results, whether the inspector should switch to a reduced
inspection plan or not. The initial value of SS is set at zero at the first normal inspection, provided that the responsible authority (which could be a 1st party – the quality department at the supplier, a 2nd party – the consumer, or a 3rd party – an independent authority) didn’t
specify another value; then, it is updated after each subsequent lot. As stipulated in ISO 2859-1:1999 (E), in case a single sampling plan -explained afterwards- is followed and an acceptance number of zero or one, each accepted lot adds 2 to the SS and 3 in case the acceptance number was two or more; if the sampling plan was double or multiple, 3 is added to the SS each time the lot is accepted regardless of the acceptance number; at any rate, each rejected lot reset the SS to zero.
Inspection Level – ISO 2859-1:1999 (E) defined the inspection level as the relative amount of inspection determined by the responsible authority; it enables different degrees of discrimination depending on the given case; refer to Figure A8-1. The predetermined level is separate from the severities and should be fixed regardless of the applied severity. According to the same standard, there are three general inspection levels (I, II, and III) and four special inspection levels (S-1, S-2, S-3 and S-4) – the higher the order of the levels, the more severe the discrimination gets. Level II should be normally applied. However, when relatively small sample sizes are necessary and higher risks can be assumed S-levels can be used and level S-3 is what usually used, according to SS-EN 351-1:2007.
Sample Size Code Letters – ISO 2859-1:1999 (E) tabulated sample sizes against three factors; namely, lot size, inspection level, and sampling plan, refer to Figure A8-1and Figure A8-2. Sampling Plan – ISO 2859-1:1999 (E) furnished different sampling plans (single, double and multiple) with different severities of inspection (refer to Figure 4), and the plans can be selected as per the chosen AQL and sample size code; for example, Figure A8-2 features a single sampling plans for normal inspection. (Montgomery, 2013) proposed the following procedure to select the sampling plan according to MIL STD 105E (applicable on the ISO 2859 as well) as follows:
Select the AQL Select the inspection level from Figure A8-1 Determine the lot size Find the appropriate sample size code letter from Figure A8-1 Determine the appropriate type of sampling plan (single, double or multiple) Find the plan from the appropriate table Determine the corresponding reduced and tightened inspection plan in case they were needed.
Operating Characteristic Curves (OC) – As per ISO 2859-1:1999 (E), each sampling plan has an operating characteristic curve (OC) that plots the percentage of lots expected to be accepted Pa, versus the quality of the submitted product p (in percent nonconforming and in nonconformities per 100 items) and for different AQLs. Figure A8-3 demonstrates an example of a single sampling plan for sample size code letter C. Multiple and double sampling plans are not provided by ISO 2859-1:1999 (E) as they are “roughly comparable” to the single plan OC curves, according to Montgomery (2013). OC curves for AQLs smaller than 10 are applied for inspection of nonconforming items, while curves for AQLs bigger than 10 are applied for inspection of nonconformities. Additionally, the standard provides operating curves in form of tables not only for the normal inspections as the curves do but also for the tightened inspections as well, refer to table 10-C-1 of Figure A8-3.
Montgomery (2013) indicated certain characteristics regarding these curves, listed here below: - They are useful in estimating the average sample sizes that might be selected under
various sampling plans for a given process quality.
- They focus on producer’s risk, and the only control the consumer can exercise over the discriminatory power of the sampling plan, scilicet the steepness of the curves, is
through selecting an appropriate inspection level that provides him with the necessary protection.
- They provide only certain sample sizes which are related to the lot size.
- At small lot sizes, the sample size increases with the increase of the lot size; thereafter, it decreases at higher rate at larger lot sizes; this fashion provides an efficient inspection costs per unit especially at large lots; moreover, it reduces the risk of false rejection of a large lot because of the discriminating power of the curves and consequently the consumer gets higher protection.
Consumer’s and Producer’s Risks – According to ISO 2859-1:1999 (E), the different severities of sampling plans (normal, tightened and reduced) should provide both of the supplier and the consumer enough protection at the same time; scilicet they should be deployed in such a manner that results in consumer protection while maintaining the acceptance of the lots at high rate, provided that the quality is better than the AQL.
- Consumer’s Risk Quality (CRQ) – As per ISO 2859-1:1999 (E), CRQ is the quality level of a proces, or a lot that is related to a specific consumer’s risk β (probability of the lot to get accepted under different types of inspections’ severities); usually, the latter is about 10%. If the consumer is going to inspect a limited amount of lots that is not enough for the switching rules to be functional, it is recommended by the standard ISO 2859-1:1999 (E) to choose sampling plans associated with a value of AQL that gives a certain amount of consumer’s risk quality. For example, in Figure A8-6 the responsible authority can choose a sampling plan by choosing a consumer’s risk and the related CRQ.
- Producer’s risk α– As per ISO 2859-1:1999 (E), this risk represents the rejection probability of a lot of AQL on different types of inspections’ severities.
The common approach to design a single sampling acceptance plan, as illustrated by Montgomery (2013), is to use the nomograph (refer to the example in Figure A8-7). Two lines are drawn and their intersection defines a point, which in its turn defines a unique sampling plan, if the intersection meets a particular point on the nomograph; otherwise, any close point to the intersection provides a possible sampling plan (because both the sample size and the acceptance number c should be integers). The lines are drawn by using the following points:
- First Line: (AQL, 1- α); where AQL is the poorest percent nonconforming producer can tolerate, α is the producer risk (probability of rejection) and 1- α is the probability of acceptance.
- Second line: (LTPD, β); where LTPD is the poorest percent nonconforming consumer can tolerate and β is the consumer risk (probability of acceptance).
However, ISO 2859-1:1999 (E) asserts that using these individual plans without the switching rules should be limited to one of two cases; either the amount of the inspected lots is not enough to use the switching rules, or for verification purposes only and thereby, it should not be referred to inspection per these two methods (ISO tables or the nomograph) as an “inspection in compliance with ISO 2859-1:1999 (E)”.
Single, Double, and Multiple Sampling Plan – According to Montgomery (2013), a single-sampling plan is a lot-sentencing procedure, where one sample of n units is selected arbitrarily; then, the inspector counts the nonconforming items and finally sentence the sample with either acceptance or rejection depending on whether the number of defective items is bigger or smaller than a predefined acceptance number c. In double-sampling plans, the sentence is one of three possibilities 1) accept, 2) reject, or 3) take a second sample. Additionally, if the second
sample is taken, then the sentence is dependent on information taken from both samples. In the same context, ISO 2859-1:1999 (E) stipulated that if the number of nonconforming items in the first sample equals to or is greater than the first rejection number Re1 then the lot will be rejected; if it equals to or less than the first acceptance number Ac1, then the lot is accepted; however, if it falls between Re1 and Ac1, then a second sample is to be inspected; then, the number of nonconforming units in both samples is summed up and if it equals to or less than Ac2 then the lot is accepted and if it equals to or greater than Re2 then the lot is rejected. Multiple sampling is similar to the double sampling plan; however, it is for more than two samples and usually, a smaller size of samples is used (Montgomery, 2013). In ISO 2859-1:1999 (E) there are five stages of the multiple plans and the decision should be concluded in the fifth one in the worst-case scenario. Furthermore, it should be noted that the above sentencing rules apply on both nonconforming items and nonconformities. According to Montgomery (2013), switching rules between normal and tightened and vice-versa received some criticism; as some practitioners claim that wrong switching is occurring frequently; furthermore, there is some practical evidence of cases where production was discontinued although the quality did not deteriorate.
According to ISO 2859-1:1999(E), the, single, double and multiple plans can be designed in such a manner so that they yield the same results; i.e. they can have the same probability of acceptance. Hence, selecting any of which is more dependent on the efficiency, type of results, needed inspection-average-time and effort, and the accepted disturbance to the material flow, etc. Additionally, when the responsible authority is going to choose the sampling plan, usually the sample size is compared with the administrative difficulty; that is because, on the one hand, the sample size increases from the multiple up to the single sampling plan, while on the other hand, the administrative difficulty and the cost per unit decrease from the multiple to the single plan.
2.2.2 Lot Formation
The formation of lots can significantly affect the effectiveness of the sampling plan; hence, Montgomery (2013) mentioned some recommendations in that regard. For example:
- Lots should be Homogenous – units are produced by the same machine, operators, common raw materials, more or less at the same time; otherwise, taking corrective action to eliminate the source of defectives will be difficult.
- Lots should be as large as possible because that might reduce inspections costs. - Lots should be comfortable in terms of materials handling and logistics.
- Units of each lot should be selected randomly from all locations -or strata- in the lot, in order to reduce bias and be representative of the whole lot as much as possible.
Similarly, ISO 2859-1:1999 (E) stressed the homogeneity of the samples and stipulated that, as much as possible, the lots should be formed from a single type, grade, class, size, and composition of items and that the units should be produced under the same uniform conditions at essentially the same time. Moreover, the samples should be selected at random and in proportion to the strata or sub-lots in case the lot contained different strata or sub-lot. Furthermore, the samples should be selected after the lot has been produced or during production.
2.2.3 Rejected Lots – Corrective Actions
When lots are rejected after an acceptance sampling, a corrective action should be carried on. Montgomery (2013) observed that usually a screening, which is100% inspection of the rejected lot, is conducted. Thereafter,
all nonconforming items are removed and returned to the supplier, in order to replace them with good ones or rework them and such program is called rectifying inspection program. Figure 5 depicted how the outgoing lots will have an average percentage nonconforming that is less than that of the incoming lots because all
nonconforming units in the rejected lots are being replaced totally.
Rejected items might be disposed of in different methods according to the standard ISO 2859-1:1999 (E), the responsible authority should decide to choose among the following options: scraping, sorting, reworking, or re-evaluating against more information or criteria. Certain types of nonconformities might be critically important and as such the responsible authority might inspect every item in the lot; also, it might not accept the whole lot directly, in case a nonconformity existed in a chosen sample. Furthermore, all concerned parties should be advised in case of lot rejections; afterwards, the responsible authority decides which type of inspection to follow; refer to Figure 4.
Average Outgoing Quality (AOQ) – Montgomery (2013) defined AOQ as the lot quality averaged over a long sequence of lots from a process with a certain percentage nonconforming, including accepted lots and rejected ones after thoroughly replacing the nonconforming items. AOQ is used to evaluate the rectifying sampling plan. Average Outgoing Quality Limit (AOQL) – according to ISO 2859-1:1999 (E), AOQL is the maximum AOQ for all possible qualities submitted for a given acceptance plan. Figure A8-5 depicts an approximation of AOQL values for single plans under normal inspection.
Figure 6 is an example that plots an average outgoing lot quality versus its associated incoming lot quality; it can be seen that the AOQ will never have a quality worse than a certain limit, which is the AOQL (in this very case, AOQL = 0.0155). AOQL plans were developed by Dodge & Romig (1959); there are different tables indexed by different values of AOQL; each
Figure 5. Rectifying Inspection
Source: Montgomery (2013, p. 643)
Figure 6. Average Outgoing Quality Curve and
AOQL.
of which has six classes of values of process averages; (refer Figure A8-8). Additionally, there are tables for single and double sampling plans.
2.3 Quality Management System (QMS)
For a long time, many companies have been conducting “quality audit” at their suppliers’ facilities. Bergman & Klefsjö (2010) observed that in 1930 US military purchases designed a standard that addressed how supplier activities should be evaluated with respect to quality. This standard was the basis of the international standard for quality management systems, the ISO 9000 series. It intended to minimize the number of quality audits at the supplier’s company; currently, it is used as a certification, granted by a third independent auditor after evaluating the quality management system. Bergman & Klefsjö (2010) defined QMS as “a tool for controlling and improving the quality of the Company’s products and processes.” ISO 9000:2005 defined QMS as “a management system to direct and control an organization with regard to quality” QMS comprises: quality planning, quality control, quality assurance and quality improvement; definition of each term is provided in Figure 7 according to ISO 9000: 2005.
Quality management: Coordinated activities to direct and control an organization with regard to quality.
Quality planning: Part of quality management focused on setting quality objectives and specifying necessary operational processes and resources to fulfil the quality objectives.
Quality assurance: Part of quality management focused on providing confidence that quality requirements will be fulfilled.
Quality control: Part of quality management focused on fulfilling quality requirements.
Quality improvement: Part of quality management focused on increasing the ability to fulfil quality requirements.
Figure 7. Quality Management System Terms.
Source: ISO 9000:2005
2.4 ISO Standard of Quality Management System
There are many standards of ISO; however, in this thesis, the focus is on the standard of the quality management system; namely, ISO 9000 series. According to Linköping University (2014), the current version of this series consists of four standards that form together a solid base that advances the understanding of quality issues, and facilitates communication on an international level and thus, they are supposed to be adaptable to any type of organization or product. In this thesis, the standard ISO 9001:2008 is of special interest. It contains the requirements for a quality management system and is based on a process approach; hence, it is often used for certification purposes. Any organization that has deployed a QMS according to ISO 9001 can obtain a certificate of conformance to the standard requirements from an independent accredited organization called certification body, which exists in most of the European countries. The accreditation is also performed according to a separate standard that addresses the requirements related to those bodies. For example, in Sweden, there is a number of certification bodies such as Det Norske Veritas (DNV), SFK Certification, to name a few. Certification bodies perform audits, which is a thorough review of organization’s documents, procedures, and processes (Linköping University, 2014). Those standards are subject to revision and change, if needed, every five years, because this renders them as useful tools in
the dynamic marketplace; and thus, companies that have been certified for conformance of meeting the requirement of an old standard have to adopt to the new one because the old certification will turn obsolete once the new version is released. For example, a new version of the standard, ISO 9001:2015, has just been launched, replacing the previous version ISO 9001:2008. One major difference between both is the eminent focus on risk-based thinking, which helps in tackling organizational risks and opportunities in a structured manner, very much like the FMEA method, which is deployed in Six Sigma projects and is discussed later (ISO, 2015).
Although ISO 9000 aims to give customers confidence in their suppliers by assuring them that the suppliers have in place management processes that deliver consistency, some researchers argue that this series of standards encourages but does not necessarily - of itself - guarantee product quality (Samson & Terziovski, 1999). They postulate that ISO 9000 certification did not show a significant positive effect on organisational performance in the presence or absence of a Total Quality Management (TQM) environment. Furthermore, they stated that “this is in congruence with the view that ISO 9000 certification has, on average, little to non-explanatory influence over organisational performance.” (Samson & Terziovski, 1999).
2.5 Process Management and its Implementation
It is important to notice the difference between the part and the whole, between individual processes and Process Management. The latter is a philosophy by itself originated from the concept of Total Quality Management (Bergman & Klefsjö, 2010). The increased adoption of process view and process improvement brought Process Management into existence. Process Management requires a high level of awareness of the processes and a system thinking at the same time, and applying such managerial style is most likely going to cause serious change in the performance of the organization on both short and long run (Oakland & Tanner, 2007). More than that, they argued that “process management sits at the heart of a successful change programme.” Management commitment is of evident importance in Process Management; as such, it is widely considered as criteria for successful implementation (Cronemyr 2007, 2013). Nevertheless, few were the thesis, which proposed how to practically implement Process Management through activating management commitment (Cronemyr, 2007). It should be noted that being a philosophy, implementation of Process Management does not follow an ascribed way. Additionally, certain researchers argue that Process Management contains Six Sigma methodology; for instance, Hammer (2002) contended that “Six Sigma should be a part of Process Management, not the other way around.” However, it is still a matter of discussion for others.
At any rate, understanding the current situation is a key element to be able to put a plan towards a targeted improved situation. In the following sections, process development and mapping were tackled.
2.6 Process Development – Process Mapping
Different visualization methods are available for the developing and pinpointing value added and non-value added activities. Montgomery (2013) mentioned few methods, such as Flowcharts, operation process charts, and value stream mapping. Process map or flowchart, as per Montgomery (2013), is a “chronological sequence of process steps or workflow.” And “Constructing a process map can be an
eye-opening experience, as it often reveals aspects of the process that people were not aware of or didn’t fully understand.” (Cronemyr, 2014) proposed that the main objectives of Process Mapping and
Development are first, to see the system as a whole from the perspective of the customer; secondly, to build a conceivable model of the work processes in order to better understand them, by means of creating a fundament for a standardized working and facilitating internal and external communication, which in its turn renders understanding how one’s own work interacts with the system easier, and creates confidence among stakeholders; and finally, identify improvement opportunities, problem elimination possibilities and increase the efficiency and effectiveness of the process in general. On the same note, Andrews (2007) confirmed that “The visual representation provided by flowchart can summarize pages
of narrative in a single drawing.” Nevertheless, he
argued that the level of detail found in flowcharts can make process analysis cloudy.
Cronemyr (2014)
demonstrated how to map the current process and how to develop an improved map. Process mapping starts with drawing a “Swim Lane Chart” which is a flowchart of the activities as they are currently carried on, starting from the customer’s needs, going through all the required activities across the related departments and ending with fulfilment of the
need; activities that take place in one department are maintained in the same lane and arrows depict how the process functions in a chronological fashion; afterwards, problems are identified and plotted on the same plan. That is why it is called Problem Map as well, refer to Figure 8.
Figure 8. Swim Lane Chart - Problem Map
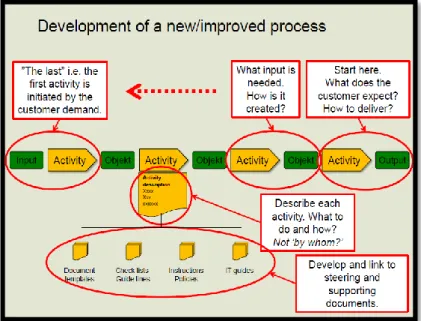
After identifying all of the problems in the Problem Map, a new map is designed to incorporate a vision of the chain of activities as series of main process and support processes. Each of which is constructed by series of
activities, which in turn are connected to each other by their inputs and outputs. Each activity is described by what and how and not by whom? Also, it is connected to steering and supporting documents, such as templates, checklists, guidelines, instructions, and policies, etc. Most importantly is that the new design starts with the end; in other words, with the customer need and expectations; thereafter, the following question is posed: what is the activity that should be performed in order to reach to this specific output? Afterwards, posterior activities are developed exactly in the
same way, until the designer reaches the very beginning, which is the customer demand. Figure 9 Illustrates the development of the new, improved process (Cronemyr, 2014).
It should be noted that in organizations where process awareness is still not shaped, drawing the map will take quite a longer time because everybody knows what he is supposed to do, while no one knows the whole picture. Once everything comes together on the map, problems will get exposed.
2.7 Process Improvement
Bergman & Klefsjö (2010) contrasted the old view and A better view of the purchasing process. In the former, neither the supplier nor the seller was unique; there were many suppliers who could produce according to certain specifications, and what mattered the most was reducing cost, as it was the decisive factor in the perspective of the buyer. Hence, quality was not prioritized and as such, suppliers who refused to produce anything less than a high-quality product were driven out of business by other suppliers who produced at a lower price. Whereas, in the newer version, fewer suppliers are chosen by the buyer and a closer relationship is built between the two parties, a partnership, in order to influence and support the improvement of the work at the supplier’s end. For instance, Cali (1993) observed that leading companies had changed their relationship with their suppliers and mentioned the following purchasing routines of those companies:
- Study “Benchmark”, how other companies corporate with their suppliers.
- Reducing the number of suppliers and trusting a few suppliers is a better basis for quality improvements.
- Trust is an important element strengthening established contacts.
- Investments in education and technical support for the suppliers are a key to success. - Focus on continuous improvements.
- Involve the suppliers at an early stage in the design process.
Figure 9. Development of Improved Process
- Use quantitative measurements to judge if improvements are performed.
- Share information, risks and success with suppliers to establish a long-term mutual partnership.
2.7.1 Six Sigma
Six Sigma is a methodology, or an improvement programme within the general framework of Total Quality Management, introduced by Motorola in 1980 (Bergman & Klefsjö, 2010). The interpretation of the name,
illustrated in Figure 10 by Magnusson et al. (2003) and Bergman & Klefsjö (2010), is as follows: If the mean value of a process distribution is allowed to vary at the most ±1.51 standard deviations (σ) from a targeted value (T), and the distance from that mean to the nearest defined specification limit (USL or LSL) is still 4.5 σ, then the number of defects will not exceed 3.4 part per million. The purpose of Six Sigma, as noted by Bergman & Klefsjö
(2010), is to reduce unwanted variation in the organizational processes, which is significantly manifested in the reduction of cost, improvement of reliability and service level, and an increase of profitability and customer satisfaction.
The underlying procedure for solving the problem of Six Sigma, often referred to as the DMAIC (Define, Measure, Analyse, Improve, Control), can be traced back to Deming’s improvement cycle, Plan-Do-Study-Act (PDSA) (Bergman & Klefsjö, 2010).
Bergman & Klefsjö (2010) observed a mantra in Six Sigma that says “every important quality characteristic Y, referred to as the process yield, is a function of controllable quantities.” Six Sigma role is to find the underlying function or relations, i.e. the root causes, in addition to the controllable variables. The yield of a process is given per the following equation:
𝐘 = 𝟏𝟎𝟎% − % 𝐝𝐞𝐟𝐟𝐞𝐜𝐭𝐢𝐯𝐞 = 𝟏𝟎𝟎% − ( 𝐧𝐮𝐦𝐛𝐞𝐫 𝐨𝐟 𝐝𝐞𝐟𝐞𝐜𝐭𝐬 𝐧𝐮𝐦𝐛𝐞𝐫 𝐨𝐟 𝐨𝐩𝐩𝐨𝐫𝐭𝐮𝐧𝐢𝐭𝐢𝐞𝐬 ) Equation 3. Yield
Source: Brook (2010, p. 90)
Montgomery (2013) differentiated between different sources of variability, which are either common causes, responsible for random variation, or assignable causes, sometimes referred to as special causes as per Bergman & Klefsjö (2010) and are responsible for assignable variation. Montgomery (2013) contended that “common causes are sources of variability that are embedded in the system or process itself, while assignable causes usually arise from an
1This value was chosen by Motorola Company.
Figure 10. Interpretation of Six Sigma
Source: Magnusson et al. (2003), cited in Bergman & Klefsjö (2010, p. 569)
external source.” Henceforth, if common causes are to be eliminated or reduced, then most probably the process will be subject to certain changes; whereas, eliminating or reducing special causes often times demands the removal of a specific problem. Montgomery (2013) furnished an example of both cases, “A common cause of variability might be an inadequate training of personnel processing insurance claims, while an assignable cause might be a tool failure on a machine.”
Statistical Process Control and Quality Control
Statistical Process Control (SPC) is a set of problem-solving tools that constitutes a practical framework for quality improvement programme; these tools are used for two objectives; first, to increase the stability of a given process by reducing its variability and second, to monitor the performance of process and enhance its capability; for that reason, it is deployed in both of the Analyse and Control phases
of DMAIC process of Six Sigma (Montgomery, 2013). In the same context, Bergman & Klefsjö (2010) clarified the purpose of using (SPC) as to consistently investigate and eliminate special causes until the process reaches a state of little variation and becomes a stable process, i.e. in statistical control; thereafter, the target becomes either to maintain that status or to improve the process much more. When process
improvement by eliminating sources of variation becomes unattainable, it is time to introduce a radical change i.e. in the process structure; if the process change fulfils its objectives, the process will be less prone to variation and become more capable, Figure 11 illustrates the three described states of a process as per Bergman & Klefsjö (2010).
The appropriate application of SPC tools aids in revolutionizing the working environment by turning the organization into a relentless seeker of quality and productivity improvement. However, this can only be established, if the management engages in the process actively (Montgomery, 2013). Similarly, Juran (1986) argued that it is unacceptable for any organization to operate on a level of rather poor-quality costs and act only upon occurrence of special disturbing events, sporadic spike; the upper management should rather adopt a trilogy of quality planning, control and improvement, which can lead any company, of whichever sort, to operate in a new zone of quality level and control.
Control Charts
Montgomery (2013) observed that control charts, outlined by W. A. Shewhart (1931), illustrate the process performance and the special causes of variation if any; therefore, they detect changes in the process and reveal whether it is stable and predictable or not. A number of observations are taken from the process at certain time intervals, then the data set is employed in calculating some sort of quality indicators that point out a certain process characteristic; for instance, the arithmetic mean, the standard deviation, or the total number of non-conforming units. Thereafter, the quality indicators are plotted in a diagram(s) and analysed (Bergman & Klefsjö, 2010). A process that is functioning with only arbitrary sources of variation is considered to be stable or in statistical control; while, if it is operating in the presence of special
Figure 11. Process States
causes then it is considered an out-of-control process (Montgomery, 2013). The quality indicators are plotted in the charts along with upper and lower control limits, UCL and LCL respectively, in addition to the central line; see Figure 13. The Central line represents the average value of the quality characteristic associated with the in-control state. The control limits are chosen so that all of the data points should fall in between the two limits if the process is in control. In such case, no action is needed; elsewhere, the process is out-of-control, and an investigation and proper corrective action should be carried out in order to find and eliminate the special cause(s) that led to such performance (Montgomery, 2013). In general, Bergman & Klefsjö (2010) indicated, UCL and LCL are set at three standard deviations from the central line; see Figure 13.
Some rules were introduced by Western Electric (1956) in order to increase the sensitivity of Shewhart diagrams so that if any rule applies, an alarm is spotted and the process requires attention. see Figure 12.
Figure 12. Some Sensitizing Rules for Control Charts
Source: adapted from table 5.1 Montgomery (2013, p. 197)
Figure 13. Illustration of the Western Electric Alarm Rules
Source: Bergman & Klefsjö (2010, p. 265)
p-chart
Bergman & Klefsjö (2010) referred to this chart as defect percentage chart and stated that it represents the variation in the fraction, or percentage, of defective units in a process. Hence, each data point in this chart is the proportion of defective units in a particular subgroup of a sample of n units, the data assumed to have a binominal distribution with parameter n and p; where p stands for the probability that a manufactured item is defective. Montgomery (2013) argued that the terms defective or non-defective, although still used to identify these two classifications of attributes, are recently replaced with the terms conforming and