DISSERTATION
ANALYTICAL SPECTROSCOPY METHOD DEVELOPMENT TO STUDY MECHANISMS OF ALZHEIMER’S AND TUBERCULOSIS DISEASES
Submitted by
Cheryle Nicole Beuning
Department of Chemistry
In partial fulfillment of the requirements
For the Degree of Doctor of Philosophy
Colorado State University
Fort Collins, Colorado
Spring 2020
Doctoral Committee:
Advisor: Debbie C. Crans
Nancy E. Levinger George Barisas Ellen R. Fisher Mark Zabel
Copyright by Cheryle Nicole Beuning 2020
ii ABSTRACT
ANALYTICAL SPECTROSCOPY METHOD DEVELOPMENT TO STUDY MECHANISMS OF ALZHEIMER’S AND TUBERCULOSIS DISEASES
This dissertation covers the analytical method development created to study and enhance the knowledge of two specific disease mechanisms important to Alzheimer’s disease and Mycobacterium tuberculosis. There are two parts in this dissertation where Part 1 is entitled Measurement of The Kinetic Rate Constants of Interpeptidic Divalent Transition Metal Ion Exchange in Neurodegenerative Disease. Part 2 is entitled The Electrochemistry of Truncated Menaquinone Electron Transporters with Saturated Isoprene Side Chains Important in Tuberculosis. These diseases appear on the World Health Organization’s top 10 leading causes of death worldwide. The amyloid-beta (Aβ) peptides are associated with Alzheimer’s disease, where neurodegeneration is caused by the aggregation of the peptide into senile plaques within neuronal synaptic cleft spaces. Alzheimer’s disease currently has no cure due to its multi-causative pathology. One disease mechanism is the coordination of divalent metal ions to the peptide. Specifically, Aβ coordinates Cu(II) and Zn(II) ions that can enhance the aggregation of Aβ into plaques. These metal ions are highly regulated within the human body and are usually found bound to peptides and not as free ions. Therefore, the Aβ must sequester the metals from other proteins and peptides.
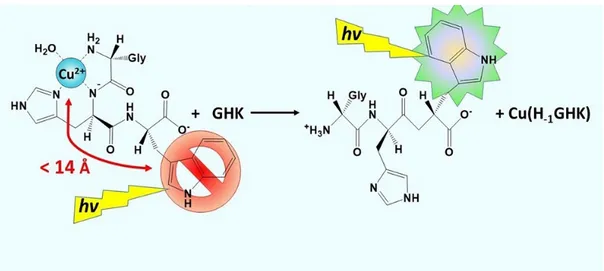
The primary research in this dissertation advances fluorescence method development to measure interpeptidic Cu(II) exchange kinetics to be able to measure this type of disease mechanism. The small peptides GHK (Gly – His – Lys) and DAHK (Asp – Ala – His – Lys) both chelate Cu(II) with nM affinity, have biological relevance as they are motifs found in human blood like Aβ, and chelate Cu(II) with similar nitrogen-rich binding ligands as Aβ. By substituting non-coordinating lysine residues with fluorescent tryptophan, the interpeptidic exchange rates can be measured since tryptophan fluorescence is statically quenched when within 14 angstroms of a paramagnetic bound Cu(II). Thus Cu(II) transfer from Cu(H-1GHW) to either GHK or DAHK can be monitored by recovered GHW fluorescence as the Cu(II) is exchanged and second-order kinetic rate constants were determined. This methodology was then used to monitor the Cu(II) exchange from truncated Cu(Aβ1-16) and Cu(Aβ1-28) complexes to GHW and DAHW,
iii
where second-order reaction kinetic rate constants were determined. While in the exchanges between Cu(H-1GHW) with GHK/DAHK the second-order rate constants were on the magnitude of 102 or 101 M-1s-1, respectively, the exchanges from Cu(Aβ) complexes were 2-3 orders of magnitude larger, 104 M-1s-1 (to GHW and DAHW). These differences in rate constant magnitude arise from the fact that the affinity of GHW (KA = 1013 M-1) for Cu(II) is larger than Aβ (KA =1010 M-1). This method development is an important step to an accurate measurement of the interpeptidic exchange between Aβ peptides, including in their fibril and plaque formations.
Since senile plaques are found in synaptic cleft spaces with nanometer distances between neurons, a model system was generated to study coordination reactions at the nanoscale. In order to do this, the metal ion would need to be released in a controlled manner. Studies of metal ion burst reactions through the use of photocages can simulate bursts of ions like those seen in the synaptic cleft. Zn(II) is often released in its ionic form within the synapse in its function as a neurotransmitter, so we simulated a burst of Zn(II) ions by using a photocage, [Zn(NTAdeCage)]- which releases Zn(II) when irradiated with light. The photocage was irradiated to release Zn(II) then we followed its reaction progress with an in situ chelator, Zincon, in reverse micelles and in bulk aqueous buffer. The coordination reaction was 1.4 times faster in an aqueous buffer than in reverse micelles, despite the Zn(II) and Zincon being closer in the nanoparticle. These observations suggested that there is an impact on coordination reactivity within a highly heterogeneous environment with a cell-like membrane, which is due to the partitioning of each ligand. We observe that the photocage stays in the water pool of the reverse micelle and the Zincon partitions into the membrane interface. Thus, the coordination reactivity is diminished, likely due to the need for Zn(II) to diffuse to the Zincon, crossing a highly organized Stern layer to encounter the Zincon. Whereas in aqueous buffer, these are free to encounter each other despite being hundreds of nanometers apart. These proof of concept studies are integral to studying initial binding dynamics of metal ions with peptides at the nanoscale present in cells and neuronal synapses.
Tuberculosis is a pathogenic bacterium which despite having a curable medication, can be drug-resistant. Menaquinone (MK) analogs with regiospecific partial saturation in their isoprenyl side chain, such as MK-9(II-H2), are found in many types of bacteria, including pathogenic Mycobacterium tuberculosis and function as electron transport lipids cycling between quinone and quinol forms within the electron transport
iv
system. While the function of MK is well established, the role of regiospecific partial saturation in the isoprenyl side chain on MK remains unclear and may be related to the redox function. Recently, an enzyme in M. tuberculosis called MenJ was shown to selectively saturate the second isoprene unit of 9 to MK-9(II-H2). The knockout expression of this enzyme was shown to be essential to the survival of the bacterium. A series of synthesized truncated MK-n analogs were investigated using a systematic statistical approach to test the effects of regiospecific saturation on the redox potentials. Using principal component analysis on the experimental redox potentials, the effects of saturation of the isoprene tail on the redox potentials were identified. The partial saturation of the second isoprene unit resulted in more positive redox potentials, requiring less energy to reduce the quinone. While full saturation of the isoprene tail resulted in the most negative potentials measured, requiring more energy to reduce the quinone. These observations give insight into why these partially saturated menaquinones are conserved in nature.
v
ACKNOWLEDGEMENTS
First, I want to thank my husband, Mr. Jason Brian Beuning, who has always been supportive of my academic career, goals, and dreams. You are my foundation, without which none of this was possible. So thank you for your love and always being a constant in my life, I love you. I want to thank my mother, Mrs. Bonnie Sue Raney, for her support, love, always believing in me, listening to me when graduate school was rough, helping me in my endeavors both financially and emotionally, and being a wonderful and kind mother. To my husband’s parents, Brian and Karen Beuning, thank you for all your support over the years in both my undergraduate and graduate studies. To Dan E. Gilmore, Stan Raney, and Mary A. Cox, and the rest of my family and friends, I thank you for your encouragement and love.
I would like to acknowledge and thank my mentor Debbie C. Crans for her support, understanding, fierce backing, and mentorship in my graduate career. Thank you for helping me become a better chemist. Similarly, I would also like to thank Nancy E. Levinger and Christelle Hureau for their mentorship on collaborative research projects. I would like to thank our other collaborators Shawn Burdette and Dean Crick. For my co-workers Jordan T. Koehn, Kaitlin A. Doucette, and all the others in the Crans group, I thank you for your collaborations, friendships, and support over the years. Thank you to my committee members for their support and advisement. I also thank the CSU Chemistry Department for everything they have done for me, including family medical leave support during my father’s illness and death. I would like to thank the Chateaubriand STEM Fellowship program for the funds to perform research in Toulouse, France, under the advisement of Christelle Hureau, I am truly grateful for the time I spent in your country, it was a fantastic experience and one I cherish.
Lastly, I would like to acknowledge my undergraduate mentees, Noah Barkley, Luca Zocchi, and Molly Hartman, for their hard work in helping collect data for my research projects. Thank you for your contributions to my research. I learned much from being your mentor as I hope you learned from me, good luck to you all in your future academic endeavors.
vi DEDICATION
My dissertation is dedicated to my late father, David Lee Cox, who passed away on April 18, 2018, at the age of 58, from lung cancer during my 5th year of graduate school. Though I only had 20 years with you, I
am forever grateful I was able to meet you when I was 17 and be your daughter for the time we had. I wish you could have seen me walk at graduation, first in the family to be called Doctor. We may not come
from much, but I know with finishing my Ph.D. in Chemistry, I made you proud. You always let me know that. I love you, I miss you every day, and I wish you were still with us. May you rest in peace and be free
vii TABLE OF CONTENTS ABSTRACT ... ii ACKNOWLEDGEMENTS ... v DEDICATION ... vi LIST OF TABLES ... x
LIST OF FIGURES ... xii
LIST OF EQUATIONS ... xv
Chapter 1 – Introduction and Spectroscopy Backgrounds ... 1
1.1) Introduction to the research projects and their significance ... 1
1.2) Absorption and fluorescence spectroscopy ... 4
1.3) Kinetic treatment of fluorescence data ... 9
1.4) Nuclear magnetic resonance ... 13
1.5) Electron paramagnetic resonance ... 17
1.6) Electrochemistry and cyclic voltammetry ... 20
1.7) Spectroelectrochemistry ... 23
Chapter 1 References ... 25
Part 1) Measurement of The Kinetic Rate Constants of Interpeptidic Divalent Transition Metal Ion Exchange in Neurodegenerative Disease ... 28
Chapter 2 – Measurement of Interpeptidic Cu(II) Exchange Rate Constants by Static Fluorescence Quenching of Tryptophan... 29
2.1) Summary ... 29
2.2) Introduction to interpeptidic exchange kinetics using tryptophan fluorescence quenching and small Cu(II) tri- and tetra-peptide complexes ... 29
2.3) Experimental Methods ... 32
2.3.1) Materials ... 32
2.3.2) Instrumentation and software ... 32
2.3.3) UV-vis spectroscopy ... 32
2.3.4) Fluorescence spectroscopy and sample preparation ... 33
2.3.5) Electron paramagnetic resonance spectroscopy and sample preparation ... 34
2.3.6) Stock peptide preparation and concentration determination ... 35
2.4) Results and discussion ... 36
2.5) Conclusions ... 43
2.6) Unpublished work on the reverse exchange of Cu(H-1GHK) + GHW ... 43
Chapter 2 References ... 44
Chapter 3 – Measurement of Interpeptidic Cu(II) Exchange Rate Constants from Truncated Cu(II) – Amyloid-beta Complexes to Small Peptide Motifs by Tryptophan Fluorescence Quenching ... 47
3.1) Summary ... 47
3.2) Introduction to the amyloid-beta peptide, Alzheimer’s disease, and the interpeptidic Cu(II) exchange of Cu(Aβ) complexes with tryptophan-containing small tri- and tetra-peptides.... ... 47
3.3) Experimental Methods ... 53
3.3.1) Materials ... 53
3.3.2) Instrumentation ... 53
3.3.3) Determination of stock peptide concentrations ... 54
3.3.4) Creation of Cu(Aβ) complexes ... 54
3.3.5) Fluorimetry sample preparation ... 54
3.3.6) EPR sample preparation ... 54
3.3.7) Software ... 55
3.4) Results and discussion ... 55
3.5) Conclusions ... 62
Chapter 3 References ... 63
Chapter 4 – Coordination Chemistry of a Controlled Burst of Zn2+ in Bulk Aqueous and Nanosized Water Droplets with a Zincon Chelator ... 66
viii
4.1) Summary ... 66
4.2) Introduction to Zn2+ bursts by Zn(NTAdeCage) photolysis, reverse micelles, and Zincon ... 66
4.3) Experimental Methods ... 69
4.3.1) Materials ... 69
4.3.2) Instrumentation ... 69
4.3.3) Preparation of stock NTAdeCage3-, Zincon2-, and Zn2+ solutions... 69
4.3.4) Sample preparation for UV-vis spectroscopy and photolysis experiments ... 70
4.3.5) Aqueous sample preparation ... 70
4.3.6) Reverse micelle sample preparation ... 70
4.3.7) Photolysis sample handling ... 71
4.3.8) Photolysis experiment design ... 71
4.3.9) NMR sample preparation ... 72
4.3.10) Processing software used in analysis ... 72
4.4) Results and discussion ... 73
4.4.1) Aqueous and reverse micelle control experiments performed ... 73
4.4.2) Nuclear Magnetic Resonance analysis of Zincon2- and [Zn(Zincon)]2- reverse micelle locations ... 78
4.4.2.1) The NMR analysis of Zincon2- in aqueous buffer, reverse micelles, and acetone chemical environments ... 78
4.4.2.2) The NMR analysis of [Zn(Zincon)]2- in aqueous buffer and reverse micelle chemical environments ... 84
4.4.2.3) The NMR analysis of [Zn(Zincon)]2- coordination geometry ... 88
4.4.2.4) The analysis of aromatic chemical shifts in the 1H NMR spectra of Zincon 2-and [Zn(Zincon)]2- in aqueous solution confirm isomer content ... 89
4.4.3) Photolysis experiments that generate light-induced Zn2+ bursts at the nanoscale in reverse micelles ... 90
4.5) Conclusions ... 93
Chapter 4 References ... 94
Part 2)The Electrochemistry of Truncated Menaquinone Electron Transporters with Saturated Isoprene Side Chains Important in Tuberculosis ... 98
Chapter 5 – Redox Potentials of Truncated Menaquinone Analogs in Aprotic Solvents are Sensitive to Saturation in the Isoprene Side Chain ... 99
5.1) Summary ... 99
5.2) Introduction to menaquinones, their redox processes, and importance in tuberculosis ... 100
5.3) Experimental Methods ... 103
5.3.1) Materials ... 103
5.3.2) Electrochemical methods, instrumentation, and analysis ... 104
5.3.2.1) Cyclic voltammetry electrodes ... 104
5.3.2.2) Instrumentation and software ... 104
5.3.2.3) Sample preparation ... 105
5.3.2.4) Diffusion coefficient analysis ... 105
5.3.3) Absorption spectroelectrochemistry methods ... 106
5.3.3.1) Pine Research Honeycomb spectroelectrochemical cell cuvette ... 106
5.3.3.2) Avantes optics for UV-vis absorption spectroscopy ... 106
5.3.4) Statistical analysis of MK-n redox potentials ... 107
5.3.4.1) Principal component analysis ... 107
5.3.4.2) Student’s t tests ... 108
5.4) Results and discussion ... 109
5.4.1) Cyclic voltammetry and redox potentials ... 109
5.4.2) Statistical comparisons with Student’s t tests and principal component analysis ... ..115
5.4.3) Diffusion coefficients ... 119
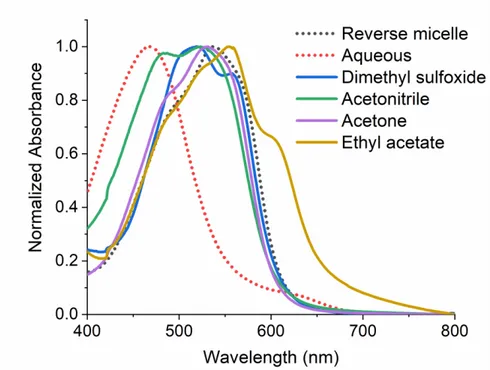
5.4.4) Absorption spectroelectrochemistry of MK-n analogs in MeCN and DMSO ... 120
5.5) Conclusions ... 123
5.6) Unpublished work on the unsaturated MK-4, MK-7, and MK-9 analogs ... 124
ix
Chapter 6 – Future Perspectives ... 136
Appendix A) Contributions to the co-authored paper entitled “Interaction of a Biguanide Compound with Membrane Model Interface Systems: Probing the Properties of Antimalaria and Antidiabetic Compounds” ... 140
A.1) Statement of contributions ... 140
A.2) Experimental method contributions ... 140
A.2.1) Preparation of aqueous stock solutions of 1-phenylbiguanide (PBG) ... 140
A.2.2) Preparation of the 2D 1H1H NMR NOESY sample in an AOT reverse micelle solution with PBG ... 141
A.2.3) 2D NOESY NMR spectroscopy ... 141
A.3) Results and discussion contributions: 1-Phenylbiguanide (PBG) in an AOT RM 2D NOESY study ... 141
A.4) Unpublished work using a small volume percent of deuterated cyclohexane within 2,2,4-trimethylpentane as the NMR deuterium lock instead of D2O to enable the use of H2O in the reverse micelle water pool ... 144
Appendix A References ... 149
Appendix B) Contributions to the co-authored paper entitled “A Synthetic Isoprenoid Lipoquinone, Menaquinone-2, Adopts a Folded Conformation in Solution and at a Model Membrane Interface”... 150
B.1) Statement of contributions ... 150
B.2) Experimental contributions ... 150
B.3) Results and discussion contributions: Electrochemistry of MK-2 in different solvents ... 150
B.4) Supporting information contributions ... 153
B.4.1) Electrochemistry experimental methods ... 153
B.4.2) 1D 1H NMR spectra of MK-2 with the electrolyte TBAP ... 155
B.4.3) Electrochemical results, interpretation, and discussion ... 156
Appendix B References ... 158
Appendix C) Contributions to the co-authored paper entitled “Investigating Substrate Analogues for Mycobacterial MenJ: Truncated and Partially Saturated Menaquinones” ... 160
C.1) Statement of contributions ... 160
C.2) Results and discussion contributions: Reactivity of MK-1 and MK-1(H2) in different organic solvents: Electrochemistry ... 160
Appendix C References ... 165
Appendix D) Unpublished contributions to the cyclic voltammetry and spectroelectrochemical method development and data interpretation of vanadium(V) catechol Schiff base compounds ... 166
D.1) Statement of contributions ... 166
D.2) Background ... 166
D.3) Electrochemical and spectroelectrochemical methods and instrumentation ... 167
D.4) Results and discussion ... 168
D.5) Conclusion and future experiments... 171
x
LIST OF TABLES
Chapter 1
1.1) Example of experimental calibration curve data taken for GHW in 0.1 M HEPES at pH 7.4 ... 9 1.2) Example of the approximate concentration profiles used in the method of initial rates for the Cu(H-1GHW) to GHK/DAHK exchanges ... 10 Chapter 2
2.1) Cu(II) exchange rate constants of some selected systems ... 31 2.2) Rate, rate constant, and concentration information for the Cu(H-1GHW) + GHK exchange .. 40 2.3) Rate, rate constant, and concentration information for the Cu(H-1GHW) + DAHK exchange .... ... 40 Chapter 3
3.1) Values of charge and deprotonated amide nitrogen for use in reaction scheme in Eq. 3.1 ... 52 3.2) Approximate concentration profiles used in the interpeptidic exchanges... 56 3.3) Conditional second-order rate constants between P (P = GHW, DAHW, or GGW) + Cu(Aβ) exchanges at the given pH in 0.1 M HEPES ... 57 Chapter 4
4.1) The Gaussian fitting parameters for the fit of Zincon in reverse micelles ... 77 4.2) Chemical shifts and changes of Zincon aromatic protons in aqueous, reverse micelle, and acetone-D2O chemical environments... 80 4.3) Chemical shifts and differences of [Zn(Zincon)]2- aromatic protons in aqueous and reverse micelle environments ... 86 4.4) The chemical shifts and differences of Zincon2- and [Zn(Zincon)]2- aromatic protons in D20 . 89 Chapter 5
5.1) Molecular mass, masses weighed, and physical appearances of MK-n analogs ... 103 5.2) Cathodic peak potentials used for spectroelectrochemical absorption spectroscopy ... 107 5.3) Principal component analysis matrix ... 107 5.4) The principal component analysis eigenvalues of the correlation matrix, percentage of variance, and cumulative percentage ... 108 5.5) Average E1/2 vs. Fc+/Fc for each MK-n with standard deviations (σ) and 95% CL ... 111 5.6) Student’s t tests of measured redox process E1/2 vs. Fc+/Fc of MK-n based on differences in solvent environment ... 112 5.7) The absolute change in the redox potential of Q/Q●- ΔE1/2 vs. Fc+/Fc (mV) of all MK-n
analogs ... 113 5.8) Highest confidence level based on Student’s t tests of the differences of Q/Q●- E1/2 vs. Fc+/Fc based on the extent saturation of the isoprene chain for the same MK-n length in the same solvent environment ... 117 5.9) Highest confidence level based on Student’s t tests of the differences of Q/Q●- E1/2 vs. Fc+/Fc based on differences in length and saturation of isoprene chain in the same solvent environment ... 118 5.10) Diffusion coefficient constants of the oxidized MK-n species, values are given at 90% confidence ... 119 5.11) Detailed absorption maximum wavelengths for MK-n analogs spectroelectrochemistry in MeCN and DMSO ... 122 5.12) Quinoid absorption shifts of unsaturated versus fully saturated MK analogs ... 123 5.13) The average E1/2 Q/Q●- and Q●-/Q2- vs. Fc+/Fc with standard deviations and 95% CL of MK-4, MK-7, and MK-9 ... 125 5.14) The diffusion coefficients and masses weighed for MK-4, MK-7, and MK-9 ... 125
xi
5.15) The values added to the PCA matrix for MK-4, MK-7, and MK-9 ... 126 5.16) Highest confidence from Student’s t tests of MK-4, MK-7, and MK-9 in different solvent environments ... 129 5.17) Highest confidence from Student’s t tests of all analogs compared to MK-4, MK-7, and MK-9 in the same solvent environment ... 130 Appendix A
A.1) 1HNMR studies of H2O chemical shift (ppm) change due to environmental changes from NaAOT RM size and d12cyclohexane volume as compared to known literature values of HOD. 146 Appendix B
B.1) Averaged half-wave potentials of MK-2 in organic solvents ... 152 B.2) Peak current ratios ipc/ipa and number of electrons (n) of MK-2 Q/Q⚫- and Q⚫-/Q2- redox processes ... 155 Appendix D
D.1) Half-wave potentials and diffusion coefficients of the VO(HSHED)(cat) complexes in
acetonitrile at 95% confidence ... 169 D.2) The absorption spectroscopy maximum wavelengths of LMCT bands of VO(HSHED)(cat) complexes in acetonitrile ... 170
xii
LIST OF FIGURES
Chapter 1
1.1) Fluorescence and absorption diagrams ... 5
1.2) Cartoon schematic of tryptophan fluorescence quenching ... 6
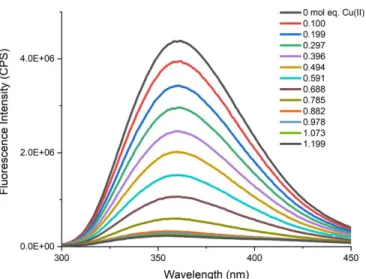
1.3) The fluorescence intensity of GHW being quenched by the addition of mol equivalence of Cu(II) ... 7
1.4) The anisotropic electronic transition states of tryptophan indole fluorophore ... 7
1.5) An example of a fluorescence calibration curve created for GHW ... 8
1.6) The kinetic trace of an equimolar exchange of 10 µM Cu(H-1GHW) + 10 µM GHK ... 10
1.7) The log rate versus log [Peptide] graphs for reaction order determination ... 11
1.8) Example of the second-order fitting performed on the kinetic data involving Cu(Aβ) complexes ... 12
1.9) The energy diagram of the simplest half-integer spin in NMR ... 13
1.10) The energy diagram of an electron in EPR ... 17
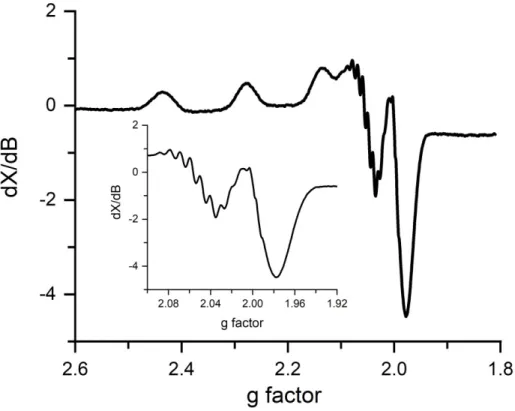
1.11) The powder (low temperature) EPR spectrum of Cu(H-1GHW) and of Cu(H-2(GHW)2) ... 19
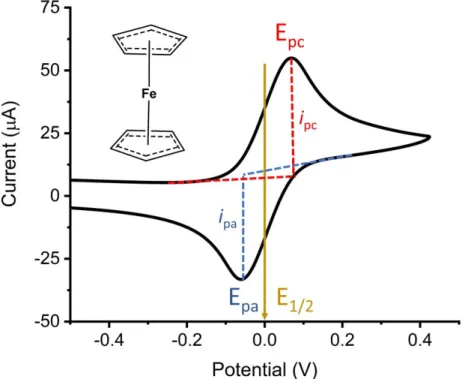
1.12) Information which can be interpreted from an example cyclic voltammogram ... 20
1.13) Images of a classic three-electrode cyclic voltammetry setup ... 22
1.14) Images of the spectroelectrochemical setup ... 23
Chapter 2 2.1) Solution structures of Cu(H-2DAHK)/Cu(H-2DAHW) and Cu(H-1GHK)/Cu(H-1GHW) ... 30
2.2) UV-vis absorption spectra of Cu(H-2DAHK)/Cu(H-2DAHW) and Cu(H-1GHK)/Cu(H-1GHW) .. 33
2.3) Normalized UV-vis absorption spectra of apo (unbound) peptides ... 33
2.4) Determination of GHK and DAHK concentrations by Cu(II) titration ... 36
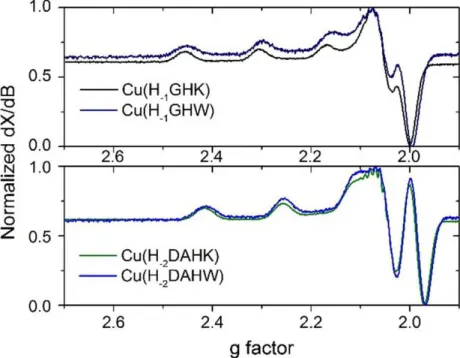
2.5) Powder EPR spectra of Cu(H-2DAHK)/Cu(H-2DAHW) and Cu(H-1GHK)/Cu(H-1GHW) ... 37
2.6) The log rate versus log [Peptide] graphs for reaction order determination in the Cu(H-1GHW) to GHK and DAHK exchanges ... 38
2.7) Kinetic traces of Cu(H-2DAHW) to GHK and DAHK... 39
2.8) Low-temperature EPR spectra of the 1:2 Cu(II):GHK ternary species formation ... 42
Chapter 3 3.1) Aβ sequence and Cu(Aβ) component I and II binding sites... 50
3.2) Structures of Cu(H-2DAHW), Cu(H-1GHW), and Cu(H-2GGW) and their metallocycles ... 51
3.3) Low-temperature EPR and UV-vis spectrums of Cu(H-2GGW) complex... 55
3.4) Second-order fitting of the approximate 4 µM GHW + 5 µM Cu(Aβ) exchanges ... 57
3.5) Second-order fitting of the approximate 4 µM DAHW + 5 µM Cu(Aβ) exchanges ... 58
3.6) Second-order fitting of the approximate 4 µM GGW + 5 µM Cu(Aβ) exchanges ... 58
3.7) Low-temperature EPR of ternary species formation of GHW-Cu(Aβ1-16) ... 60
Chapter 4 4.1) Reaction schemes for [Zn(NTAdeCage)] photolysis and [Zn(Zincon)] complexation; Cartoon reverse micelle schematic ... 68
4.2) Control experiments of UV-vis absorption spectra of Zincon, [Zn(NTAdeCage)], and [Zn(Zincon)] in aqueous, reverse micelles, and acetone ... 73
4.3) Control absorption experiments to determine that [Zn(NTAdeCage)] remains intact in the presence of Zincon ... 74
4.4) Control absorption experiments to determine that Zn2+ preferentially binds to NTAdeCage in the presence of Zincon and NTAdeCage... 75
4.5) Control absorption experiments that show NTAdeCage sequestered a stoichiometric amount Zn2+ from [Zn(Zincon)] ... 75
xiii
4.7) The fit of the normalized absorption spectrum Zincon2- in reverse micelles to a sum of
Gaussian peaks ... 77
4.8) Control absorption spectra of Zincon with varied reverse micelle size with a constant concentration or varied concentration with a constant reverse micelle size ... 77
4.9) Labeling of Zincon aromatic protons for NMR analysis ... 78
4.10) The stacked 1H NMR spectra showing signals arising from the aromatic region of the hydrogens of unbound Zincon2- in D2O, d6acetone (w/ 7% v/v D2O), and reverse micelles ... 79
4.11) The 1H NMR spectrum of the aromatic region of Zincon2- in D2O at pH 9.09 (pD to 9.49) ... 81
4.12) A 1H1H COSY NMR plot of the aromatic region of Zincon2- in D2O at pH 9.09 (pD 9.49) ... 82
4.13) The 1H NMR spectrum of the aromatic region of Zincon1- in d6-acetone with 7.7% D2O ... 82
4.14) A 1H1H COSY plot of the aromatic region of Zincon1- in d6-acetone with 7.7% D2O ... 83
4.15) A 1H 13C HSQC plot of the aromatic region of Zincon1- in d6 acetone with 7.7% D2O ... 83
4.16) The 1H NMR spectrum of the aromatic region of Zincon2- in a reverse micelle... 84
4.17) The stacked 1H NMR spectra of [Zn(Zincon)]2- in D2O and reverse micelles ... 85
4.18) The 1H NMR of the aromatic region spectrum of [Zn(Zincon)]2- in D2O at pH to 9.13 (pD 9.53) ... 87
4.19) The 1H1H COSY NMR of the aromatic region of [Zn(Zincon)]2- in D2O at pH 9.13 (pD 9.53) ... 87
4.20) The 1H NMR spectrum of the aromatic region for [Zn(Zincon)]2- in reverse micelles ... 88
4.21) Cartoon representing the interpreted reverse micelle partitioning of the three species ... 90
4.22) UV-vis absorption spectra marking the progressive photolysis of [Zn(NTAdeCage)]1- and Zincon2- in 40 mM HEPES at pH 7.40 and within AOT-isooctane (0.02 M AOT) reverse micelles ... 91
4.23) The results of laser photolysis conditions on samples in the absence of NTAdeCage3- ... 91
4.24) The normalized Zincon2- absorbance as a function of exposure energy in aqueous buffered solution and reverse micelles ... 92
Chapter 5 5.1) The reduction of a MK-n analog within bacterial membrane-bound enzymes versus aprotic solvent ... 100
5.2) The structures of all truncated MK-n analogs examined by cyclic voltammetry ... 101
5.3) Principal component analysis Scree plot ... 108
5.4) The cyclic voltammograms of truncated MK-n analogs in MeCN, DMSO, and pyridine ... 110
5.5) All truncated MK-n averaged E1/2 vs. Fc+/Fc of the Q/Q●- redox process compared by the solvent used ... 113
5.6) Principal component analysis from a matrix of all measured Q/Q●- redox potentials of each MK-n analog in each solvent examined ... 115
5.7) Spectroelectrochemical normalized absorption spectra of each truncated MK-n analog in anhydrous MeCN ... 120
5.8) Spectroelectrochemical normalized absorption spectra of each truncated MK-n analog in anhydrous DMSO ... 121
5.9) Cyclic voltammograms of MK-4, MK-7, and MK-9 in MeCN, DMSO, and pyridine ... 126
5.10) Principle component analysis with all truncated MK-n and MK-4, MK-7, and MK-9 (expanded Figure 5.6) ... 127
5.11) Plot of all averaged redox potentials of all MK-n versus solvent (expanded Figure 5.5) .. 127
Appendix A A.1) Structure of 1-phenylbiguanide (left) and AOT (right) and their aromatic proton assignments for NMR analysis ... 141
A.2) Partial 1H NMR NOESY spectrum of 100 mM PBG at pD (= pH + 0.4) 7.07 in 750 mM AOT ... 142
xiv
A.3) Cartoon illustrating the suggested location of 1-phenylbiguanide in the AOT reverse micelle ... 144 A.4) The 1HNMR spectra of AOT/isooctane/H2O with varying reverse micelle size and percent of added deuterated cyclohexane ... 146 A.5) The 2D 1HNOESY plot of 0.08 M PBG, pH = 7.03, w0 = 10 in 0.75 M AOT in isooctane, and 5 % (v/v) d12cyclohexane ... 148 Appendix B
B.1) Illustration of the electron reduction of the quinone to semiquinone, and the second one-electron reduction of semiquinone to dianion ... 151 B.2) Three representative CVs of 2 mM MK-2 in CH3CN, DMSO, and pyridine ... 152 B.3) Measured E1/2 (vs Fc+/Fc in V) of MK-2 Q/Q⚫– and Q⚫–/Q2– redox processes vs solvent .... 153 B.4) 1D 1H NMR (400 MHz) spectra of MK-2 with and without TBAP in all solvents ... 155 Appendix C
C.1) Cyclic voltammograms of MK-1 and MK-1(H2) in MeCN, DMSO, and pyridine ... 161 C.2) 1H NMR (400 MHz) spectrum of MK-1 with and without electrolyte TBAP ... 161 C.3) Measured E1/2 (vs Fc+/Fc in V) of MK-1 and MK-1(H2) Q/Q•- and Q•-/Q2- redox process versus solvent ... 162 Appendix D
D.1) Structures of the VVO(HSHED)(cat) complexes ... 167 D.2) The cyclic voltammograms of the VO(HSHED)(cat) complexes in acetonitrile ... 168 D.3) The solution 51V NMR chemical shift, δ (ppm) of the VO(HSHED)(cat) complexes versus their half-wave potentials, E1/2 vs Fc+/Fc in mV in acetonitrile ... 169 D.4) The spectroelectrochemical spectra of the VO(HSHED)catechol complexes in acetonitrile ... 171
xv
LIST OF EQUATIONS
Chapter 1
1.1) Beer’s law ... 5
1.2) Fluorescence intensity ... 5
1.3) Effective fluorescence maximum concentration ... 5
1.4) Stern-Volmer ... 5
1.5) Rate law for Cu(H-1GHW) + GHK exchange ... 10
1.6) Second-order fitting for rate constant determination ... 12
1.7) NMR energy difference ... 14
1.8) Magnetogyric ratio ... 14
1.9) EPR energy difference ... 17
1.10) EPR g-factor ... 17
1.11) EPR hyperfine coupling constant ... 17
1.12) Half-wave potential ... 21
1.13) Charging current ... 21
1.14) Peak current ratio... 22
1.15) Randles-Sevcik and diffusion coefficient ... 22
1.16) Potential width ... 22
1.17) Number of electrons of the redox process in aprotic solvents ... 22
Chapter 2 2.1) Interpeptidic exchange reaction between Cu(H-1GHW) + P (P = GHK/DAHK) ... 32
2.2) EPR g-factor ... 34
2.3) Concentration of lysine peptide by Cu(II) titration ... 36
2.4) Rate law for Cu(H-1GHW) + P interpeptidic exchange ... 37
Chapter 3 3.1) Interpeptidic exchange reaction between Cu(Aβ) + P (P = GHW, DAHW, and GGW) ... 52
3.2) Unchanged second-order kinetic fitting of concentration data ... 52
3.3) The unmeasurable [Cu(Aβ)]t at any time, through measurable values ... 52
Chapter 4 4.1) Total photolysis exposure energy as a function of time, repetition rate, and laser power ... 93
Chapter 5 5.1) Student’s t test: tcalculated ... 109
5.2) Student’s t test: degrees of freedom ... 109
Appendix D D.1) Linear relationship between 51V NMR chemical shift and redox potential ... 170
1
CHAPTER 1: INTRODUCTION AND SPECTROSCOPY BACKGROUNDS
1.1 Introduction to the research projects and their significance
In this dissertation, the primary research goals were to use analytical spectroscopic method development to understand, measure, and/or quantify the mechanisms, physical and/or chemical properties of molecules and their reactions associated with two diseases, Alzheimer's disease (AD) and tuberculosis disease (TB). In 2016, according to the World Health Organization (WHO), listed the top 10 leading causes of death in the world where AD was #5 and TB was #10.1 The characterization of biological molecules and their reactions associated with a disease is often a very arduous task, involving many iterations until a reproducible assay is developed. These mechanisms can then be the targets for drug development, especially for those reaction mechanisms that are essential for disease progression. There are two primary research projects described in this dissertation. The first, Part 1, is concerned with the measurement of kinetic constants in the interpeptidic Cu(II) exchange of peptides associated with AD and is discussed in Chapters 2 and 3. The second, Part 2, is concerned with the differences in electrochemical redox potentials of a series of truncated regiospecifically saturated menaquinones (MK), which are essential electron transporters in Mycobacterium tuberculosis (M. tuberculosis) and are discussed in Chapter 5.
Unfortunately, no cure exists for AD despite three decades of continued research since the amyloid-beta peptide (Aβ) was first associated with the senile plaques that cause brain atrophy.2-3 The senile plaques are found in the synaptic cleft space between neurons and lead to their atrophy since the neurons can no longer signal to each other. Thus, the symptoms of dementia and memory loss occur, and eventually, death as the brain can no longer work properly. The Aβ peptide forms aggregates which accumulate into these senile plaques, where many aggregation mechanisms exist, for a complete background see Chapter 3 section 3.1. AD has a multi-causative pathology and is one reason why there is no cure. In 2019, the Alzheimer’s Association reported that AD currently affects 5.8 million Americans, costs $290 billion in only the treatment of symptoms, is the 6th leading cause of death in the United States, and every 65 seconds a person is diagnosed with the disease.4 As the world’s population increases and ages, these numbers are expected to rise until the cost of treatment surpasses a trillion dollars by 2050, with 14 million Americans affected.4 Despite all the research, no definitive cure or vaccine has been found.
2
Although, with the arrival of advanced gene therapy technologies like CRISPR, some hope is on the horizon. In a recent 2018 study, gene therapy was used to target specific genes that seem to play a harmful role in AD progressions like the allele APOE4 (apolipoprotein E) and swap in genes that play a protective role like the APOE2 allele.5 But these types of therapies are still in their infancy.
Part 1 of the dissertation includes the analytical method development to monitor and measure the kinetics of divalent metal ion exchange using optical spectroscopy. The divalent transition metal ions Cu(II) and Zn(II) are essential for all biological life, including humans, bacteria, fungi, and animals.6-17 Their presence is important for the structural and functional roles of many metalloproteins and biological processes. For example, Cu(II)is essential metal for proteins like ceruloplasmin, is a redox-active metal ion that participates in oxidative phosphorylation for mitochondrial energy production, and is an indispensable co-factor in some oxidases and peroxidases.7, 11, 13, 18-20 Zn(II) is an essential co-factor in metalloproteins like metallothioneins, it is the second most abundant transition metal that is vital to good health, and can be found in its ionic form in labile pools for its function as a neurotransmitter.6, 14, 16-17, 21-24 Both metals are considered essential in embryonic development, especially within the brain. Transition metals have an unfriendly biological history due to their inherent toxicity. However, the misconceptions about the roles of transition metals in biology are beginning to be considered. Their prevalence in disease mechanisms, including neurodegenerative disease, is becoming more widely understood as proteins associated with the diseases have many sites that these metals can bind to. The delicate balance of metal ion homeostasis in the body is important to both health and disease mechanisms.
The primary research project concerns the method development to measure the interpeptidic exchange rate constants of Cu(II) in small peptide motifs found in human blood and associated with neurodegenerative diseases like AD.25 Within the human blood and serum, GHK (Gly-His-Lys) is associated with human growth factor and is found intact as a tripeptide, and DAHK (Asp-Ala-His-Lys) is the N-terminus sequence of human serum albumin (HSA).19, 26-27 The amyloid-beta peptides (Aβ) are associated with AD where the full-length Aβ peptide can have 39 – 42 amino acid residues, and truncated forms also exist, see Chapter 3 section 3.1 for a complete background. Both Cu(II) and Zn(II) are found in 0.5 – 1.0 mM concentrations in the senile plaques associated with AD due to their complexation with the Aβ peptide.28 The complexation of Cu(II), Zn(II), and Fe(II) to the Aβ peptide has been shown to enhance the propensity
3
of the peptides to aggregate into the plaques and is one of the many pathologies of AD. Therefore, understanding the kinetics of exchange in these peptides with themselves or other biological peptide motifs will help to create drugs that can stop the exchange, sequester the metals from aggregates, or target the initial binding. Some drugs like clioquinol were developed to target the metal ion binding pathology of AD by trying to actively sequester Cu(II) and Zn(II) from Aβ complexes.28-30
There is a minor research project in Part 1 that concerns the light-induced photolytic release of Zn(II) at the nanoscale present in reverse micelles using photocaged complexes and monitoring of Zn(II) coordination with a ligand in situ.31 The ability to mimic metal ion bursts on the nanoscale can help to develop methods to monitor reactions at the cellular scale through the use of model membrane systems like reverse micelles or liposomes. The method of generating metal ion burst reactions in reverse micelles was developed for collaboration in the Crans and Levinger research groups to eventually study interpeptidic exchange or the initial binding dynamics of metal ions to Aβ peptides at the same scale found in the neuronal synaptic cleft, where senile plaques are found. Unfortunately, this extension from the proof-of-concept methodology presented in Chapter 4 has not been implemented to that goal yet, but is an important step to be able to monitor fast metal ion complexation at the nanoscale, and where mixing apparatus is too slow to measure sub-millisecond time-scale complexation mechanisms.
Part 2 of this dissertation includes the non-aqueous electrochemistry and spectroelectrochemistry method development to study certain menaquinone (MK, MK-n, n = number of isoprene units) electron transporters found in many pathogenic bacteria, such as M. tuberculosis. TB infects about a quarter of the world's population, according to the WHO.32 Although in 2017, only about 10 million people fell ill, where about 1.6 million of those perished.32 TB is epidemic in first and third world countries alike. While TB is curable through many first- and second-line medications, since it is a bacteria, it is prone to drug-resistance. Over 500 thousand cases of first-line drug rifampicin resistivity were reported in 2017, with some strains having multi-drug and extensive-drug resistivity.32 As the bacteria can have multi-drug resistivity, new disease mechanisms must be identified as drug targets. Other diseases like AIDS can complicate the progression of TB and lead to death. In the 1.6 million deaths associated with the disease in 2017, 0.3 million of those were people infected with HIV/AIDS.32 TB is the leading cause of death in those afflicted with HIV/AIDS (other than AIDS itself).
4
The partial regiospecific saturation of the second isoprene unit of the MK isoprenyl side chain is conserved in many pathogenic bacteria, including Mycobacterium, Corynebacterium, Halobacterium, and Brevibacterium families.33-36 An enzyme called MenJ is responsible for the regiospecific partial saturation of MK-9 to MK-9(II-H2) in TB.37-38 The prevalence of these beta-saturated MK analogs in so many bacteria may have to do with its redox function. A systematic statistical approach was used to determine the effects of isoprenyl side chain saturation on the redox reactivity of a series of unsaturated, partially saturated, and fully saturated truncated MK analogs.39 The truncated MK analogs we have studied have side chains with 1 – 3 isoprene units, which were synthesized by a colleague in the Crans laboratory, Dr. Jordan T. Koehn.
The following sections will introduce the relevant spectroscopy background for each instrumentation or method used for the characterization of the research projects described within. There is a section on the kinetic treatment of fluorimetry data. Real experimental examples are provided, where appropriate, to show how these approaches or methods were used within the research projects described herein. Each of the four major research projects has its own chapter. Lastly, an appendix is provided at the end for contributions to projects that are not discussed in the body of the dissertation, or those which were only co-authored contributions.
1.2 Absorption and fluorescence spectroscopy
Fluorescence is the measurement of the emission of light by a fluorophore upon absorption of light at a specific wavelength. Absorption is the measurement of the amount of light absorbed by the fluorophore. The absorption of light promotes electrons from the highest occupied molecular orbital (HOMO) ground state, So, to the lowest unoccupied molecular orbital (LUMO) excited state, S1, Figure 1.1. After excitation,
the fluorophore will return to the ground state by releasing the absorbed energy, which is called emission or radiative decay. This emission of absorbed energy is called fluorescence when it is from a singlet excited state (S1), or phosphorescence if from a triplet excited state (T1). The two states depend on the direction of the spin of the excited electron and are radiative releases of energy, which can be measured using fluorimetry spectrometers. The Stokes Shift arises from the fact that emission light always has a longer wavelength (lower energy) than the absorbed light, so the absorption spectrum is always at a shorter wavelength (higher energy) than the emission spectrum of the fluorophore. In Figure 1.1, the absorption
5
and fluorescence of the fluorescent tryptophan tripeptide, GHW (Gly-His-Trp), is shown, where the absorption maximum is 280 nm, and the emission maximum is 365 nm.
In absorption and emission spectroscopy, the Beer-Lambert law is expressed differently. For absorption spectroscopy, Eq. 1.1 shows that absorbance (A) is linearly proportional to the product of molar absorptivity (ε), concentration (C), and cuvette pathlength (ℓ). Similarly, in emission spectroscopy, Eq. 1.2 shows that fluorescence intensity (IF) is linearly proportional to the product of molar absorptivity (ε), concentration (C), and cuvette pathlength (ℓ), as well as the excitation source intensity (Io) and the quantum yield of the fluorophore (ϕf). Due to the dependence on excitation source intensity and quantum yield of a fluorophore, fluorescence spectroscopy often requires less concentrated solutions than absorbance spectroscopy and is much more sensitive. As a result, there is a maximum concentration where fluorescence intensity is still linearly proportional, Eq. 1.3.
(Eq. 1.1) A = ε C ℓ
(Eq. 1.2) IF = Io (2.303 ε C ℓ) ϕf
(Eq 1.3) Cmax = 0.05 * (ε ℓ)-1
(Eq 1.4) (I0F / IQ) = 1 + τf kq [Q]
Figure 1.1 Left Normalized intensity of the absorption and fluorescence spectrums of a tryptophan
containing tripeptide GHW. Right Schematic of absorption and emission in the HOMO to LUMO optical gap. Fluorescence is the radiative decay from S1 → S0 and phosphorescence is the radiative decay from T1 → S0. Intersystem crossing is the non-radiative deactivation from S1 → T1 then T1 → S0 and can happen in the presence of heavy atoms with paramagnetic electrons.
6
Fluorescence quenching is a signal response that follows the Stern-Volmer equation, which relates a fluorophore with its quencher, Eq. 1.4, where the ratio of the fluorescence intensity without a quencher present (I0F) to the fluorescence intensity with a quencher present (IQ) is equal to 1 plus the product of the lifetime of the emission excited state of only the fluorophore (τf), the quencher rate coefficient (kq) and the concentration of quencher ([Q]). In the system described below, the fluorophore is tryptophan, and the quencher is a bound paramagnetic Cu(II). The Cu(II) quenches the fluorescence of tryptophan by a relaxation mechanism called the external heavy atom effect. When the Cu(II) is within 14 Å of the tryptophan, the paramagnetic electron from Cu(II) interferes with the intersystem crossing of the fluorophore, Figures 1.1, 1.2. The intersystem crossing is the rate of change between singlet S1 and triplet T1 excited states, which is usually extremely slow. The presence of a paramagnetic electron from a heavy atom greatly enhances this rate to a point where the emission of absorbed light is deactivated. Specifically, the non-radiative deactivation due to the increase in the rate of intersystem crossing results in no light to be emitted, and thus the fluorescence is quenched. As seen in Figure 1.3, as Cu(II) is added to a solution of GHW (pH 7.4, 0.1 M HEPES), the fluorescence intensity decreases. This is a static fluorescence quenching as the Cu(II) must be bound to the peptide for this to occur and does not occur if the Cu(II), which may be bound to another ligand in solution, collides with the tryptophan, as in other types quenching mechanisms.
Figure 1.2 Cartoon schematic of the static tryptophan fluorescence quenching in inter-peptidic Cu(II)
7
Tryptophan absorbance and fluorescence are extremely sensitive to the surrounding chemical environment due to two anisotropic perpendicular electronic transitions present in the indole fluorophore,
Figure 1.4. These two anisotropic states are denoted as 1La and 1Lb electronic transitions. While both absorb light at 280 nm, when excitation light of 290 nm is used, the 1La electronic transition is favored for emission fluorescence. Absorption is associated more with the 1Lb electronic transition, and emission from this transition is rare. The source of environmental sensitivity due to the 1La transition state arises from the creation of a large dipole, where the pyrrole ring is partially positively charged, as compared to the 1Lb transition. Changes in the solvent environment can affect the dipole of the 1La transition state by interactions such as hydrogen bonding to the nitrogen’s hydrogen or changes in pH. These effects make tryptophan’s fluorescence extremely sensitive to its solvent environment.
Figure 1.3 The fluorescence intensity of GHW being quenched by addition of mol equivalence of Cu(II).
8
Calibration curves are performed whenever a set of fluorimetry data is acquired to be able to convert tryptophan fluorescence intensity (counts per second, CPS) to concentration. As tryptophan is extremely sensitive to its surrounding environment, calibrations must be performed in the same conditions as the kinetic experiments with the same instrument parameters such as slit width, excitation (λexcitation), and emission (λemission) wavelengths. A blank measurement without any fluorescent peptide is taken and subtracted out from all data points. An example of a calibration curve for GHW is given in Figure 1.5. The concentration of GHW peptide is determined through absorption measurements of the stock solutions, where an average and standard deviation is obtained. Then the error is propagated from the volumes of pipettes used to make working solutions and calibrator additions in the fluorescence calibration curve, Table
1.1. The calibration is repeated three times, and the error in fluorescence intensity is a standard deviation
of those three runs, Table 1.1. The error in concentration, as well as the error in fluorescence intensity CPS, is considered by using OriginPro (student versions, 2018b and 2019b) software by using the instrumental error weighting option, Figure 1.5. In 0.1 M HEPES at pH 7.40, the GHW fluorescence is linearly proportional to concentration, where the slope and y-intercept are used to determine the concentration in the experimental kinetic data.
Figure 1.5: An example of a calibration curve created for GHW (0.1 M HEPES, pH 7.40) using the data
in Table 1.1 and analyzed in OriginPro software. Instrumental error weighting is used, the error in [GHW] are the red error bars and the error in fluorescence intensity are the blue error bars. Instrumental parameters include, 1.5 nm slit width, λexcitation = 290 nm, and λemission. = 365 nm.
9 1.3 Kinetic treatment of fluorescence data
Two approaches were used to determine the second-order kinetic rate constants of the interpeptidic exchange of Cu(II). The first approach uses the method of initial rates to determine reaction orders and the rate constant for the Cu(II) exchange in the small peptides (GHK, DAHK, etc.). This approach was used in the exchange of Cu(II) from Cu(H-1GHW) to GHK or DAHK or the reverse exchange of Cu(H-1GHK) to GHW, described in Chapter 2. The second approach uses second-order fitting of the kinetic data in the exchange of Cu(II) from truncated Cu(Aβ1-16) and Cu(Aβ1-28) complexes to GHW, DAHW, or GGW, found in Chapter 3. These exchanges were much faster than the exchanges examined previously, and the method of initial rates could not be consistently employed.
The method of initial rates can determine rate law, reaction orders, and rate constants of a reaction and is a very straightforward kinetic treatment of data. Because these peptide complexes can have different coordination chemistry when the metal ion complex and peptide are in excessive concentrations, a pseudo-first-order approach cannot be used. Often, kinetic measurements are made in pseudo-pseudo-first-order conditions where one reactant is in large excess compared to another reactant. This can induce other complexes to form, such as Cu(H-2(GHW)2). To avoid this, we used very similar concentration profiles in the exchanges, careful to not put any one reactant in a large excess of the other.
In a very simple A + B → C + D reaction with a rate law, rate = k [A]m [B]n, the method of initial rates requires two sets of kinetic data to be acquired. In one set of data, the concentration of B is held constant while the concentration of A is varied in at least four different experimental conditions to determine the order m of reactant A. Similarly, to determine the order n of reactant B, the concentration of A is held constant
Table 1.1: Example of experimental calibration curve data taken for GHW in 0.1 M HEPES at pH 7.40
shown in Figure 1.5. Actual [GHW], M Error [GHW], M IF @ 365 nm, CPS Error IF @ 365 nm, CPS 1.01E-06 5.36E-08 13863 1414 2.02E-06 1.20E-07 27180 135 3.03E-06 1.97E-07 39247 586 5.03E-06 3.62E-07 64543 975 6.03E-06 4.03E-07 76157 1726 8.03E-06 5.49E-07 100080 2834
10
while the concentration of B is varied in at least four different experimental conditions. For example, Table
1.2 lists the experimental conditions used to determine the orders in the exchange of Cu(H-1GHW) to GHK or DAHK, where reactant A is Cu(H-1GHW), and reactant B is GHK or DAHK. The rate is determined in M/s using an Excel 2016 slope function of the data points in that region, Figure 1.6, as tryptophan fluorescence is recovered. Then the slope of log rate versus log [peptide] plots determines the order for that reactant,
Figure 1.7, where all reaction orders were determined to be one. Finally, the rate law is determined as the
orders of reactants are known, and the rate constant can be found Eq. 1.5.
(Eq. 1.5) rate = k [Cu(H-1GHW)] [GHK]
Table 1.2: Example of the approximate concentration profiles used in the method of initial rates for the
Cu(H-1GHW) to GHK/DAHK exchanges.
[Cu(H-1GHW)]initial, µM [GHK]/[DAHK]initial, µM Exp A 10 5 10 10 10 15 10 20 Exp B 3 5 5 5 8 5 10 5
Figure 1.6: The kinetic trace of an equimolar exchange of 10 µM Cu(H-1GHW) + 10 µM GHK. The yellow dotted line is a tangent to visualize the initial rate of the exchange. The data within the two blue horizontal lines was used to determine the rate in M/s using the slope function in Excel 2016.
11
The fitting approach used in the exchanges of truncated Cu(Aβ) complexes to the fluorescent GHW, DAHW, or GGW followed Eq. 1.6. In Eq. 1.6, the initial concentrations at t = 0 of [𝐶𝑢(𝐴β)]0 and [𝐺𝐻𝑊]0 are known, while the [𝐺𝐻𝑊]𝑡 is determined from the fluorescence at each data point at a time, t. The kinetic data was gathered in a similar fashion as the previous work; reactant concentrations were kept close to each other, calibration curves generated each time a set of data was gathered, and fluorescence intensity data were converted to concentration before analysis using calibration curves. Since this approach is looking at a decrease in tryptophan rather than a recovery of fluorescence like in our previous experiments, a smaller slit width was used to discourage an inner filter effect (IFE). IFE happens when some of the emitted light is reabsorbed by the fluorophore. Thus a decrease in fluorescence is observed but may not be due to the exchange. In order to determine a slit width that does not lead to an IFE, the fluorescence of the tryptophan peptides was monitored over the time frame of the kinetic experiment, and 1.5 nm was chosen as no decreases in fluorescence CPS was observed. As these exchanges were much faster than the previous work, the method of initial rates did not produce reliable rate constants or orders, due to the inability to get data points within the linear portion of the kinetic curve. We must manually add the reactants
Figure 1.7: For order analysis of Cu(H−1GHW) (green circle, m = 0.966 ± 0.168, R2 = 0.91), a constant 5 μM GHK was used, for that of GHK (blue triangle, m = 1.09 ± 0.19, R2 = 0.91), a constant 10 μM Cu(H−1GHW) was used, and for that of DAHK (black square, m = 1.00 ± 0.15, R2 = 0.94), a constant 10 μM Cu(H−1GHW) was used. Error bars indicate two to three replicates.
12
due to the lack of any stopped-flow apparatus, which usually takes about four to five seconds. Within that 4 – 5 seconds in these exchanges, a large decrease in fluorescence was observed, see inset Figure 1.8. Therefore, second-order fitting of the data using Eq. 1.6 allowed for the determination of rate constants by using the first 10 - 40 seconds of kinetic data (depending on the exchange examined), setting the y-intercept to zero, and graphing the left side of the equation versus time, where the slope of the line is the second-order rate constant. These data were graphed, and their slopes determined in OriginPro 2019b (student version), then the slopes can be averaged and 95% confidence levels obtained. Figure 1.8 shows an example of graphing the transformed kinetic data to determine the rate constant from the slope of the line, where the y-axis is the left side of Eq. 1.6.
(Eq. 1.6) 1
[𝐶𝑢(𝐴β)]0−[𝐺𝐻𝑊]0∗ ln (
[𝐺𝐻𝑊]0∗([𝐶𝑢(𝐴β)]0−([𝐺𝐻𝑊]0−[𝐺𝐻𝑊]𝑡))
[𝐶𝑢(𝐴β)]0[𝐺𝐻𝑊]𝑡 ) = 𝑘 ∗ 𝑡
Figure 1.8: Example of the second-order fitting performed on the kinetic data in the interpeptidic
exchanges involving Cu(Aβ) complexes. The exchange shown here is 4 µM GHW + 5 µM Cu(Aβ1-16) at pH 7.40 in 0.1 M HEPES. The first 20 s of data are used. The slope is determined by setting the y-intercept to zero. Inset is the kinetic concentration versus time data.
13 1.4 Nuclear magnetic resonance
Nuclear magnetic resonance, NMR, is an atomic level absorption spectroscopy which gives structural and environmental information about a molecule and its atoms through the absorption of radio waves under an applied magnetic field. Historically, it is used to elucidate the structures and purity of natural and synthesized molecules as well as interpretation of how the chemical environment can alter the chemical shifts in an NMR spectrum. In cartesian xyz coordinates, spin (angular momentum) is along the z-axis, where the magnetic quantum number, mS, is spin-up or spin-down, and where the number of angular momentum states is equal to 2S + 1. When an external magnetic field is applied to an atom with a non-zero spin number, an induced splitting of the spin states occurs when irradiated with an appropriate radio frequency, ν, and an energy difference between the two states is generated, Figure 1.9. This promotion of atoms to higher energy states is called resonance. The population of atoms in each energy state is denoted as Nα (lower energy state) and Nβ (higher energy state), and there is always a slight excess of population in the lower energy state, Nα > Nβ, following the Boltzmann distribution. In the absence of an applied magnetic field, the spin states are degenerate, or at the same energy. The energy difference, ΔE, arises
Figure 1.9: The energy diagram of the simplest half-integer spin, I = 1/2 resulting in two energy
states Nα/Nβ, with opposing spins ms = +1/2 (aligned with B0) or -1/2 (aligned against B0). For larger values of I, more states exist.
14
from the different alignment of the spin in either the same (Nα, ms = + 1/2) or opposite (Nβ, ms = - 1/2) direction as the applied magnetic field, B0, which is always situated along the z-axis, Eq. 1.7, where ℎ is Plank’s constant, and 𝛾 is the magnetogyric ratio. Each atom has a nuclear constant called the magnetogyric ratio, 𝛾, which determines the radio frequency at a given magnetic field strength needed to make the atom resonate and is based on the magnetic moment, 𝜇, and the spin number, 𝐼, Eq. 1.8.
(Eq. 1.7) ∆𝐸 = ℎ𝜈 = 𝑩0ℎ𝛾/2𝜋
(Eq. 1.8) 𝛾 = 2𝜋𝜇/ℎ𝐼
NMR spectroscopy involves basic 1-dimensional (1-D) techniques that focus on a single nuclei type such as 1H or 13C NMR. These experiments give structural and chemical environment information about the molecule of interest. In 1-D NMR, the spectrum is taken by putting the sample in a constant magnetic field, where the field strength of a magnet is given in MHz and is based on the frequency needed for a proton to resonate. For instance, a 500 MHz NMR is at about 117,500 Gauss or 11.75 Tesla. Once in the constant magnetic field aligned along the z-axis, an appropriate radio frequency is pulsed for the atom of interest along the x-axis (a common pulse is at 90°, or π/2), the pulsed frequency must be large enough to capture the entire frequency range for that nuclei. Once irradiated, the atoms in the sample are excited to the higher state, and a free induction decay (FID) is recorded as the nuclei relax back down to the ground state and release their absorbed energy. The FID can be mathematically transformed by a technique called Fourier transformation (FT), and the NMR spectrum is produced.
Deuterated solvents are very important in NMR as most instruments use the deuterium (2H) signal to stabilize the magnetic field and make it homogeneous. This is achieved by locking the B0 to the frequency of the deuterated solvent. Luckily, deuterium does not show up in the NMR spectrum. This is very important as most solvents have hydrogen atoms, thus would completely dominate the NMR spectrum due to the large intensity. The concentration of the solvent is always much greater than the analyte dissolved in the solvent; thus, deuterated solvents are extremely important to use. Inhomogeneity in the magnetic field leads to extreme signal broadenings, like that seen with ferromagnetic materials like iron or paramagnetic metals like copper. Shimming by small magnets helps to keep the magnetic field stable and homogeneous in the sample volume.
15
When the sample is pulsed by a radio frequency along the x-axis, the magnetic vector aligned along the z-axis is tipped to the y-axis by 90°. The vector then processes back to the z-axis in a relaxation mechanism and is a measure of time. The T1 is called longitudinal relaxation, which is the transfer of energy from excited nuclei to neighboring processing nuclei. When T1 is short, then the intensity of the NMR peak is related to the number of that type of nuclei. For example, in 1H NMR, the integration of the area under the peak is proportional to the number of hydrogen atoms (protons). The T2 is called transverse relaxation, which is the transfer of energy from processing nuclei to each other. This type of relaxation causes line broadening and signal loss in the NMR spectrum and is usually due to the fanning out of the effective net magnetization along the xy plane.
The NMR spectrum contains signals at very particular chemical shifts, δ (ppm), which give detail about the structure and chemical environment felt by the atom. The value ppm is determined from the frequency of the signal in Hz divided by the frequency range of the spectrometer in MHz, for example, if a 1H NMR signal is at 7 ppm on a 300 MHz instrument, the signal was at a frequency of 2100 Hz. Chemical shifts are reported as ppm, as these values do not change, given the instrument MHz value. Whereas if the chemical shift was given in Hz, the values would be different depending on the instrument used and would be difficult to compare chemical shifts across different instruments. Like infrared spectroscopy, in 1H NMR, functional groups tend to have select regions of chemical shift ppm that the peaks show up at. For example, aromatic protons are often in the range of 6 - 9 ppm (downfield), while aliphatic protons are often in the range of 0 – 4 ppm (upfield). The chemical shifts of atoms are very predictable and can be projected using software like ChemDraw but are dependent on the solvent environment. For example, a chemical shift of a proton in a molecule will be different in aqueous solutions than in organic solvents. Even partitioning effects of a molecule within a membrane, like those in reverse micelles, will exhibit differences in the chemical shift of a proton, depending on its localized chemical environment. Similarly, when a metal ion binds to a ligand, the signals of the ligand’s protons near to the bound metal will shift from the unbound state.
In addition to the chemical shift, the splitting patterns and the integration give a great deal of information about the structure and chemical environment felt by the atoms in the molecule. For instance, integration of 1H NMR peaks will give the number of protons of that type there are in the molecule and is an effect of the T1 relaxation. A summation over all the integration for all signals should give the total number
16
of hydrogen atoms in the molecule, and deviations from the expected number can indicate purity issues or contamination. The phenomenon known as spin coupling allows us to determine which protons are near each other in a molecule based on how much splitting of the peak is visible and the distance in Hz between them, known as coupling constants. Spin coupling arises from the coupling of the spin of the nuclei with other nearby bound nuclei through their bonded electrons following the Pauli principle that paired spins are antiparallel, and thus energy stable. This often only works when the coupled protons are 1 - 3 bonds away from each other, except in cases of aromaticity or conjugation, or a specific 4 bond coupling known simply as W coupling. If there are no coupled protons, a simple singlet (s) peak shows up on the NMR spectrum. If there is one coupled proton, a doublet (d) shows up on the NMR spectrum. If there are two coupled protons, a triplet (t) shows up on the NMR spectrum. Thus, the extent of splitting is equal to n + 1, where n is the number of coupled protons, and the distance between the peaks is the coupling constant, J, which does not exceed 20 Hz. The values of J are predictable and are different depending on the structure in the molecule. Many complex systems can arise, for example, such as doublets of doublets (dd) or a doublet of triplets (dt), which are due to coupled protons with different coupling constants.
Correlation NMR spectrometry is the collection of 2-D NMR techniques, which are valuable as they give information which is not otherwise obtainable using the 1-D NMR spectrum. All 2-D techniques are comprised of similar 1-D spectra, which have been plotted using a xy fashion, but often have more complex pulse sequences than the 1-D NMR. The pulse sequence in 2-D NMR techniques often involves multiple pulses and a time delay between them, or a mixing time. This allows for interaction by the coupled technique, so correlations form. Correlations are often found as cross-peaks with diagonals if the two nuclei are the same, as in 1H1H COSY (correlation spectroscopy) NMR, which gives information about which protons are next to each other in a molecular structure. Contour peaks in the 2-D spectrum are those that line up with two individual signals from the spectra of different atoms, as in 1H13C HSQC (heteronuclear single quantum coherence spectroscopy) NMR, which gives information about which protons are attached to which carbon atoms. There are many 2-D NMR techniques that can tell you different structural information, like which H atoms are bound to which C atoms, or if two C or H atoms are near in space.
17 1.5 Electron paramagnetic resonance
Electron paramagnetic resonance (EPR) is very similar to NMR, in which a magnetic field and radio wave irradiation are used to generate an energy difference that can be measured. However, this technique uses the unpaired electron in paramagnetic or radical molecules or metals like Cu(II). Just like how nuclei have spin which generates a magnetic field, an isolated unpaired electron has a charge and spin, which can also generate a magnetic field. The interaction of the unpaired electron with an externally applied magnetic field is theoretically like how NMR induces a spin state energy difference. In EPR, this is called the Zeeman effect Figure 1.10, which follows Eq. 1.9, where 𝑔𝑒 is the g-factor of an isolated electron (𝑔𝑒= 2.0023192778), and 𝛽 is the Bohr magneton. The unpaired electron has a particle spin of ½, so it has two spin states, ms = ± ½ . Since electrons are parts of nuclei and are subject to orbital momentum, the experimental g-factor always deviates from the ideal 𝑔𝑒 and are denoted as 𝑔. For experimental values of 𝑔, Eq. 1.10 is followed, where the frequency (in MHz) is a constant value, and the magnetic field (in Gauss) is determined experimentally. Unlike NMR, the radio frequency is held constant, in the GHz range, while the magnetic field is varied.
(Eq. 1.9) 𝛥𝐸 = 𝐸+1
2− 𝐸− 12 = 𝑔𝑒 𝛽 𝑩0 (Eq. 1.10) 𝑔 = ℎ 𝑣/𝛽 𝑩0
(Eq 1.11) 𝐴 = 𝑔 𝜇𝑒 ∆𝑩0/ℎ
Figure 1.10: Induced energy difference of the spin states within a magnetic field for a paramagnetic
![Figure 3.4 : The GHW + Cu(Aβ) exchanges where [GHW] 0 and [GHW] t are determined by fluorescence data and [Cu(Aβ 1-16 )] 0 = 5.47 mM and [Cu(Aβ 1-28 )] 0 = 5.40 mM](https://thumb-eu.123doks.com/thumbv2/5dokorg/5551761.144764/73.918.123.790.634.955/figure-ghw-aβ-exchanges-ghw-ghw-determined-fluorescence.webp)
![Figure 3.6: The GG W + Cu(Aβ) exchanges where [GGW] 0 and [GGW] t are determined by fluorescence data and [Cu(Aβ 1-16 )] 0 = 5.47 mM and [Cu(Aβ 1-28 )] 0 = 5.40 mM](https://thumb-eu.123doks.com/thumbv2/5dokorg/5551761.144764/74.918.131.787.128.461/figure-aβ-exchanges-ggw-ggw-determined-fluorescence-data.webp)
![Figure 4.5: The spectra shown here are the control experiments that show NTAdeCage 3- sequestered a stoichiometric amount Zn 2+ from [Zn(Zincon)] 2-](https://thumb-eu.123doks.com/thumbv2/5dokorg/5551761.144764/91.918.221.702.608.971/figure-spectra-control-experiments-ntadecage-sequestered-stoichiometric-zincon.webp)