An Empirical Study on Greenwashing and
Consumers’ Green Purchase Intention in Chinese
Electrical Appliance Market
BACHELOR DEGREE PROJECT
THESIS WITHIN: Sustainable Enterprise Development NUMBER OF CREDITS: 15
AUTHOR: Jinting Li (000107-T000)
Jie Han (990309-5223) Zhaofeng Qiu (980529-T011)
2
Bachelor Thesis in Business Administration
Title: An Empirical Study on Greenwashing and Consumers’ Green Purchase Intention in Chinese Electrical Appliance Market
Authors: Jie Han, Jinting Li and Zhaofeng Qiu. Tutor: Nadia Arshad
Date: 2021-05-24
Keywords:
Greenwashing, Green purchase behaviour, Theory of planned behaviour, Green attitude, Green perceived value
Abstract
Purpose: This study aims to inform readers whether greenwashing in the Chinese electrical appliance market impacts consumers' green purchase intention.
Methods: This study uses theory of planned behaviour as the theoretical basis to construct a structural equation model. An online questionnaire survey was conducted on 521
participants.
Results: Our analysis shows that greenwashing has indirectly positively correlated with green purchase intention; green attitude and green perceived value play an intermediary role between greenwashing and green purchase intention.
Conclusion: This study concluded that in the Chinese electrical appliance market, greenwashing has positively affected green attitudes and green perceived value, then green attitudes and green perceived value positively affected green purchase intention, and green attitudes positively affected green perceived value.
Structure: In this study, after the introduction, the model and related proprietary
definitions involved in the research are explained, and hypotheses are proposed. Next are the research methods and research results, and then the discussion of the research results. Finally, the possible directions of future research are discussed.
3
Table of Contents
1 Introduction ... 5
1.1 Green marketing and greenwashing ... 5
1.2 Green advertising in China ... 6
1.3 Purpose ... 7
1.4 Research Question ... 7
1.5 Delimitation ... 7
1.6 Definitions ... 9
2. Literature review and hypothesis development ... 10
2.1 literature review ... 10
2.1.1 greenwashing ... 10
2.1.2 Theory of planned behaviour ... 11
2.1.3 Green purchase behaviour and green purchase intention ... 12
2.1.4 Attitude and Green attitude ... 13
2.1.5 Perceived behavioural control and green perceived value ... 14
2.2 Hypothesis ... 14
2.2.1 The negative effect of greenwashing on green purchase intention ... 14
2.2.2 The negative effect of greenwashing on green attitude... 15
2.2.3 The positive effect of green attitude on green purchase intention ... 15
2.2.4 The negative effect of greenwashing on green perceived value ... 16
2.2.5 The positive effect of green perceived value on green purchase intention 16 2.2.6 The positive effect of green attitude on green perceived value ... 17
3 Methodology ... 18
3.1 Research approach ... 18
3.1.1 Proposed Model... 18
3.1.2 Hypothesis ... 20
3.2 Study design and data collection ... 20
4
3.2.2 Questionnaire design ... 21
3.2.3 Measurement scale ... 23
3.2.4 Data analysis methods ... 24
3.3 Ethical analysis ... 26
4. Empirical findings and Analysis ... 28
4.1 Descriptive statistical analysis ... 28
4.1.1 Description and analysis of basic features of samples ... 28
4.1.2 Variable description analysis ... 31
4.2 Reliability and validity analysis ... 35
4.2.1 Reliability analysis ... 35
4.2.2 Validity analysis ... 35
4.3 Difference analysis of demographic characteristics in various variables ... 36
4.3.1 Differences in gender characteristics of the sample in various variables . 36 4.3.2 Differences of sample age characteristics in various variables ... 37
4.3.3 Differences of education characteristics of the sample in various variables ... 38
4.3.4 Differences of sample income characteristics in various variables... 40
4.4 Structural equation model testing ... 41
4.5 Result ... 45 5 Conclusion ... 48 6 Discussion ... 49 6.1 Theoretical contribution ... 49 6.2 Practical significance ... 49 6.3 Limitation ... 50 6.4 Future research ... 51 Appendix ... 53 Reference ... 70
5
1. Introduction
______________________________________________________________________________________
This chapter outlines the introduction of this study. First, the states of the green market and greenwashing are introduced. Second, you will be given more information about Chinese green advertising. And then, in Secton1.3 & 1.4, the Purpose and Research question is stated. Section 1.5 tells the Delimitation of this study. And last, section 1.6 includes definitions used in this thesis that need to be explained.
______________________________________________________________________________________
1.1 Green marketing and greenwashing
Since the 1960s, the environmental protection movement has risen in the United States (Bernard, 2018). With the emergence of global warming and marine plastic garbage, and other environmental problems, people's attention to environmental protection reaches an unprecedented height (Gifford & Nilsson, 2014). In the past two decades, various environmental protection-related products have emerged, and these products are recyclable, or the production process is low-polluting to the environment. They are generally known as green products (Jereb et al., 2016).
Between 2009 and 2010, the global supply of green products increased by 73%
(TerraChoice, 2010). In 2017, the United Nations (2017) Sustainable Development Goals included "ensure sustainable consumption and production methods." Since a large part of environmental degradation is caused by personal consumption activities (Stern, 1999; Göçer & Sevil Oflaç, 2017), consumers play a vital role in encouraging a country's green innovation (Steg & Vlek, 2009). Increasing environmental concerns and pressure to engage in environmentally responsible behaviours have led many companies to regard environmental management as their main agenda to meet consumers' green purchase needs (King & Lenox, 2002).
Many companies use green marketing strategies to gain a competitive advantage to attract environmentally conscious consumers, but not all green marketing propositions can accurately reflect the environmental behaviour of companies (Szabo & Webster, 2020). Some companies have indeed reduced their environmental impact through technological innovation and other means. Still, other companies have exaggerated their environmental impact efforts or merely claim to be concerned about environmental impacts without actual operations (Garfield, 1991). This behaviour will affect the profitability of
companies in the industry and cause moral damage (Szabo & Webster, 2020). Academia defines such unethical behaviour as greenwashing (Magali & Vanessa, 2011).
6
The term “Greenwashing'' was created by Jay Westervelt, an environmentalist from New York, in 1986. Initially, it was used to describe the local hotel industry requiring guests to reuse towels to reduce the environmental damage caused by washing. Westervelt believes that the hotel is actually to reduce costs rather than focusing on green activities (Du, 2015). Some businesses see that the attractiveness of green products to consumers is reaching unprecedented heights, so they use the green attributes of their products as a publicity selling point to attract consumers (Ravindra & Pradeep, 2010). Besides, the green attributes advertised by some unscrupulous merchants do not conform to the facts of the products, exaggerating the environmental friendliness of the products and
disrupting fair competition in the market.
1.2 Green advertising in China
Although much greenwashing-related research can be found in Northern Europe and some other developed regions, related research in developing countries is still relatively scarce. The researchers cannot find existing research on greenwashing in the mainland Chinese electrical appliance market. The disclosure of greenwashing behaviour mainly relies on the annual 3.15 National Consumer Rights Day Gala. Only false propaganda (energy efficiency fraud or harsh conditions) is covered in terms of electrical appliances. For example, the green advertisement of an air-conditioning manufacturer "uses only one kilowatt per night for air-conditioning" false propaganda (CCA, 2020). But the
government has never introduced the concept of "greenwashing" to describe such behaviour.
In a study conducted by Dai, Goh, and Cheng (2014) on the reliability of 1,338 Chinese green advertisements, Greenwashing had the lowest reliability, which was 0.876.
However, the average reliability of the experimental results reached 0.963, which shows that ordinary people have a high degree of recognition for the authenticity of green advertisements in mainland China.
Based on existing research worldwide, in the past 20 years, various companies have doubled their investment in green product advertising (Magali & Vanessa, 2011). According to the results of a survey completed by TerraChoice between 2008 and 2009, more than 95% of "green products" have at least one suspected greenwashing problem (UL., 2021). The increasing greenwashing advertising has weakened consumers' confidence in green products and affected investors' confidence in the industry's long-term development (Dai et al., 2014).
There are no empirical findings on the severity of greenwashing behaviour in green advertisements in mainland China's electrical appliance market. Because of the
7
and the empirical report of false propaganda in Chinese electrical appliance markets. Greenwashing behaviour is at least present in the promotions of green appliances in mainland China.
1.3 Purpose
Our purpose is to inform readers whether greenwashing in the Chinese electrical
appliance market impacts consumers' green purchase intention. Joshi & Rahman (2016) found that for Asian economic markets, consumers' green purchase behaviour has not been studied in depth. They pointed out that compared with developed markets, Asian consumers have low green awareness. Ahmad & Zhang (2020) pointed out that green marketing activities have not been widely exposed in the Chinese market. As one of the countries with the fastest economic development, greenwashing is an inevitable challenge in the Chinese economic market. Based on the above, we have not found any previous empirical research on greenwashing in the Chinese electrical appliance market. Still, there is evidence that greenwashing does exist in the market. This research adopts TPB as the theoretical framework and makes some adaptive improvements on this basis. In the markets of developed and emerging regions, TPB has been well used in the literature, including the environmental field (e.g. Chan, 2001; Ko and Jin, 2017; Nguyen et al., 2019).
1.4 Research Question
How does greenwashing impact consumer's green purchase intention in the Chinese electrical appliance market?
1.5 Delimitation
This research chose the electrical appliance market in mainland China as our research market. This decision is mainly based on the researchers' understanding of the market, the existing power generation methods in mainland China, the long-term goals of the Chinese government, and the influence of the enormous population based on the global
environment. For details, please refer to the following:
Carbon dioxide is one of the main reasons for the formation of the greenhouse effect, and the leading cause of carbon dioxide is the use of traditional energy sources such as coal and oil (Aresta & Dibenedetto, 2021). China is developing rapidly. As many developed countries have experienced, this process is accompanied by environmental pollution. China has become the world's largest electricity producer. From 2010 to 2018, China accounted for the largest share of global power generation (19.5-26.7%). Most (70.4-82.5%) come from traditional energy sources such as coal and oil. Thermal power plants in China are the primary source of pollutants in the country. In addition to environmental
8
pollution, pollutants are also a challenge to people's health (Tang et al., 2020). Because of the limitations of geographical and climatic conditions and the considerable upfront investment, it isn't easy to find a more sustainable power generation method nationwide in the short term (Ren et al., 2021).
In mainland China, it is difficult to achieve large-scale clean energy power generation in the short term. Improving the performance of electrical appliances and improving energy efficiency might be another feasible mode to reduce pollution. The Chinese government promulgated the first version of China's energy efficiency standards on March 1, 2005, which stipulated the energy efficiency levels of various civil and commercial electrical appliances (Zhu, 2010). This standard succinctly reflects the energy efficiency level of products and has been revised several times in the past ten years based on technological innovation and market segmentation (Wang & Wang, 2020).
In the "Fourteenth Five-Year Plan for the National Economic and Social Development of the People's Republic of China and the Outline of Long-term Goals for 2035",
"Formulate an action plan for peak carbon emissions by 2030" and "Strive to achieve carbon neutrality by 2060" are regarded as core content. We can see that the Chinese government has a considerable determination to reduce environmental impact to improve the country's image (Xinhua News Agency, 2021).
In recent years, the government has also strengthened publicity and supervision in terms of consumer guidance from controlling the use of plastic products and prohibiting the manufacture of low-quality plastic products (Xing & Liu, 2018). For electrical products, because of technological innovation in recent years, the government is also actively revising new energy efficiency standards (Wang & Wang, 2020). Refrigeration accounts for 15% of China's social electricity consumption. The "New National Standard for Air-Conditioning Energy Efficiency" implemented in July 2020 provides positive guidance for the consumption of green electrical appliances, which is good for promoting green electrical products (Xinhua Net, 2020). Increasing green purchases in the electrical appliance market can reduce electricity consumption and improve energy efficiency, thereby indirectly reducing carbon emissions and reducing electricity consumption in the ecological environment.
The above information reflects the basic situation of China's current power generation and energy standards. Although the per capital annual electricity consumption in 2020 was only 3,991 kWh, it lags far behind most developed countries (CIA World Factbook, 2021). But as a large country with a population of 1.4 billion, and more than 70% of its electricity comes from traditional power generation methods, it has a significant impact on the global climate.
9
This study chooses China's electrical appliance market as the pre-established market for the analysis based on the above discussion.
1.6 Definitions
Green Product: Refers to its products in the marketing process that are more environmentally friendly than current similar products (Jereb et al., 2016).
Greenwashing: Misleading form of advertising that aims to promote the environmental protection attributes of the organization's products, goals, or policies, and mislead consumers who have environmentally conscious brands to purchase goods and services, thereby increasing the company's overall product benefits (Kahle & Gurel-Atay, 2015; Mayrand & Trottier, 2011).
Green attitude: People's attitudes towards the environment and environmental behaviour (Coşkun, 2017). A collection of beliefs, influences and intention about environmental activities (Schultz et al., 2004).
Green perceived value: Consumer's overall assessment of the net benefit of the green product(Chen & Chang, 2012).
Green purchase intention: Consumers’ willingness to buy green products.
Theory of Planned Behaviour (TPB): A behaviour decision model mainly used to predict and understand human behaviour (Ajzen, 1985).
Structural equation modelling (SEM): A statistical technique used to quantitatively study the interaction between multiple variables. Its characteristic is the integration of factor analysis and path analysis. The sample size should be at least 100 to ensure that the results are credible (Boomsma, 1987).
Likert Scale: It is a psychological response scale often used in questionnaires. And it is currently the most widely used scale in survey research. Participants specifically pointed out their degree of agreement with the statement (Wuensch, 2005).
Mesomeric effect: It means that the influence of X on Y is realized by M, which means that M is a function of X and Y is a function of M (Y-M-X). Consider the influence of the independent variable X on the dependent variable Y. If X influences the variable Y through M. M is called an intermediate variable.M plays a mesomeric effect in the relationship between X and Y (Hou et al., 2004).
10
2. Literature review and hypothesis development
______________________________________________________________________________________ In Chapter 2, greenwashing and green purchase intention would be further explained, and discuss the theoretical model applicable to the study of greenwashing and green purchase intention. First, it will introduce the theoretical basis of this study, the theory of planned behaviour and its conceptual improvement in this research. Second, this chapter will explain the four key variables (greenwashing, green purchase intention, green attitude and green perceived value) in this research and the previous study. Third, the relationship between the variables will be assumed based on the literature.
______________________________________________________________________________________
2.1 literature review
2.1.1 GreenwashingThe term "greenwashing" originated from "whitewashing", first used by American environmentalist Jay Westerveld in 1986. This is a misleading form of advertising that aims to promote the environmental attributes of the organization’s products, goals or policies. Some companies use greenwashing to mislead consumers with environmental protection concepts, causing consumers to buy their goods and services, thereby increasing their overall product revenues (Kahle & Gurel-Atay, 2015; Mayrand & Trottier, 2011). Greenwashing behaviour is a kind of "creative reputation management" in which the company conceals deviation and authenticity (Laufer, 2003).
Although greenwashing was proposed in the 1980s, its usage is still increasing. This might be due to the increasing demand for green products (Dahl, 2010). In addition, the government or regulatory agencies are not effective in formulating regulations to control this phenomenon (Sun & Zhang, 2019). These all make greenwashing more and more serious.
Nevertheless, environmental NGOs remain vigilant about greenwashing. The non-governmental organization, the environmental market agency's research results to
determine whether greenwashing in products is worth mentioning. TerraChoice (acquired by UL) developed seven sins of greenwashing in 2007 to help consumers identify
misleading products to the environment. People still use this set of standards to identify green washes (UL, 2021). Seven Sins refers to the sin of hidden trade-off, no proof, vagueness, worshipping false labels, irrelevance, lesser of two evils and fibbing (Cohen, 2014).
When facing the same type of product choices, green information will positively impact consumers' perceptions of products and brands and their purchase intention (Brouwer,
11
2016). Customer trust is subjective. When customers cannot distinguish between genuine green products, they will have negative sentiments towards similar products and resist green products. Therefore, competitors that do not use Greenwashing would face unfounded negative reviews (Manvi.., Sharma & Jain, 2019).
In this regard, critics believe that the rise of greenwashing and the government's
inefficient suppression of greenwashing have increased consumers' suspicion of all green claims. Not only that, it weakens the ability of consumers to push companies to seek more environmentally friendly solutions in the manufacturing process and business operations (Dahl, 2010; Sun & Zhang, 2019). When a company decides to take sustainable development as its vision, it must profoundly change its corporate culture. Ullmann (2008) pointed out that companies and organizations are supposed to understand and use the concept of sustainable development to promote fundamental changes in the company. And only working on convincing consumers to buy products cannot achieve truly sustainable development.
2.1.2 Theory of planned behaviour
According to the theory of planned behaviour model (TPB), Bamberg and Moer (2007) pointed out that an individual's decision-making is made by rationally assessing the consequences of his actions. The intention of the behaviour is the prerequisite for the corresponding behaviour. It refers to the cognition that the individual is ready to take action (Liu et al., 2012).
The TPB model is an effective tool for explaining and predicting various behaviours (Conner & Armitage, 1998). The model points out that attitudes, subject norms and perceived behavioural control (PBC) are the main factors that affect behaviour intention. Attitude refers to the position and perspective of an individual on a particular behaviour. Subject norms refer to the responses of essential reference groups (for example, family members and close friends) to specific behaviours and whether individuals will consider these responses when deciding to perform the behaviour. Perceived behavioural control refers to the degree of control over behaviour when a person takes a particular behaviour (Ajzen, 1991). Many scholars use these three components to predict behaviours that are beneficial to society and environmental protection. (Mo et al., 2018; Jang et al., 2014). Fig 1. Theory of planned behaviour model (Ajzen,1991)
12
Based on the influence of the main factors of TPB, compared with the other two factors (attitude and perceived behavioural control), subject norms are relatively invalid in predicting behaviour. They are not directly related to the influence of greenwashing (Armitage and Conner, 2001). According to the study of Bagozzi et al. (2000), subject norms have no direct relationship with the final behaviour decision. Some scholars assert that subject norms have no direct influence on predicting consciousness and behaviour after considering attitude and Perceived behavioural control (Bagozzi et al., 2000; Armitage & Conner, 2001; Botetzagias et al., 2015). Therefore, subjective norms are not considered as research factors in the model used in this study.
2.1.3 Green purchase behaviour and green purchase intention
Green purchase behaviour refers to the purchase of environmentally friendly green products that are usually recycled and used to benefit the environment (Mostafa, 2007). Green products refer to those considered less harmful to the ecological environment, such as organic vegetables, energy-saving appliances, etc. (Shrum et al., 1995). These products have weak negative impacts on the environment, produce little waste, and most green products can be recycled multiple times (Chen & Chai, 2010).
Compared with green products with environmental protection effects (such as recyclable products, products that can be used repeatedly, and products that can save energy, etc.), most of the production processes of traditional products tend to ignore environmental impact (Kim & Choi, 2005). In addition, Kim and Choi's research shows that green products can meet consumers' social and psychological needs to a greater extent compared with traditional products. (Kim & Choi, 2005) Unlike other consumer behaviour types, green purchase behaviour is considered a typical socially conscious behaviour that can bring personal benefits and satisfaction (Kim & Choi, 2005). Most scholars will evaluate customers' green purchase behaviour based on consumers' intention and willingness to buy green products (Joshi & Rahman, 2015). Green purchase intention is usually converted into green purchase behaviour, influencing customer behaviour for buying such environmentally sustainable products (Joshi & Rahman,
13
2015). As consumers pay more and more attention to the rise of environmental protection activities and the impact of environmental pollution, the increasing number of consumers are more willing to buy green products, which they regard as a manifestation of morality (Chen, 2010). Green purchase intention is the critical prerequisite for green purchase behaviour. This study tends to study consumers' green purchase intention rather than behaviour. The purpose of this study is to check the impact of greenwashing on green purchase intention.
Ali and Ahmad (2012) defined "green purchase intention" as the possibility and desire of consumers interested in environmental and awareness issues to choose environmentally friendly products. Chen and Chang (2012) stated that green purchase intention is the trend of buyers to purchase specific products according to environmental needs. According to Brown (2003), the actual purchase rate of consumers who intend to buy certain products will be higher than those of consumers who indicate that they do not intend to buy. The stronger the willingness to buy green products, the more the actual green purchase behaviour. Green purchase intention and behaviour benefits the entire society and future (Author et al., 2001).
2.1.4 Attitude and Green attitude
In the TPB, the attitude refers to an individual's position on a particular behaviour, which means that attitude measures consumers' judgment on whether their behaviour is
meaningful (Ajzen, 1991). Solomon (2016) pointed out that attitude is people's ongoing evaluation of the surrounding objects and environment. Wu and Chen (2014) believe that behavioural beliefs affect attitudes. Therefore, attitudes are based on the beliefs and attributes of related objects, and beliefs and attributes influence one person's behaviour through the behaviour of another person (Fishbein & Ajzen, 1977).
In addition, to fit the research purpose, the model used in this study is based on the TPB model and conceptually modified the key predictive component, attitude. This makes the model of this study focus on green products and the environment. Therefore, in the model established in this study, the critical factors used to predict green purchase intention are green attitude.
Green attitude refers to an individual's position on the environment in a specific behaviour. It is a collection of beliefs, influences and intention about environmental activities (Ajzen, 1991). Green attitude and attitude are conceptually similar, but the green attitude considers the position on the environment based on the concept of attitude. Coşkun (2017) illustrates that green attitudes are firstly attitudes towards the
environment, and secondly attitudes towards environmental behaviours. Schultz et al. (2004) define green attitudes as a collection of beliefs, influences and intention about environmental activities. On the other hand, McIntyre and Milfont (2016) define
14
environmental attitudes as assessing the natural and built environment and the factors that affect its quality.
2.1.5 Perceived behavioural control and green perceived value
In the TPB model, perceived behavioural control is defined as the perception of difficulty in implementing behaviour (Ajzen, 1991). Perceived behavioural control reveals the "perceived ease or difficulty" of specific behaviours (Ajzen, 1991). Perceived behaviour control is considered to reflect past experience and expected obstacles and consequences. According to TPB, contrary to the degree of actual behaviour control, the perception of behavioural control directly affects the intention of performing the behaviour and the actual performance of the behaviour (Ajzen, 1991).
The predictive component, perceived behavioural control, is revised as a green perceived value in this study. Green perceived value is a consumer's overall evaluation of the environmentally beneficial advantages of a product or service (Chen & Chang, 2012). Green perceived value can effectively measure the difficulty of consumers taking purchase behaviours at the environmental level. Consumers with high green perceived value are easier to implement green purchase behaviour and vice versa. Therefore, green perceived value can replace perceived behavioural control in predicting purchase
intention and behaviour and conform to the research perspective of green purchase and environmental protection.
Perceived value is the net income of a product or service based on the overall evaluation of consumers (Bolton & Drew, 1991; Patterson & Spreng, 1997). Perceived value stems from the fairness theory, which indicates that consumers consider the ratio of their outcome/input to the service provider's outcome/input (Zeithaml, 1988). In Chen and Chang's (2012) study of enhancing the awareness of green purchases, they combined the perceived value with the consumer's needs for the environment. And then, they proposed a new concept, "green perceived value". They define green perceived value as the overall assessment of consumers' net benefits of products or services. This assessment is based on consumers' expectations for the environment, sustainable gains, and given
"expectations and green demands."
2.2 Hypothesis
2.2.1 The negative effect of greenwashing on green purchase intention
In Hartmann and Ibáñez (2006) study, they indicated that consumers could be easily manipulated by businesses to make consumers think that they have become green
15
positive emotions, some consumers feel better when using green brands (Hartmann & Ibáñez, 2006).
However, greenwashing will have a negative impact on consumers' environmental awareness and behaviours. It inspires green scepticism and raises potential risks (Lin et al., 2017; Chen & Chang, 2013). According to the research of Johnstone and Tan (2015), in recent years, the growth of greenwashing has aroused more consumer dissatisfaction by raising people's suspicion (Johnstone & Tan, 2015; Self et al., 2010).
Nyilasy et al. (2014) emphasized that the company's greenwashing behaviour is an ethical issue and a negative impact on consumer perception. This has a real and harmful impact on brand attitudes and green purchase intention. Even occasionally, it is difficult for customers to identify the truth and misleading behaviour.
Based on the above discussion, this research proposes the following hypotheses: H1:Greenwashing (G) negatively affects green purchase intention (I)
2.2.2 The negative effect of greenwashing on green attitude
Heras-Saizarbitoria et al. (2020) analyzed certifiable environmental management standards (such as ISO14001) and found that less than half of the indicators show that they positively affect the environment. These findings have raised doubts about the general belief that environmental management standards can regulate market behaviour and positively impact the environment.
Ineffective regulation and the intensified greenwashing phenomenon has increased consumers' suspicion of green products and shaken their attitude and confidence in green products (Sergio et al., 2019). Although it implies that greenwashing may have a negative effect on green attitude, Sergio et al.'s research did not prove that there is a direct
relationship between greenwashing and green attitude.
Chen and Change (2013) stated that some companies choose to embark on the path of greenwashing and develop new sustainable consumption solutions through greenwashing because, for them, fundamental changes in environmental attitudes are usually costly and troublesome to implement.
Based on the above literature content, this research puts forward the following hypotheses:
H2:Greenwashing (G) negatively affects green attitudes (A)
16
Attitude is considered the main factor affecting consumers' green buying behaviour (Dhir et al., 2021; Zhang & Dong, 2020). However, Englis and Phillips (2013) illustrate a disconnect between consumer attitudes and green behaviours because consumers' concerns about the environment cannot easily be transformed into green products. Under the theoretical model (TPB) in this study, attitude is an important factor predicting people's intention(Ajzen, 1991). Scholars actively discuss the influence of green
attitudes on green purchase intention.
Based on the above literature content, this research puts forward the following hypotheses:
H3: Green attitude (A) positively affects green purchase intention (I) 2.2.4 The negative effect of greenwashing on green perceived value
Moliner et al. (2007) proposed that one way to increase consumers' perceived value is to highlight the unique sales propositions of green products and weigh the benefits and costs associated with such products. Consumers who perceive the minimum compromise will favour the product better (Moliner et al., 2007).
However, greenwashing is described as a company's practice of offending or
exaggerating sustainability claims to gain market share (Dahl, 2010). The possibility of greenwashing happening is high when the information is not equal between the company and the consumer. This leads to consumers becoming increasingly confused and
unwilling to buy products when they face many marketing strategies and green propositions used in advertising (Khandelwal, Sharma & Ain, 2019).
According to the above discussion, this study puts forward the following hypotheses: H4: Greenwashing (G) negatively affects green perceived value (P)
2.2.5 The positive effect of green perceived value on green purchase intention
Some literature shows that the perceived value is positively correlated with consumers' purchase intention (Gounaris et al., 2007). If consumers believe that the product's value is higher, then they are more likely to buy the product (Chang and Chen, 2008). Conversely, the low perceived value of consumers will lead to lower consumer willingness to accept (Sweeney & Soutar, 1999).
Zeithaml (1988) pointed out that perceived value is one of the most critical factors affecting purchase intention. Companies can use product value to enhance consumers' willingness to buy (Steenkamp & Geyskens, 2006).
17
Perceived value as a set of attributes related to product value perception can establish positive effects and word-of-mouth to increase purchase intention (Sweeney et al., 1999; Ashton et al., 2010). Consumers' judgments on purchase behaviour are usually based on incomplete information, so the product's perceived value as a product signal will
positively impact their purchase intention (Kardes et al., 2004).
According to the above literature contents, this study puts forward the following hypotheses:
H5: Green perceived value (P) positively affects green purchase intention (I) 2.2.6 The positive effect of green attitude on green perceived value
Lee and Hwang (2011) deem that consumers’ positive attitude towards products can be regarded as a lever for the success of companies working in this field. Because if consumers’ positive attitude towards products makes them perceive and believe in the value of products, economic and social profits of the company in this regard is
guaranteed.
In the context of marketing management, this study hypothesizes that the green attitude of customers positively affects their green perceived value and proposes the following hypothesis:
18
3. Methodology
______________________________________________________________________________________
This chapter outlines the research methodology adopted in this study. Section 3.1 includes a research approach. The design of research and data collection is outlined in Section 3.2. Section 3.3 includes Ethical issues.
______________________________________________________________________________________
3.1 Research approach
The impact of greenwashing on consumer behaviour is a social issue. For the study of social issues, a factual basis is indispensable, and positivism is the theoretical basis of our research. This study use quantitative analysis methods to conduct research. The reason for choosing quantitative research is that we need a lot of data as the basis for research. Quantitative research is strictly logical, and the results supported by data are accurate and scientific. Moreover, quantitative methods can improve the standardization of results through statistical survey results (Muijs, 2010).
This article uses the theory of planned behaviour as the research theory to better show the relationship between the research results. The theory of planned behaviour (TPB) is widely used to explore moral-related behaviours and is currently one of the most used rational decision models (Chang, 1998; Ramayah et al., 2012). The TPB stipulates and researches relevant factors of the subject to explain the behaviour or the result of the specific problem. It allows researchers to speculate on other relevant variables and study the extent to which these variables affect particular behaviours or outcomes (Ajzen, 1991).
Moreover, this study uses the Structural Equation Modeling hypothetical model to meet the results of this research. Structural Equation Modeling (SEM) is a quantitative research technique that can incorporate qualitative methods. SEM is used to show the causal relationships between variables. The relationships shown in SEM represent the hypotheses of the researchers (Devault, 2018).
3.1.1 Proposed Model
This study summarizes the contents of the literature review as a new framework for the impact of greenwashing on green purchase intention. This study hopes to extend the research on greenwashing and green purchase intention to a new framework. In addition, this study will conduct further empirical test to verify the relationship between
greenwashing, green attitude, green perceived value and green purchase intention. In the second chapter, relevant literature review of the four variables in the research model was
19
discussed, and six hypotheses on the relationship between the variables were put forward based on the previous research content and literature, and the structure of this study was presented. The relationships between variables and the hypotheses are shown in Figure 2. Figure.2 Theoretical framework
In the model, different patterns in the diagram have different meanings. SEM can be divided into two parts, measurement model and structural model. The structural model represents the relationship between Latent variables, which is composed of latent variables, while the observed model represents the relationship between latent variables and observed variables, which is composed of a single latent variable, its observed
variable and error. The observed variables have different names, such as the measurement variable, the explicit variable, the explicit indicator) but they all have the same meaning, somewhat explaining the latent variable. Because the observed variable explains to some extent the latent variable, that means there is something else that cannot be explained, and that is called the error. In the model, ellipses represent variables that cannot be directly measured, such as latent variables and error, and rectangles represent observed variables. The starting point of the arrow represents the independent variable, and the endpoint of the arrow represents the dependent variable. In the measurement model, the latent variable is the independent variable, and the observed variable is the dependent variable, which is unchangeable (Blunch, 2013).
20
3.1.2 Hypothesis
Based on the above literature review, reseachers discuss whether there is a relationship between the two main variables of greenwashing and green purchase intention. Whether the two intermediate variables of greenwashing attitude and green perceived value affect the main variable. Based on this, the following hypotheses are put forward:
H1: Greenwashing negatively affects green purchase intention H2: Greenwashing negatively affects green attitudes
H3: Green attitude positively affects green purchase intention H4: Greenwashing negatively affects green perceived value
H5: Green perceived value positively affects green purchase intention H6: Green attitude positively affects green perceived value
3.2 Study design and data collection
3.2.1 Data collection and sample description Sampling numberThis study adopts the structural equation modelling research method, which indicates that a sample size of at least 200 is required (Wolf, Harrington, Clark & Miller, 2013). In order to make the data finally obtained researchable, the research needs a research data set of at least medium volume. Generally, scholars believe that a sample size between 200 and 500 is appropriate. Scholars put forward the multivariate normal distribution as the criterion to judge the sample size. They believe that if the total population is subject
21
to the multivariate normal distribution. The sample size only needs to be 5 times of the scale items (if there are 15 items in the scale, the sample size is 75); if not, the sample size should be 10 to 15 times, and no less than 200 (Iarossi, 2006).
It can be seen that most scholars agree with the sample size above 200. If there are many items, the sample size can be determined by a ratio of 10 to 15 times. Generally, the larger the sample size, the more accurate the data analysis will be; otherwise, the data's reliability will be questioned (Kalton, 1983).
Sampling method
This study adopts the simple random sampling method, and no specific population is set as the research object. The cognitive complexity of consumers makes it impossible to determine the cognitive status of a fixed consumer group, and everyone is a potential consumer (Malhotra, Jain, Patil, Pinson & Wu, 2010). In addition, due to the Covid-19, it is not possible to centralize data collection for an organization such as a school/company. Combined with these two reasons, the researchers decided to use simple random sampling to conduct the study and obtain relevant data. The researchers want the respondents to have consumption capability, so they set different ages and annual income levels in the questionnaire as indicators to measure the consumption capability of the respondents. The first part of the article explains the reason why the research chooses the electrical appliance market as the topic of discussion, and it will not be described here.
Data collection method
Given the public concern about covid-19, researchers believe that traditional face-to-face interviews are inappropriate and difficult to implement. Therefore, this research plans to obtain relevant data through an online questionnaire survey to study "how greenwashing affects consumers' green shopping behaviour". The questionnaire is completed on a dedicated questionnaire platform, "Wen Juan Xing". A link and QR code belonging to the research questionnaire will be generated through this website, and the link and QR code will be distributed to social platforms such as WeChat, Sina and QQ. It is planned that the questionnaire will be distributed in one week.
3.2.2 Questionnaire design
Before designing the questionnaire, the researchers studied the literature of different countries, combined with the previous research results, analyzed the specific situation according to the research needs, developed the measurement scale and completed the initial questionnaire design. In order to make the questionnaire accurate and complete, the researchers conducted two pre-teat and received 52 and 48 responses, respectively. All of them meet the minimum quantity of 30 in pre-tests (Perneger, Courvoisier, Hudelson &
22
Gayet-Ageron, 2015). For the first pre-test, researchers referenced the scale in the article of Braga Junior, Martínez, Correa et al.(2019), and based on this, combined with the subjective ideas of researchers, finally formulated 24 questions. The scale used in this study is not the same as that used in the reference literature. In order to ensure the reliability and validity of the questionnaire, the researchers conducted reliability and validity analysis on the improved scale again. The results of validity analysis showed that the factor distribution was different from the researchers' initial dimensionalization of the questions, so the researchers decided to recreate the scale.
For the second test, the researchers read a large amount of literature and found thesis of Chen and Chang (2012), Matthew, Yongdan and Ziying (2020) etc. These articles were highly relevant to the research topic. The researchers screened the scales in line with the research topic and applied them to the questionnaire survey. The researchers chose college students for the second pre-test. Fifty-two valid samples were obtained. SPSS software was used to test the reliability and validity of the questionnaire, and the factor load number of the item was obtained. The relationship between the factors obtained from the item and the pre-set question dimension was compared, and the items with serious deviation in the corresponding relationship with the factors were deleted to increase the possibility of successful model fitting in the later period. After analysis, all the questions were found to have reliability and validity; 22 questions were reserved for a formal investigation. This questionnaire is divided into five parts. The first part is the preface of the questionnaire and the respondents' personal information, such as the age, gender, education level, and other basic information of the respondents, which is used as the basis of grouping. The second part is the survey of consumers' green attitude towards green products. The third part is the measurement of consumers' green perceived value. The fourth part is divided into consumer green purchase intention measurement. The fifth part is to measure the recognition ability of consumers to the manifestation of greenwashing.
In addition to the personal information part, the Likert scale (1932) was adopted as the main design method of answer options in the questionnaire to test respondents' degree of agreement to the statement. The measure of each variable (item) is presented in the form of a matrix scale. The scale is composed of declarative sentences. The statement of each question has five answers, "strongly disagree, disagree, neutral (not necessarily), agree, strongly agree", which are recorded as 1, 2, 3, 4, 5 points, respectively. The total score of each interviewee's attitude is the sum of their answers to each question. The total score can indicate the strength of the respondents' attitude or the status of the questionnaire on the scale (Croasmun & Ostrom, 2011). The questionnaire is designed on the basis of a literature review to ensure the rationality of the questions and the credibility of the questionnaire results. Secondary data used in the research includes, but is not limited to, published journals, research papers, and books.
23
3.2.3 Measurement scale
Based on the previous literature review and the feedback from the preliminary surveyors, the questionnaire survey of this study asks the netizen to choose their attitude towards green products, their perceived value towards green products, their purchase intentions towards green products, and their ability to identify greenwashing. Each variable is described below, in Table 1. The measurement table and Fig 4. Indicators and Errors in SEM
1) Green Attitude (A)
Green attitude refers to people's attitude towards the environment and environmental behaviour (Coşkun, 2017). Relying on literature (Braga Junior et al., 2019), the researchers developed five items to measure respondents' attitude towards green. 2) Green perception value (P)
Perceived value refers to the needs of consumers for green and sustainability (Chen & Chang, 2012). The researchers selected five items to measure perceived value. 3) Green Purchase Intention (I)
Seven items measured green purchase intentions. The scale comes from the study of Matthew, Yongdan & Ziying (2020).
4) Greenwashing (G)
Researchers used scales in the existing literature to measure consumers' ability to recognize greenwashing (Akturan, 2018). The scale contains five items: You can
24
recognize that the product is literally misleading about its environmental characteristics. You can identify Products with "green labels" or images that mislead the nature of their environment, etc.
It has been clearly pointed out in the above literature that the reliability and validity indexes of the corresponding scales are qualified. Therefore, exploratory factor analysis was omitted in data analysis, and confirmatory factor analysis was conducted directly on data.
3.2.4 Data analysis methods
According to the purpose of the study and the need to test the hypothesis, this study used SPSS26.0 analysis software to analyze the survey data and used AMOS27.0 to draw the path model. The main analytical methods are as follows:
(1) Reliability analysis
Reliability refers to the consistency of test results. Reliability analysis is used to measure whether the answers of the questionnaire samples are reliable and whether the
respondents really answer. The higher the test reliability value is, the more reliable the result is. Reliability is a necessary condition for any measurement. It is necessary to analyze the reliability and validity of a questionnaire before it is formally launched to ensure the authenticity and reliability of the questionnaire survey results (Roberts, Priest & Traynor, 2006).
Reliability can be mainly divided into split-half reliability, cronbach α coefficient, alternative-form reliability, and test-retest reliability. Cronbach α coefficient is the most common reliability measurement method. This study will use this method to test the reliability of a distraction questionnaire. This method is used to test the internal consistency between questions, that is, to test whether multiple questions measure the same concept. According to Cronbach evaluation criteria for α coefficient, the reliability coefficient α value is above 0.80, indicating that the questionnaire reliability is very good. A reliability value between 0.70 and 0.80 indicates that the reliability of the questionnaire is acceptable. A reliability value between 0.60 and 0.70 indicates that the questionnaire is basically acceptable. A reliability value less than 0.60 indicates that the questionnaire needs to be revised (Schweizer, 2011).
(2) Validity analysis
Validity is used to measure whether the question is reasonable. Validity analysis only analyzes the scale data and does not carry out analysis on non-scale items. Validity analysis can be divided into three categories: content validity, criterion relevance validity
25
and construct validity. Constructional validity measurement tools can measure the degree of conceptual or theoretical traits, i.e., actual test values can indicate traits (Golafshani, 2003). The common method used to test construction validity is factor analysis, which refers to converting multiple related variables that require complex interpretation into a small number of mutually independent factors. Factor analysis includes exploratory factor analysis (EFA) and confirmatory factor analysis (CFA). Exploratory factor analysis refers to the inductive factor structure among variables, that is, the dimension status of the topic is. Confirmatory factor analysis refers to whether the factor structure of each variable is consistent with the hypothesis (Williams, Onsman & Brown, 2010). Two approaches were adopted in this study. At the beginning of the questionnaire (pre-test), the researchers used exploratory factor analysis to test the set questions. After confirming that the reliability and validity of the questions are reliable and valid, the researchers used confirmatory factor analysis to test the factor structure obtained by the measurement and the degree of consistency of the hypothesis.
(3) Analysis of Variance
Analysis of variance (ANOVA) is a method to analyze whether there are differences between groups of data after classifying the obtained data according to certain items. In order to confirm the personal characteristics of consumers, whether there is a difference in the variables is studied. In this study, an independent sample t-test was adopted to analyze the gender characteristics of consumers. Demographic characteristics other than gender, the study used one-way analysis of variance to study education, income and age, such as two or more options (Weiss, 2006; Gholamrez, 2016). One-way analysis of variance was conducted by British statistician R. A. Fisher proposed, one-way analysis of variance is also known as the F test (Stigler, 2008). According to the survey, the 95% confidence interval is usually selected for research. Therefore, in the statistical analysis of this data, researchers will use the same confidence interval as the standard to measure whether the data is significant.
(4) Structural equation model testing
Structural equation modelling (SEM) is a multivariate data analysis method, which can be used to study the influence relationship between multiple latent variables (Hou et al., 2004). Since the hypothesis established in this study is not convenient for direct
observation, it is necessary to introduce latent variables. In this study, the establishment and testing methods of the model are mainly divided into the following five steps:
First, establish latent variables by consulting previous research data, and propose possible relationships between latent variables (propose hypotheses). Then, use the form of a questionnaire to collect data from the interviewees. After completing the data collection,
26
analyze the collected data with SPSS and AMOS. And then by analyzing whether Goodness-of-fit indices meet the standard to judge whether the model fits well. Finally, through the analysis of the path coefficient and the degree of significance, it is judged whether the hypothesis proposed in this study is supported.
In this study, the above four data analysis methods will be used to process the data obtained through the questionnaire survey to determine whether the hypotheses proposed are valid or not. At the same time, the research results will be plotted into appropriate graphs to improve the readability and intuition of the report. Due to software limitations in drawing the graph, the numbers in the graph appear as integers.
3.3 Ethical analysis
Based on the effective analysis method of ethical analysis proposed by Stutchbury and Fox (2009), the Ethical Analysis of this thesis is mainly analyzed through the macro and micro levels. From a macro level, it mainly discusses whether the collected data can guarantee the validity of the conclusions. From the micro-level, it mainly discusses the privacy protection of the interviewees when collecting the results of the questionnaire and the possible moral hazards in the process of questionnaire setting and data collection. Macro level-the validity of data and conclusions
The data collection method of this study was an anonymous questionnaire, and a total of 521 valid samples were collected (a total of 8 invalid samples that were not answered were deleted). The questionnaire passed the reliability and validity test. In the reliability test, the Cronbach's α coefficient of each factor is used to judge the consistency, stability and reliability of the test results. In the validity test, the KMO value is used to determine the degree of agreement between the measurement result and the content to be
investigated. For more detailed result analysis, please refer to the relevant part of the analysis and Table 5 in the appendix.
Micro level-protection and respect for participants
When collecting data, we adopted the form of anonymous online questionnaires and adhered to the principle of voluntariness—that is, voluntarily becoming an interviewee to show respect for the interviewee. Since the sampling method used in the study is random sampling, it is not necessary to obtain the characteristics that distinguish each
interviewee. Therefore, the questionnaire is carried out in an anonymous form, and at the same time, we hope that more people are willing to become our interviewees in order to increase the total amount of data collected. In addition, Chan, Myron and Crawshaw (2005) research shows that, in addition to easier access to more interviewees, compared to anonymous questionnaires, anonymous questionnaires help get more true answers.
27
For the collected data, by checking the IP address information in the background, the researchers in this study can know the ambiguous location of the interviewee (accurate to the country or province). The acquisition of IP address information occurs before the respondent agrees to start the questionnaire, and the respondent has the right to choose not to provide IP address information.
At the beginning of the questionnaire, questions related to the basic characteristics of the population will be collected, such as the age, gender, education and income of the respondent. In order to ensure that the interviewees have the right to decide whether to provide these private data, these questions are set to be optional to protect the basic rights and interests of the interviewees. In addition, the interviewee was also told that the characteristics data collected was only used for this research in the preface. Micro level-problem effectiveness and data security
Since the questions involved in the questionnaire of this research are professional, the interviewees need to have an understanding of vocabulary such as greenwashing and green products to ensure a correct understanding of the questions. In the foreword of the questionnaire, the definitions of these words are explained as plainly as possible. Before the formal questionnaire launch, we conducted two trial questionnaires with sample sizes of 52 and 48 in advance and passed reliability tests to ensure the consistency, validity and stability of the data collected (Tobias & Trindade, 2012).
According to the ethical grid proposed by Atkinson (1989), the researchers try their best to adopt ethical behaviours. The data collected by the questionnaire is only used in this research, and the security of the data is guaranteed to the interviewees, and the potential impact is informed in the foreword of the questionnaire. In addition, the researchers in this study have the only access rights to the original data, and the transparency of the questionnaire results is reflected in this thesis. The questionnaire results of all participants will be archived after analysis to ensure that private information will not be disclosed.
28
4. Empirical findings and Analysis
______________________________________________________________________________________
Chapter 4 includes the results of the questionnaire and the data analysis. It has five parts: 4.1 Descriptive Statistical Analysis. 4.2 Reliability and validity analysis. 4.3 Difference analysis of demographic characteristics in various variables. 4.4 Structural equation model testing. And the last 4.5 Result.
______________________________________________________________________________________
4.1 Descriptive statistical analysis
This questionnaire was released on various social platforms, and a total of 529
questionnaires were sent out, and 521 valid questionnaires were received—the evaluation criteria of an effective questionnaire: whether all the questions were answered. The questionnaire is invalid if all the questions are not answered completely. The effective recovery was 98.48%. Table 2. Demographic characteristics of respondents.
4.1.1 Description and analysis of basic features of samples
Distribution of sample consumers' personal characteristic information. In the questionnaire, the basic data information is the consumer's personal characteristic information, which mainly includes the gender, age, educational background and annual income of the respondents. The specific distribution and analysis are as follows:
(1) Gender
In this survey, the proportion of males is 36%, and the proportion of females is 64%. This is far from the actual situation of the male and female population ratio in China at present (Ning, 2021). However, it should be considered that the object of this survey is the green consumption behaviour of the electrical appliance market. In China, the proportion of women who pay attention to the consumption of non-large-scale products, such as daily necessities, is much higher than that of men. Therefore, the ratio of men to women in this sample is more consistent with the actual situation of the study.
29
(2) Age
Environmental awareness is a hot topic in recent years (De Canio, Martinelli & Endrighi, 2021). Young people have more channels and opportunities to learn environmental information than older adults, which is in line with the age structure of Chinese netizens (CNNIC, 2021). The main audience of green consumption subject of this study is 18-35 years old, and the people in this age group account for 59% of the total sample, which is in line with the actual situation of this study.
Fig 6. Age distribution
(3) Education level
The education of the sample ranged from high school or below 87 people (17%) to PhD or above five people (1%), 295 people with undergraduate (56%), 45 people with postgraduate, the rest of the respondents were 89 people with junior college. According to this situation, most sample visitors have received better education and can identify and accept new things. Their views or opinions are of the reference value.
30
Fig 7. Education level
(4) Income
The objects of this survey have the plan to buy products with green properties. The people who are willing to buy are mainly those with an income of 50k-150k and those without income, which account for 63% of the total sample. Some people in each income group have plans to buy green products, so the income of the sample set in this study takes into account the purchase intention of each income group.
Fig 8. Income distribution
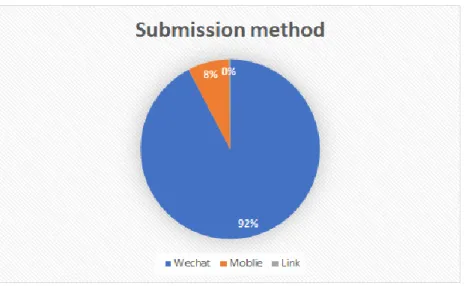
(5) Sample source channels and geographical location analysis Source channel analysis
Samples were released on social platforms, and the main channels were: WeChat, mobile scanning QR, and links. More than 92% of the respondents submitted the questionnaire through WeChat.
31
Fig 9. Submission method
Geographic location analysis
The interviewees are Chinese people from various regions and countries. The samples are mainly from 29 regions and cities in China, with respondents from Chongqing and
Shanghai accounting for 71% of the total sample size. And eight countries other than China, such as Sweden, Canada and Austria, accounting for 4% of the total sample size.
Fig 10. Location
32
The questionnaire contained 22 questions out of a maximum score of 110, and the average score for the reliable receipt questionnaire was 95.87. Table 3.
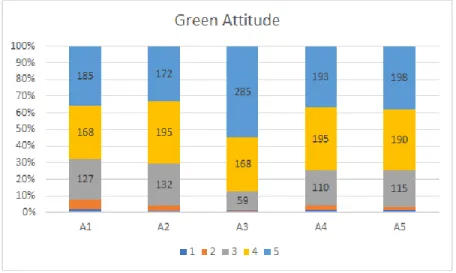
1) In the green attitude part, more than 63% of the respondents have a positive green attitude, while less than 10% have a negative attitude. The average score of the five items measuring green attitude is above 3.9, indicating that respondents have a good attitude towards environmental protection and green shopping behaviour. When making a purchase decision, 72% of respondents tended to choose green products over generic ones.
Fig 11. Descriptive Analysis of Green Attitudes
The five items, a score of 1 strongly disagreeing to 5 strongly agreed, was evenly divided between men and women. Taking the question "Do you think environmental protection is an important factor to consider when choosing products" as an example, 12 male (7% of the total male) and 11 female (3% of the total female) are dissatisfied with this question (including strongly disagree). From the measurement results, it is found that the number of people who agree with the green attitude is evenly distributed in both men and women, and no one party has a more positive green attitude than the other party. The results showed that the majority of respondents held neutral and positive attitudes towards green, and the green attitude was not affected by gender.
33
2) In the part of green perceived value, the average score of the matrix scale is 3.84. Most respondents have green perceived value. Sixty-one per cent of respondents believed that green products provided good value for them. A small number said they did not receive good value. 66% of respondents bought green products because of their green properties, such as energy saving. When asked if the environment around them has improved as a result of the government's environmental protection laws, such as green product
standards and plastic restrictions, 98% per cent of respondents said yes. According to the survey results, the green perceived value of respondents is mainly reflected in the green attribute of products.
34
3) The part of green purchase intention, the survey results show that the average score of the measurement matrix is 4.19. 98% of the respondents expect to buy environmentally friendly or sustainable products. Only 12 respondents were unwilling to buy such products. 84% of respondents made it clear that they expect to see a clearly labelled product disposed of after use. They would be willing to buy such a product. It is worth noting that 95% of respondents are concerned about whether the production of the product causes biological damage when shopping. Asked about their future consumer behaviour, whether they will increase the consumption of green products for themselves or their families, 98% of the respondents indicated that they would like to buy green products in the future. The data shows that people have a high willingness to buy green products about the green consumption intention part.
Fig 14. Descriptive Analysis of Green Purchase Intention
4) In the part of greenwashing, the respondents' understanding and recognition ability of greenwashing was measured. The average value of the matrix scale was 3.32. The data showed that more than 32% of respondents held a neutral attitude towards greenwashing that could identify products. Compared with the previous green attitude and perceived value, respondents' understanding of greenwashing appears weak. When asked if they could identify products that exaggerate their green features, 21% of respondents said they could not identify such greenwashing. Less than half (40%) of respondents said they could identify products that made false green claims about their environmental
characteristics. The results show that the respondents' ability to identify greenwashing is not high. They are uncertain in judging whether the products have greenwashing
performance.
35
4.2 Reliability and validity analysis
The reliability and validity values of the scale designed for the study directly affect the credibility and validity of the research data. Only when the reliability and validity of the scale meet the standards can the results of the analysis be meaningful. Therefore, it is necessary to test the reliability and validity of the set scale before structural equation model analysis (Hair et al., 2010). In this study, SPSS statistical software was used for reliability and validity analysis.
4.2.1 Reliability analysis
The purpose of reliability analysis is to test whether the questionnaire is reliable. Cronbach's α, internal consistency coefficient α was used in this study. The overall reliability of the scale is shown in Table 4, and the reliability and validity analysis results of each variable are shown in Table 5. It can be seen from Table 4 and Table 5 that the overall α coefficient of green purchase intention and the α coefficient of each item are all greater than the critical value of 0.6 (Babozzi and Yi, 1988), which comprehensively indicates the high quality of data reliability and can be used for further research. 4.2.2 Validity analysis
In this study, 22 items were designed to measure green purchase intention, and SPSS statistical software was used for factor analysis. Table 5 refers to the validity analysis results of the scale, and Table 6 refers to the Kaiser Meyer Olkin (KMO) value of green purchase intention and Bartlett's test results. The KMO value of about 0.5 indicates that the data is of research value (Nischay & Garima, 2013).
The purpose of confirmatory factor analysis is to verify validity. The structural equation model includes a measurement model and a structural model. To ensure that the structural equation model has a good fit degree, the researchers decided to use confirmatory factor analysis to analyze the convergent and discriminant validity of the questionnaires.In this study, the AVE index was used to evaluate the convergent validity of the scale (Fornell and Larcker, 1981). Table 7 shows the AVE and CR index results of the scale. Table 8 shows the correlation between Person and the square root of AVE.
Convergent validity
A total of 4 factors and 22 analysis items were analyzed by Confirmatory Factor Analysis (CFA). As shown in Table 7, all the AVE values corresponding to the four factors are greater than 0.6. All the CR values are higher than 0.8, indicating that the analyzed data have good aggregation (convergence) validity (Hou et al., 2004).