Modelling and Simulation of Biomass Conversion Processes
Erik Dahlquist, Guilnaz Mirmoshtaghi, Eva K. Larsson, Eva Thorin, Jinyue Yan
School of sustainable development of society and technology Malardalen University
Västerås, Sweden erik.dahlquist@mdh.se
Klas Engvall, Truls Liliedahl
Chemical TechnologyDepartment of Chemical Engineering and Technology KTH Royal Institute of Technology
SE-100 44 Stockholm, Sweden kengvall@kth.se
Changqing Dong, Xiaoying Hu, Qiang Lu
School of energy & power engineering, North China Electric Power University, Beijing, 102206, China cqdong1@163.com
Abstract – By utilizing biomass gasification, the energy content
of the biomass can be utilized to produce gas to be used for cogeneration of heat and power as well as other energy carriers such as fuels for vehicles. The concept is suitable for application to existing CHP plants as well as for utilizing spent liqour in small scale pulp and paper mills. The introduction would enable flexible energy utilization, use of problematic fuels as well as protects the environment by e.g. avoiding the release of toxic substances. In this paper, the possibilities to develop this concept is discussed. In this paper we compare different gasification processes with respect to what gas quality we get, and how the gasification can be modelled using different modelling approaches, and how these can be combined. Results from simulations are compared to experimental results from pilot plant operations in different scales and with different processes like CFB and BFB Technologies, athmospheric and pressurized, and using steam, air and oxygen as oxidizing media.
Keywords - biomass, gasification, modelling, simulation, CHP, agricultural residue
I. INTRODUCTION
The expected needs from society of heat, power and energy in form of environmental friendly e.g. motor fuels, demands a more flexible utilization of energy resources, ensuing also more multifaceted energy process systems. The traditional technology for utilizing different energy resources, such as biomass, coal and waste, is combustion. However, conversion using combustion limits the production capacity only to heat and power. Moreover, in Scandinavia, where systems for combined heat and power (CHP) production and district heating is well established, the heat demands in the society is decreasing approximately 2 % per year [1], mainly due to improving insulation in buildings. Since existing CHP plants are optimised for CHP production
and due the large resources invested in existing CHP infrastructure there is a need for a complementary technology, which can be combined with existing systems. An attractive technology to meet these demands is gasification, allowing for co-generation of CHP and other chemical energy carriers by either combustion of the product gas or by upgrading to a synthesis gas. By gasification at at relatively low temperature, a lot of methane is produced. If the methane could be separated from the product gas, this can be used for production of gaseous fuel for vehicles and other applications, such as a substitute for natural gas, i.e. bio-based substitute for natural gas (SNG). The residual gas can still be used as a fuel for the CHP plant, aside of other fuels. Introduction of gasification technology also allows for using more problematic feed-stocks, such as waste and agricultural residues. This since it is possible to include the gas cleaning of the product gas needed before the combustion in the boiler and thus reduce the risks for high temperature corrosion, caused by problematic components such as alkali salts.
Another area of particular industrial and environmental interest, applying gasification technology, is for instance gasification of waste liquor from pulp and paper mills. Globally, many smaller mills, in e.g. India, China and Pakistan, have almost no effluent treatment. By implementing gasification technology, as proposed by Dahlquist et al [2], it would be possible not only to recover the energy content in the liquor, improving the energy efficiency of the mill, but also enabling recycling of chemicals used, reducing pollution of rivers and lakes.
To be able to utilize all possibilities using gasification in combination with e.g. CHP production as well as with pulp and paper mills there is a need for R&D on both process technologies as well as on integration of technologies on a system level. A feasible approach to address the integration
of process technologies in a system as well to enhance the understanding of complex unit operation is modeling and simulation, combined with pilot plant testing. This approach saves time and money, since it reduces the need for expensive and complicated large-scale experiments.
Modeling and simulation, combined with experiments, has been used in many other studies. Nikoo and Mahinpey [3] used ASPEN plus for simulation of biomass gasification in fluidized bed reactors. A semi-empirical model for pressurized air-blown fluidized bed gasification of biomass was developed by Hannula and Kurkela [4]. Schuster et al [5], made a parametric modeling study of biomass steam gasification. An excellent review of modeling of biomass gasification in fluidized bed is compiled by Gómez-Barea and Leckner [6]. These studies together with other modeling attempts for different gasifier reactors, such as updraft [7] and circulating fluidized bed (CFB) [8], steam-air fluidized bed gasification [9] and high temperature air-steam gasification [10], form the basis for the understanding of gasification. An overall process understanding of upgrading of the raw gas and waste gasification was gained from Engvall et al [11] and Nemanova et al [12], respectively
In the present paper, the method of using a combination of physical modeling and statistical modeling and data from pilot plants tests is described. The modeling results are validated using experimental results from gasification in circulating fluidized bed gasifiers using waste and different biomasses [13] and black liquor [2]. Finally, results from an investigation of the impact of different process parameters on the gas composition by equilibrium calculations are presented and the concept of combining biomass gasification with CHP is discussed.
The work has been carried out within a national biomass gasification program (SFC) initiated during 2011 in Sweden, as well as the Program of Introducing Talents of Discipline to University (“111” Program) Supported by Ministry of Education of China in China.
II. METHOD APPROACH A. Simulation system
In the present study, a combination of different type of simulation tools has been used. For operational aspects, a combination of physical models, including energy and mass balances, and statistical models, like partial least square (PLS) models, provided with the gas composition under different operating conditions. Real process aspects like kinetics and the difference in product gas quality as a function of temperature, load and relative oxidation during the gasification was included.
Direct system design was addressed using equilibrium calculations with programs like ASPEN plus. In principle, different conditions can be calculated by changing different variables, although no information of the direct absolute gas composition can be obtained.
Experimental data from operation of pilot plants and real processes using different fuels and operation conditions [2,
13], is used in both the statistical models mentioned above and for parameter adjustments in the ASPEN plus modelling. The modelling can also be used for development of a model tool for on-line control and optimization of future gasification processes. In the figure 1 below we see the procedure we recommend and have used for black liquor gasification process development (Results seen in Table I). The modelling approach combining pilot plant experiments using experimental design, equilibrium calculations in ASPEN plus, making PLS regression models for gas composition and adding these into the dynamic simulator with differential-algebraic equations to get dynamics and heat and energy balances for the complete system (using e.g. Modellica).
B. Gasifier
The equations used in the physical simulation model of the gasifier are primarily stoichiometric calculations of how the biomass is converted through partial combustion. This will calculate adiabatic temperature and cooling through heat transfer and through transport of material from the gasifier and the heat exchangers in the exhaust gas train. The mass in the bed inventory by time is given from:
minventory / t = mi,in - mi,out (1)
where mi,in is the mass input flow of each single component of the composition vector i= (C, H, O, N, CO2, H2O, NO2,
ash) and mi,out is the corresponding output flow. The change
in concentration of each component is given by ci in the bed inventory:
i j in i k out
inv.i/ t = (c m ) - (c m ) / m
c
(2)
where j are all incoming flows and k all out-going flows of the inventories. Except the bed inventory we also have one inventory for the steam system, gas cooling, filter and scrubber. The steam system has only water and steam components, while the others have the same components as the bed. The temperature Tinventory in the inventory is calculated from the energy balance:
i i inventory outside inventory k i i p j i i p cp c m T T A U H m c c k m c c out in / ) ( T T t / T j , , j inventory (3)Here ∆H (enthalpy) is the energy released during combustion and U is the overall heat transfer coefficient, A is the heat exchanger area and Toutside the temperature at the other side of the heat exchanger surface (steam temperature vs. exhaust gas temperature). cp,i is the heat capacity for each component i.
These physical models have been combined with statistical models where experimental results in pilot plants
have been used to make PLS models for each single gas component as well as for prediction of Carbon-conversion from waste liquors. As often high amounts of sulphite and sulphide are produced also reduction of sulphate and partially transfer into H2S has been modelled as well. The
main variables for building the PLS-models has been the capacity (kg BL/h,m2), relative oxidation, ER (how much O2
that has been used in relation to the need for 100 % oxidation of all organic material) and the temperature close to the injection point of the black liquor). The gas composition has been measured at several different points with respect to CO, CO2, CH4, H2 and H2S, while water has been calculated from
the shift reaction in the simulation model and from equilibrium data for temperature in the scrubber for the gas composition after the scrubber.
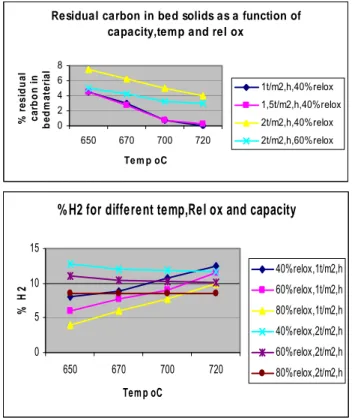
The experimental data was used to make PLS models for each gas component as well as reduction of sulphate to sulphide and also residual carbon content of the ash as a function of Black Liquor load in ton/m2,h, the relative oxidation in % of 100% oxidation (ER) of all organic material and the reaction temperature. In the figure 1 below we can see some examples of plots of these for methane and hydrogen, as well as for the conversion of Carbon into gaseous compounds, or as in this case the residue that is not gasified.
Residual carbon in bed solids as a function of capacity,temp and rel ox
0 2 4 6 8 650 670 700 720 Te m p oC % r e s idua l c a rbo n i n be dm a te ri a l 1t/m2,h,40%relox 1,5t/m2,h,40%relox 2t/m2,h,40%relox 2t/m2,h,60%relox
% H2 for different temp,Rel ox and capacity
0 5 10 15 650 670 700 720 Tem p oC % H 2 40%relox,1t/m2,h 60%relox,1t/m2,h 80%relox,1t/m2,h 40%relox,2t/m2,h 60%relox,2t/m2,h 80%relox,2t/m2,h
Figure 1. Examples of PLS plots from experiments in CFB pilot plant gasification reactor, 1 ton DS/day. Residual carbon in ash and Hydrogen content in produced gas.
C. Other components
Other components to be included in the model depend on the application considered. In case of gas separation with respect to tars, a combination of PLS models and a physical model describing heat transfer from gas to a heat exchanger surface is included. The separation of water is then occurring by condensation in a similar way. CH4 can be separated
using cryogenic methods, where principally CH4 is
condensed out after condensation of CO2, while the other
components like H2, CO and inert components are still in the
gaseous phase. Membrane separation is another alternative, as well as Pressure swing Adsorption (PSA). In the case of these the selectivity for different gas components are the main parameters aside of membrane or surface area and driving pressures.
In case of using black liquors as a feedstock, selective scrubbing of H2S is important, since both recovery of the
chemical and avoiding negative gas emissions are important. The scrubber model includes kinetics as the absorption of H2S is rapid, while the absorption of CO2 is slow at a pH
around 10.5 [14].
III. MODEL VALIDATION: PREVIOUS RESULTS OF SIMULATIONS AND EXPERIMENTS
The model has been validated and compared with experimental data obtained in CFB gasification tests using black liquor and different biomass feed-stocks.
Real plant operation shows that gasification of solid biomass at 900 °C has similarities to gasification of black liquors with high amounts of salts like (Na.K)2CO3,
(Na.K)2SO4, (Na.K)Cl and (Na.K)2S at approximately 700
°C, concerning gas composition of the product gas with respect to CH4 and H2, while CO is significantly lower for
BLG at 700 oC (compare Table I and Table II). Equilibrium calculations in Aspen plus does not include the load. We then get similar CH4 contents at approximately 4 - 500 °C.
The simulations also show that increased pressure gives similar effects as increasing the load or decreasing the temperature. This can be used to see the trends for how different process conditions can be expected to show up in a much wider range than will be possible for the statistical models like PLS.
At TPS in Studsvik gasification experiments have been performed with different organic waste materials. As shown in Table I, the CH4 content is around 2.6 - 2.9 % at 900 °C
for all materials at this temperature in a CFB gasifier [13]. In Västerås experiments were performed in a 1 ton DS/day CFB gasifier with black liquor from Kraft pulp mill.. The results from these experiments were merged into the combined physical and PLS models, as described above (section IIA) and the results are shown in Table II[2]. The process has also been patented according to [15]. Comparison to ASPEN equilibrium calculations are presented further in this article.
TABLE I. GASIFICATION RESULTS IN CFBG AT STUDSVIK, TPS[13] Clean wood Verge grass Org domestic waste Demolition Wood Temp °C 900 900 900 900 CH4 vol-% 2.8 2.6 2.8 2.9 CO vol-% 17.2 14.9 14.0 18.3 H2 vol-% 13.3 12.4 11.3 15.1 H2O vol-% 13.6 14.5 13.7 13.9 gTar/kg wet 12 11 10 12
From experiments at elevated pressure with wood chips [15] and RDF (Refuse-derived-fuel) [16] an even higher CH4 content in the gas, 8.5 respectively 6.5 %, is observed,
also at around 900 oC. This corresponds to around 50 % of the heating value of the gas.
TABLE II. RESULTS FROM EXPERIMENTS AND COMBINED MODEL COMPARED TO EQUILIBRIUM CALCULATIONS FOR THE
SAME CONDITIONS. BLG. Experimiments/Combined models
Input Exp Combined model
% DS 70 70 70
ton DS/m2h 1.8 1 2
Relox 35 40 40
Temp bottom °C 725 650 650 Output
Vol-% gas aft scrub
H2O 27.4 H2 14.5 8 13 CH4 1.48 1 1,4 CO2 12.1 17 17 CO 3.2 2 3.4 N2 40.8 H2S 0.48 H2S removal % 41.8 % SO4 reduction 92.2 C-conversion 97.6 99,5 94
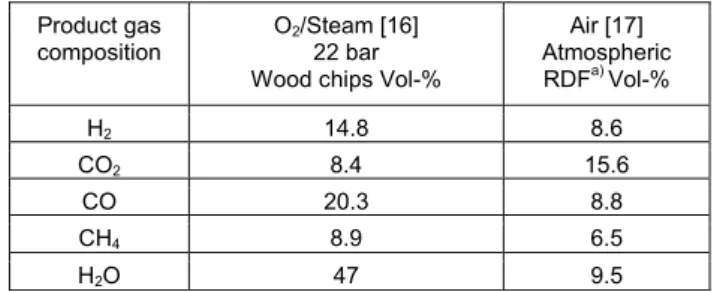
Here we can see that experimental results for in this case 1.8 ton DS/m2.h correlates relatively well to the model for in this case 2 ton DS/m2.h, while the gas is much leaner for the case with half the load. The content of the most important gas components are seen in Table 3 for oxygen/steam gasification at 22 bar compared to atmospheric gasification using air. We can see that there is much CH4 produced in both cases. Still both CO and H2 is
much higher in the first case, where also much less CO2 is
produced, as less carbon is used to drive the gasification process..
TABLE III TYPICAL GAS COMPOSITIONS USING AIR OR OXYGEN/STEAM AS GASIFYING AGENTS IN FLUIDIZED BED
GASIFIERS. Product gas
composition O2/Steam [16] 22 bar Wood chips Vol-%
Air [17] Atmospheric RDFa) Vol-% H2 14.8 8.6 CO2 8.4 15.6 CO 20.3 8.8 CH4 8.9 6.5 H2O 47 9.5 a) RDF = refused-derived-fuel
IV APPLICATION OF MODEL: MODELLING OF GAS COMPONENTS AS A FUNCTION OF IMPORTANT
VARIABLES
In this section, the equilibrium models, using Aspen plus, is applied to show the principal effect of different important variables in the air gasification of the black liquor. The input data for this simulation is taken from table 2. This gives the possibility of comparing the results of equilibrium calculation with the experimental results. Actually the experimental results which are presented further are the results of the PLS model which is close to the real system.
The major reactions occurring in a gasifier, using air or oxygen as oxidizing agent, are listed in Table IV [17].
TABLE IV. THE MAJOR REACTIONS IN THE AIR/ OXYGEN GASIFICATION
Reactions with O2 as oxidizer Heat of reaction ∆H( kJ/mol) -394 -111 -74 +172 +206 -41
These exothermic and endothermic reactions would happen simultaneously depending on the temperature condition in the gasifier.
In Figure 2&3 results from the ASPEN simulation of black liquor gasification at equilibrium conditions are presented. The RGIBBS reactor in ASPEN is used to simulate the equilibrium gasifier with the main strategy of minimization of the Gibbs free energy in the process (reference for the function of RGIBBS reactor from aspen manual).
From figure 2 it is evident that the effect of doubling the load is significant in reality, but without any impact for the equilibrium model. From equilibrium calculations we should get very little CH4 according to figure 3 while in real
plants we see 2.6 - 2.9 % obtained in solid biomass gasification at 900 °C as shown in Table I.
In both figures 2 and 3, there is a gap between the results from equilibrium modelling and the real experiment. For some components this gap is less than the others which is decreasing for most of them by ER and temperature increase.
In figure 3, the equilibrium curves for all of the components except for CH4 are converging towards the
experimental results by ER increase. In the case of methane the difference between equilibrium and experimental results are rather the same in every ER points which could be interpreted that equilibrium models cannot be improved in any operating condition to show the same result as real condition.
Figure 2.Gas composition changes in different Equivalence ratio values in equilibrium and real conditions at 725 °C .
On the other hand a correction factor could be found for methane composition in the equilibrium calculation towards experimental results. In other words, the equilibrium model is showing almost no methane production, while experiments and the combined model is showing some 1 - 1.5 % at 650 - 725 °C.
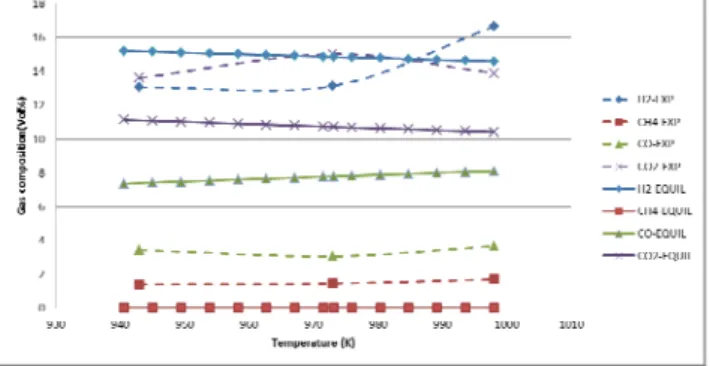
Figure 3. Gas composition changes in different temperature levels in equilibrium and real conditions at ER=0.35
The data and results in figure 3 are all collected for ER of 0.35 while the temperature is changing between 660°C and 725°C. The gap which is mentioned earlier is seen for
all components as well. The general effect of temperature increase is the same for equilibrium and real condition. In case of H2 the experimental results show an increase of
concentration by the temperature rise above 700°C while the equilibrium calculation shows a linear decrease in the amount of produced hydrogen. It is not quite clear here if other things are changing simultaneously as the trend is the same in the first half of the temperature span.
IV. CHP IN COMBINATION WITH BIOMASS GASIFICATION
The combination of a CHP plant with gasification of biomass enables a more flexible use of biomass energy resources compared to only combustion. In this way, the possibility to co-generate heat and power and other chemical energy carriers by either combustion of the product gas or by upgrading to a synthesis gas or a specific energy carrier, such as methane, is introduced. By expanding the CHP plant in this way it is possible to compensate for the lower heating demand most of the year, but still have a capacity to produce high amounts of heat for a district heating net when the winters are very harsh. When the heat load is low the focus is on producing high value fuels like methane from the biomass, while the residual gas with CO+ H2 is burned in the boiler to produce the heat still
needed. Production of methane by using this route is an interesting alternative, compared to production from a tar free CO + H2 synthesis gas. This is as the second case
requires a much more complicated and costly gas cleaning and upgrading process.. Methane production followed by direct separation from the product gas still requires removal of tar prior to separation but will most likely still be less costly.
Methane production by separation from the product gas requires relatively high methane content, higher than obtained in normal gasification as indicated in Table III. To achieve this, the gasification should be optimised for producing a methane rich product gas. Reduced steam to biomass ratio, increased pressure and reduced temperature all increases the CH4 content. In figure 2, at a
steam-to-biomass ratio of 0.07, roughly 50 % CO, 20 % H2 and 20 %
CH4, is produced. As each mole of CH4 contains 3.1 times
more energy than H2 and CO, the CH4 contributes to 47 %
of the HHV of the produced gas. This is why it is interesting to look at the possibility to produce high amounts of CH4
directly and then separate it from the other gas components in the product gas.
Different separation technologies can be used for separating methane from the product gas. Using membrane separation will not give any strict separation, but partial enrichment. This means that the content of methane in the produced gas may not be suitable for use as vehicle fuel directly. By applying cryogenic techniques, a very clean CH4 can be achieved. This is favorable if the product should
be used for vehicles. At the same time, also CO2 can be
carbon capture and storage (CCS) plants. A drawback of cryogenic techniques is the equipment costs, which limits the use to large scale plants.
The combination of gasification and CHP enables cleaning of the gas from problematic substances that are evaporated and passing with the gaseous phase, e.g. chlorides and metal salts, such as alkali salts. This could facilitate the introduction of biomass and waste in today´s existing CHP plants using fossil fuel-based feed-stocks. Co-combustion with biomass and waste is generally not possible in these plants, since the introduction would cause severe materials problems in form of high temperature corrosion on heat exchanger surfaces, where the chlorides and alkali metals are the major concerns. Since rebuilding of existing plants is generally too expensive and therefore not an option, a gasification process is a feasible step to extend the use of existing infrastructure and simultaneously enable the introduction of renewable feedstock as well as future CCS.
The economic conditions combining CHP with biomass gasification are not yet verified, but rough estimates appear to give reasonable figures. System studies related to fuel production and electricity has previously been presented by e.g. Wang et al [18].
In case of black liquor gasification, experimental investigations [2] it is observed that the catalytic effect of the alkali salts reduces the tar formation to almost zero in the product gas, while the reaction temperature can be reduced significantly for the same gasifier capacity compared to solid biomass. By keeping a relatively low temperature it may therefore be possible to get a high CH4
production with respect to heating value. This could be interesting for applications, related to smaller pulp and paper mills, as a complement, where today no recovery is made at all of the spent liquors. The residual CO + H2, could
also, in this case, be used either in a CHP or only for steam production, where there is a significant demand in all pulp and paper industries internally. For methane production, in this particular case, cost effective separation technologies need to be developed.
V. CONCLUSIONS
In this paper, a method with simulation using a combination of physical and statistical models, which are tuned from experimental data, is described. As a complement, equilibrium calculations have been made to show how different important variables are affecting the gas composition. The simulations show that by reducing steam to biomass ratio, reduce the temperature, increase the pressure and increase the load; it is possible to increase the CH4 content in the product gas. In this way, in principle,
approximately 50% of the heating value of the gas is in form of CH4. This opens up for the possibility to directly
separate methane from the product gas as an attractive route for production of methane and thus bio-based SNG. This
will also facilitate the combination of biomass gasification and methane separation with existing CHP plants, enabling flexible energy utilization of heat, power and methane, depending on the energy demands during the year.
Today, different separation methods do exist but still the possibility to apply these methods or the need for further development is not evaluated.
The economic conditions for combining CHP with biomass gasification are not yet verified, but rough estimates appear to give reasonable figures. The use of the simulation models is an attractive approach to explore the different possibilities to optimize the gasification process and to investigate different possibilities.
ACKNOWLEDGEMENTS
This work has been carried out within the Swedish Gasification Centre consortium. Funding from the Swedish Energy Agency and the academic and industrial partners is gratefully acknowledged. The Swedish Knowledge Foundation and Värmeforsk as well as for financial support, and Mälarenergi AB and Vafab Miljö AB is acknowledged for for financial and technical support, respectively. We also thank the Program of Introducing Talents of Discipline to University (“111” Program) Supported by Ministry of Education of China
REFERENCES
[1] Personal communication with the energy company Mälarenergi AB, Västerås, Sweden.
[2] Dahlquist, E. and Jones, A.: Presentation of a dry black liquor gasification process with direct caustization. TAPPI Journal, June 2005, p 15-19. Awarded best peer reviewed research paper 2005 by TAPPI Journal.
[3] Nikoo, M. & Mahinpey, N.: Simulation of biomass gasification in fluidized bed reactor using aspen plus. Biomass and Bioenergy, 32 (12) (2008), pp. 1245–1254.
[4] Hannula, I. & Kurkela, E.: A semi-empirical model for pressurised air-blown fluidised-bed gasification of biomass. Bioresource Technol, 101 (2010), pp. 4608–4615.
[5] Schuster, G., Löffler, G., Weigl, K. & Hofbauer, H.: Biomass steam gasification – an extensive parametric modeling study. Bioresour Technol, 77 (1) (2001), pp. 71–79.
[6] Gómez-Barea, A. & Leckner, B.: Modeling of biomass gasification in fluidized bed. Progress in Energy and Combustion Science 36 (2010), pp 444–509.
[7] Kurkela E., Ståhlberg P., Simell, P. & Leppälahti J., Updraft gasification of peat and biomass, Biomass 19 (1989), pp 37-46 [8] Li, X.T., Grace, J.R., Lim, C.J., Watkinson, A.P., Chen, H.P. & Kim,
J.R.: Biomass gasification in a circulating fluidized bed. Biomass Bioenergy 26 (2004), pp. 171–93.
[9] Kumar, A., Eskridge, K., Jones, D.D. & Hanna, M.A.: Steam-air fluidized bed gasification of distillers grains: effects of steam to biomass ratio, equivalence ratio and gasification temperature. Bioresource Technol. 100 (2009), pp 2062–2068.
[10] Lucas, C., Szewczyk, D., Blasiak, W. & Mochida, S.: High-temperature air and steam gasification of densified biofuels. Biomass Bioenergy 27 (2004), pp. 563–575.
[11] Engvall, K., Kusar, H., Sjöström, K. & Pettersson L.J.: Upgrading of Raw Gas from Biomass and Waste Gasification: Challenges and Opportunities. Top. Catal. 54 (2011), pp. 949–959.
[12] Nemanova, V., Nordgreen, T., Engvall, K. & Sjöström, K.: Biomass gasification in an atmospheric fluidised bed: Tar reduction with experimental iron-based granules from Höganäs AB, Sweden. Catal. Today 176(1) (2011), pp. 253–257.
[13] Faaij, A., Van Ree, R., Waldheim, L., Larsson, E.K., Oudhuis, A., Van Wijk, A., Daey-Ouwensll, C. & Turkenburg, W.: Gasification of biomass wastes and residues for electricity production, Elsevier Inc. (1997).
[14] Tanca M., Dahlquist E. & Flink S.: Patent: A CFB Black Liquor Gasification system operating at low pressure using a circulating fluidized bed,US Patent 5,284,850, (June 1992).
[15] Nossin, P.M.M.: White biotechnology: replacing black gold? In: Fifth international conference on renewable resources and biorefineries, Ghent, Belgium; 10–12 June 2009.
[16] Knoef, H.A.M.: Practical aspects of biomass gasification. In: H.A.M. Knoef (ed): Handbook of biomass gasification. BTG Biomass Technology Group BV, Enschede, The Netherlands, 2005, pp. 13-37. [17] Higman, Cristopher och Burgt, Maarten van der. Gasification. u.o. :
Gulf professional publishing, 2008. ISBN-13:978-0-7506-8528-3. [18] Wang, L., Weller, C.L., Jones, D.D. & Hanna; M.A.: Contemporary
issues in thermal gasification of biomass and its application to electricity and fuel production. Biomass Bioenergy 32 (2008), pp. 573-581.