MASTER THESIS WORK 2007 IDPPOPEXD: 07:98
Reverse Logistics Study
at Volvo CE CST Europe
Reverse logistics study at Volvo CE CST Europe
Performed at Volvo Construction Equipment, Customer Support Division
-Master of Science Thesis, D level, 20 points performed within the institution for Innovation, Design and Product Development at Mälardalen University.
Report number: IDPPOPEXD: 07:98
Authors: Liliane Khalil and Malin Olofsson
Program: Engineering program: Innovative Enterprising
and Process development
Date: Eskilstuna 2008
Commissioner: Volvo Construction Equipment Customer Support
division
Industry supervisor: Eva Olsson - Volvo CE CST Karl Serneberg - Volvo CE CST
Academic supervisor: Mats Jackson – Mälardalen University
Abstract
Title: Reverse logistics study at Volvo CE CST Europe
Authors: Liliane Khalil and Malin Olofsson
Commissioner: Volvo Construction Equipment (VCE). Division; Customer Support (CST). Region; Europe.
---Assignment: The mission of the assignment is to map the four return flows with respect to returning volume, weight, frequency, pick up- and delivery points. Today Volvo CE has a lack of information that concerns their own Reverse logistic processes. It is hard for Volvo CE to see where changes need to be done, due to limited reliable sources.
Purpose: The purpose with the study is to make the return
flows easier, less expansive and more manageable for both Volvo and their dealers. Further,
environmental issues have to be considered in order to find improvements of the returning routines. The analysis is done to bring forth a proposal that will contribute to less unnecessary transports and that also will make it possible to reduce cost.
Result: A couple of improvement areas have been
discovered, some of them are radical while others are incremental. The one thing they have in common is to make sure that the return flows are being
handled and seen as one common flow rather then separately treated. Among the improvements these are some recommendations to Volvo CE:
- Appoint special delivery point for warranty returns and make sure that the warranty routines are followed so that unnecessary transports can be reduced. - Store less cores for remanufacturing at the Core Hub. Cores that are not needed are not necessary to transport to the Core Hub. - Make better cost registrations and cost follow ups and evaluate customer satisfaction to be able to find improvement areas in the future.
II
Acknowledgement
This Master thesis work is our final assignment before getting our university degree after 4, 5 years from the engineering program: Innovative Enterprising and Process Development. It is as a part of the examination with emphasis on logistics.
We would like to express our gratitude to our supervisor and coach Eva Olsson and Karl Serneberg at Volvo CE CST for all the support and inspiration that we have been given during our research. It is much appreciated that you have giving us the chance to travel to German to get an insight view of Reverse Logistics from a dealers point of view. More rewarding is that you helped to arrange so that the benchmarking at Ford Motor Company in Germany were possible.
Also, we want to thank Marcus Bergqvist, Fredrik Gerhardsson, Jannicke Lewin at Volvo CST and Christer Grefve, Thomas Rosander, Niklas Mörkberg, Håkan Adolfsson, Johan Nilsson Magnus Johnsson at Volvo Parts among many others for the interesting discussions and meetings. You have all contributed to this Master thesis.
Furthermore, we address special thanks to our supervisor at Mälardalen University Mats Jackson, Professor of innovative production. Thanks for all valuable assistance during this Master thesis.
Thanks, as well, to Börje Hägg with staff at the Core Hub for a well appreciated reception and for sharing useful information.
Special thanks go to Christian Mohr and Martin Schmid at Swecon
Baumaschinen in Germany. We really appreciate the meeting and guiding tour at your company. New experience from the day gave us additional insight and understanding that we brought along to this Master thesis work.
New exciting impression that we got from the benchmarking study at Ford Motor Company would not have been possible without Ralph Dolega. That is why we also would like to send our thanks to you.
Eskilstuna, February 2008
III
Vocabulary
Aftermarket Dw (BEAT)
Aftermarket Data Warehouse receives and stores information about Volvo CE’s order& invoice data, part data, pricing data, purchasing data and more. From the data different standard reports can be created.
Branch
A branch is owned by a dealer and performs similar tasks as the dealer. The branch communicates with Volvo through the dealer.
Buy Back
A buy back occurs when a part or product is bought back from the customer.
Core
Core is the international term for used/old products which are the main input/raw material to the remanufacturing industry. They are in the beginning of a remanufactured product’s life cycle – and in its end as well, if the product can be remanufactured again. Examples of cores in the construction equipment industry are: engines, transmissions, starter
motors, turbo charger and hydraulic pumps.
Core Balance List
Is a list of core debts in CMS. The list can be seen by the dealers and includes information about how many cores a dealer is obligated to return.
Core Management System (CMS)
CMS is a web based system that enables the parties involved with core handling to gain control over the core flow throughout the whole reman loop.
Dealer
Dealers sells products on behalf of a company or organisation, this is particularly common in the automobile industry.
Deferred set up
A set up with the purpose to get as many cores back as possible. The dealer pays for cores that are not returned to Volvo.
Discrepancy
A discrepancy occurs when it is something wrong with the order. For example too many products or too few products arrived. The products that arrived were defect or not the ones that were ordered. The buyer then returns these products as agreed with the seller.
IV Fortune 500
Is a ranking of the top 500 American public corporations. The ranking is based on measurement of the amount of money that a company receives from its activities in a given period (internet source 1).
Goods system
Global Parts planning system (Goods system) is a system where all warranty goods are registrated.
Impaired material
Material in its current condition and/or configuration that can not fulfil a supplier’s next demand.
Manufacturer Managed Inventory (MMI)
MMI is a web based system that has been developed to support the aftermarket needs.The system aims to control the spare part inventory so that the right products are in the right warehouse at the right time. The system was introduced in 2000 and is built upon history of sales volume. The dealer gets order proposals up to as often as once a day. MMI works as an interface between the dealers and the central warehouse. MMI enables Volvo to see what the different dealers have in their warehouse. Within Europe the different dealers can also see each others warehouse status.
MMI order
MMI order is an order-signal that dealers get from the MMI system. The MMI system calculates the reasonable order quantity and time based on the sales history from the dealer. If the sales behaviour for some reason will change/have changed the dealer can free of charge send the obsolete parts that MMI has proposed back to Volvo after 2 years.
MOPS
Spare part sales system for dealers.
Order class
The dealers can place an order in different order classes that indicate the order’s priority. Order class 1 means that the dealer is in a hurry to get a product, and then the back order coordinator at Volvo Parts receives the order. The acquiring team are responsible to solve lack of the order classes 2 and 5, either by turning to the original supplier of the product or by making a buy back.
V Parma ID
PARMA is short for PARtner MAster. PARMA controls the information for a number of systems that uses customer and supplier data, e.g. SAP R/3. The purpose of PARMA is to create unique identities for all customers and suppliers, meaning that the same PARMA number for a partner is used at all Volvo companies anywhere in the world. PARMA is a general and international system - no company or country specific information is stored in PARMA (internet source 2).
Remanufactured components (reman)
Remanufactured components (or reman) are originally cores that have been factory remanufactured. Remanufactured components are sold for a less price then a new product. Further it has the same quality level, performance, endurance and warranty like a new product.
Rocs
ROCS is the old core handling system based on a database created in MS Access. ROCS is still used for core returns on some markets outside Europe.
SAS system
Is a system used for warranty handling. The system signals out to the dealer which reason the warranty product concerns, which in turns gives the dealer an indication of how to handle the warranty product. Often the dealer knows which products that is supposed to be returned. But to avoid any mistakes, the system is there as a security.
SAP R/3
An Enterprise Resource System from SAP AG, the largest European software enterprise and the third largest in the world. In Volvo CE, SAP R/3 is mostly used within the accounting area to manage invoicing for instance.
Sub dealer
A sub dealer is a dealer of the Volvo dealer. They are not owned by the Volvo dealer.
Supply Chain Management program (SCM program)
SCM is an on going project at Volvo that aims to enhance the way to work in the Volvo Parts Organisation, in the aftermarket, at the dealers of all Business areas and also with Volvo’s suppliers. This will enable higher efficiency in Volvo Parts operations with a lower capital tied up, lower IT running cost and higher parts sales.
SPIS
Spare Parts Information System is Volvo CE’s internally developed warehouse system.
VI SPIS ID
Customer number used when placing orders. It also states the ordering entity’s delivery address.
Team place
Web based information portal where common documents are kept.
Up front billing set up
A set up with the purpose to get as many cores back as possible. When buying a reman the dealer has to pay for both the reman and the core. When returning the core to Volvo the dealer gets credited for the core cost.
Volvo Dealer Network (VDN)
Volvo dealer network is a web based portal for Volvo dealers. A dealer can log into the portal and run different applications through the portal. Important information to the dealer is also published here.
Volvo Parts
Volvo Parts provides services for supporting the aftermarket for the different business areas of the Volvo Group. Volvo Parts collaborates with Volvo Construction Equipment Customer Support to serve the aftermarket of construction equipment.
VII
Table of contents
Front page Abstract Acknowledgement Vocabulary Table of contents Appendix List of figures List of tables Authors note 1 INTRODUCTION ... 1 1.1 BACKGROUND... 1 1.2 PROBLEM STATEMENT... 1 1.3 PURPOSE... 21.4 OUTLINE OF THE MASTER THESIS... 2
1.5 DELIMITATIONS... 3 2 RESEARCH METHODOLOGY ... 5 2.1 CASE STUDY... 6 2.1.1 Interviews ... 7 2.1.2 Questionnaires ... 7 2.1.3 Dealer visits ... 10 2.1.4 Data systems ... 10 2.1.5 Core data... 11 2.1.6 Warranty data ... 12
2.1.7 Buy Back and Discrepancy data... 13
2.2 BENCHMARKING... 13
2.3 LITERATURE STUDY... 13
2.4 CRITICISM OF SOURCES... 14
3 THEORETICAL FRAMEWORK... 17
3.1 SUPPLY CHAIN MANAGEMENT... 17
3.2 REVERSE LOGISTICS... 18
3.3 SUPPLY CHAIN MANAGEMENT AND REVERSE LOGISTICS... 19
3.4 REVERSE LOGISTICS VS. GREEN LOGISTICS... 20
3.5 DIFFERENT PLACES IN THE REVERSE SUPPLY CHAIN... 21
3.6 DIFFERENT REVERSE LOGISTIC FLOWS... 22
3.7 DIFFERENT PRODUCTS IN THE REVERSE LOGISTIC FLOW... 24
3.8 DIFFERENT ACTIVITIES IN THE REVERSE LOGISTIC FLOW... 25
3.9 HOW TO MANAGE REVERSE LOGISTICS... 26
3.9.1 Process development ... 26
3.9.2 Information support systems... 27
3.9.3 Horizontal relationships... 27 3.9.4 Performance measurement... 28 3.9.5 Customer satisfaction... 29 3.9.6 Transportation issues ... 30 3.9.7 Warehousing issues ... 30 3.10 BENCHMARKING... 33
VIII
4 COMPANY DESCRIPTION... 36
-4.1 VOLVO GROUP... 36
-4.2 VOLVO CONSTRUCTION EQUIPMENT (VCE) ... 37
-4.2.1 Business line... 37
-4.2.2 Product line ... 38
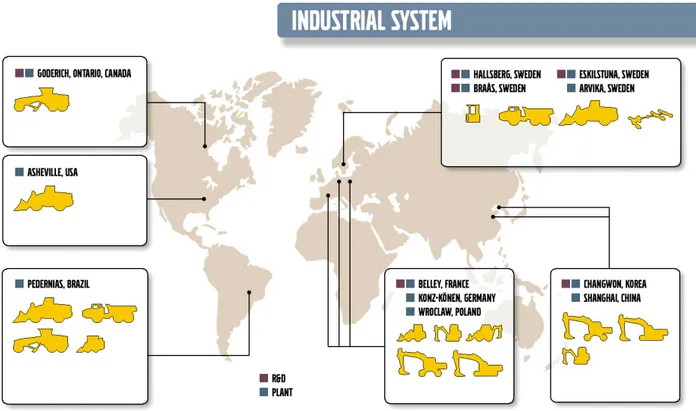
-4.2.3 VCE around the world... 39
-4.3 VOLVO CONSTRUCTION EQUIPMENT CUSTOMER SUPPORT (VCE CST) ... 39
-4.3.1 VCE CST region Europe ... 40
-5 EMPIRICAL DATA... 42
-5.1 CORES AND REMANUFACTURING... 42
-5.1.1 Reasons for remanufacturing ... 42
-5.1.2 Current core flow situation at Volvo CST ... 43
-5.1.3 Different attempts for assuring the core returns... 44
-5.1.4 Dealer and Sub dealer/Branch... 45
-5.1.5 Core Hub... 50
-5.1.6 Renovator ... 52
-5.1.7 Core flow description ... 53
-5.1.8 How to mark the returning core component ... 55
-5.1.9 Reman covered by warranty ... 57
-5.1.10 Information & communication flow description... 58
-5.1.11 Customer satisfaction ... 60
-5.1.12 Transportation... 63
-5.1.13 Pick up and delivery point... 66
-5.1.14 Frequency of core returns... 68
-5.1.15 Quantity of the returned cores ... 70
-5.1.16 Weight of the returned cores ... 71
-5.2 WARRANTY... 72
-5.2.1 Reasons for returning warranty products ... 73
-5.2.2 Dealer and Sub dealer/branch... 73
-5.2.3 Warranty flow description... 76
-5.2.4 Information and communication flow description... 78
-5.2.5 Customer satisfaction... 81
-5.2.6 How to mark the warranty goods returns... 83
-5.2.7 Transportation ... 84
-5.2.8 Pick up and delivery point ... 86
-5.2.9 Frequency of warranty returns... 88
-5.2.10 Quantity of the returned warranty... 89
-5.2.11 Weight of the returned warranty... 91
-5.3 BUY BACK... 92
-5.3.1 Reasons for making buy backs... 92
-5.3.2 Buy back flow description ... 94
-5.3.3 How to mark buy back returns ... 95
-5.3.4 Pick up and delivery points... 95
-5.3.5 Quantity of the returned buy backs... 96
-5.3.6 Weight of the returned buy backs... 97
-5.4 DISCREPANCY... 98
-5.4.1 Reasons for discrepancy ... 98
-5.4.2 Discrepancy flow description ... 99
-5.4.3 How to mark the returning discrepancy products ... 100
-5.4.4 Pick up and delivery points... 101
-5.4.5 Quantity of the returned discrepancies ... 102
-5.4.6 Weight of the returned discrepancies ... 103
-5.5 ALL THE RETURN FLOWS... 105
-IX
6.1 BENCHMARKING PROCEDURE... 109
-6.1.1 Planning for benchmarking... 109
-6.1.2 Gap analysis... 109 -6.1.3 Integration ... 112 -6.1.4 Action ... 112 -7 ANALYSIS ... 114 -7.1 VISION... 114 -7.2 DEVELOPING PROGRAM... 115
-7.2.1 Create a cross functional team ... 115
-7.3 DEVELOPING AREAS... 116
-7.3.1 Reduce transportations ... 116
-7.3.2 Implement the concept of Supply chain visibility... 128
-7.3.3 Customer Satisfaction ... 133 -7.4 ACTION PLAN... 140 -7.5 CONCLUSION... 143 -7.6 RECOMMENDATIONS... 144 -8 REFERENCES ... 145 -8.1 LITERATURE REFERENCES... 145 -8.2 ARTICLES... 146 -8.3 ELECTRONIC REFERENCES... 146 -8.4 VOLVO SCRIPTS... 147 -8.5 INTERVIEWS... 147
-Appendix
Appendix 1 Meeting info
Appendix 2 Questionnaire for core return flow Appendix 3 Questionnaire for warranty return flow
Appendix 4 Dealer’s participating in the core- and warranty questionnaire
Appendix 5 Core quantity
Appendix 6 Core weight (tonne) Appendix 7 Warranty quantity Appendix 8 Warranty weight (tonne) Appendix 9 Buy back quantity Appendix 10 Buy back weight (tonne) Appendix 11 Discrepancy quantity Appendix 12 Discrepancy weight (tonne)
X Appendix 14 Benchmarking questionnaire
Appendix 15 Dealers core returns in quantity for 2004-half 2007 Appendix 16 Dealers core returns in weight for 2004-half 2007 Appendix 17 Dealers warranty returns in quantity for 2004-half 2007 Appendix 18 Dealers warranty returns in weight for 2004-half 2007 Appendix 19 Dealers buy back returns in quantity for 2004-half 2007 Appendix 20 Dealers buy back returns in weight for 2004-half 2007 Appendix 21 Dealers discrepancy returns in quantity for 2004-half 2007 Appendix 22 Dealers discrepancy returns in weight for 2004-half 2007 Appendix 23 Resume of One alternative solution
Appendix 24 Warranty returned to wrong delivery point (percentage of quantity) Appendix 25 Warranty returned to wrong delivery point (percentage of weight)
List of figures
Fig.1. Outline of the master thesis (by authors). Fig.2. Design of investigation (by authors). Fig. 3. Fig.3. Studied flows and areas (by authors). Fig. 4. Reverse logistics (source: Steinhilper, 1998).
Fig. 5. Comparison of Reverse Logistics and Green Logistics (source: Rogers et al. 2001).
Fig. 6. Remanufacturing steps (source: Steinhilper, 1998).
Fig. 7. The Reverse Logistics hierarchy (source: Carter et al. 1998). Fig. 8. Type A network (source: The Chartered Institute).
Fig. 9. Type B network (source: The Chartered Institute). Fig. 10. Type C network (source: The Chartered Institute). Fig. 11. Type D network (source: The Chartered Institute). Fig. 12. Volvo groups business units (source: Volvo intranet). Fig. 13. VCE locations around the world (source: Volvo intranet).
XI Fig. 14. Entities in the core flow (by authors).
Fig. 15. Upfront billing core return set up (by authors). Fig. 16. Deferred core return set up (by authors).
Fig. 17. Average dedicated warehouse space for the core flow (source: core questioner).
Fig. 18. Average hours/week dedicated to handle the core return flow (source: core questionnaire).
Fig. 19. Internal core return set up (source: core questionnaire).
Fig. 20. Is it clear in what condition the core has to be in when it is returned to Volvo? (source: core questionnaire).
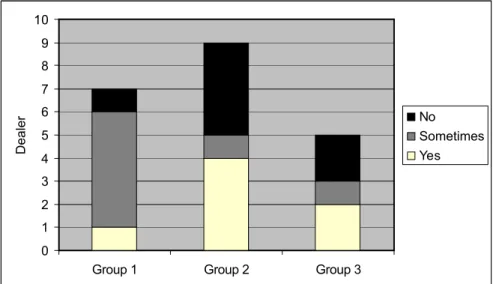
Fig. 21. Payment of internal transportations (source: core questionnaire). Fig. 22. Payment of internal transportations per dealer group
(source: core questionnaire).
Fig. 23. Coordination of internal transportation (source: core questionnaire). Fig. 24. Coordination of internal transportation per dealer group
(source: core questionnaire). Fig. 25. Core flow description (by authors). Fig. 26. Core return document (source: VCE). Fig. 27. Core return tag (source: VCE). Fig. 28. Information and communication flow
(a modification of an existing model at Volvo). Fig. 29. Dealers thinking that the CMS System is working well
(source: core questionnaire).
Fig. 30. Dealer’s thoughts about the condition of the core when it returns to Volvo (source: core questionnaire).
Fig. 31. Dealers’ thinking it is hard to keep the time limit of 6 weeks (source: core questionnaire).
Fig. 32. Dealers thinking it is hard to keep the time limit of 6 weeks divided in to groups (source: core questionnaire).
Fig. 33. Reasons why 6 weeks is considered to be a too short time limit (source: core questionnaire).
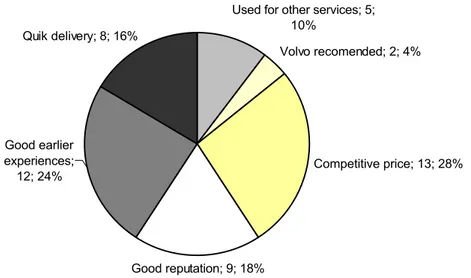
Fig. 34. Reasons when deciding upon transportation company (source: core questionnaire).
XII (source: core questionnaire).
Fig. 36. Number of dealer’s coordination transports (source: core questionnaire). Fig. 37. Pick up- and delivery points for core returns in Europe (by authors). Fig. 38. Pick up- and delivery points for core returns in Sweden (by authors). Fig. 39. Dealer’s frequency of core returns per month
(source: core questionnaire).
Fig. 40. Average frequency of core returns per month/group (source: core questionnaire).
Fig. 41. Core return flow – Quantity (source: Beat). Fig. 42. Core return flow – Weight (source: Beat)
Fig. 43. Average hours/week dedicated to handle the warranty return flow (source: Goods).
Fig. 44. Organisation of the internal warranty return flow (source: warranty questionnaire).
Fig. 45. Organisation of the internal warranty return flow per group (source: warranty questionnaire).
Fig. 46. Payment of internal warranty transportations (source: warranty questionnaire)
Fig. 47. Warranty flow description (by authors)
Fig. 48. Warranty communication flow (by authors)
Fig. 49. Is it understood who you should contact for questions about the warranty flow at Volvo? (source: warranty questionnaire).
Fig. 50. Do you think that the DMS system is working well? (source: warranty questionnaire)?
Fig. 51. Do you think that the information criteria is well understood (source: warranty questionnaire)?
Fig. 52. Is it difficult to keep the time limit when returning warranty parts (source: warranty questionnaire)?
Fig. 53. Dealers thinking it is hard to keep the time limit divided in to groups (source: warranty questionnaire).
Fig. 54. Warranty tag (source: Volvo CST).
Fig. 55. Coordination of transports (source: warranty questionnaire). Fig. 56. Pick up- and delivery points for warranty returns in Europe
XIII
Fig. 57. Actual pick up and delivery points for warranty returns in Europe (by authors).
Fig. 58. Dealer’s frequency of warranty returns per month (source: warranty questionnaire).
Fig. 59. Average frequency of warranty returns per month/group (source: warranty questionnaire).
Fig 60. Warranty return flow – Quantity (source: Goods). Fig. 61. Warranty return flow – Weight (source: Goods). Fig. 62. Buy back flow description (by authors).
Fig. 63. Pick up- and delivery points for buy back returns in Europe (by authors).
Fig. 64. Buy back return flow – Quantity (source: SPIS). Fig. 65. Buy back return flow – Weight (source: SPIS). Fig. 66. Discrepancy flow description (by authors).
Fig. 67. Pick up- and delivery points for discrepancy returns in Europe (by authors).
Fig. 68. Discrepancy return flow – Quantity (source: Excel sheet from Volvo). Fig. 69. Discrepancy return flow – Weight
(source: Excel sheet from Volvo).
Fig. 70. Compiled picture of quantity and weight returns for all return flows (by authors)
Fig. 71. Visualised picture of the quantity returns (by authors) Fig. 72. Visualised picture of the weight returns (by authors)
Fig. 73. A converted triangle that symbolises the analysis (by authors). Fig. 74. Picture of a core attacked with rust
(source: picture taken by the authors at the Core Hub) Fig. 75. Internal supply chain visibility
Fig. 76. External supply chain visibility Fig. 77. Suggestion on standardised tags Fig. 78. Example of action plan.
XIV
List of tables
Table 1. Outline of the Master thesis (by authors). Table 2. Core dealer groups (by authors).
Table 3. Warranty dealer groups (by authors).
Table 4. Data systems used for collecting quantity and weight info (by authors).
Table 5. Core system info from Aftermarket Dw (BEAT).
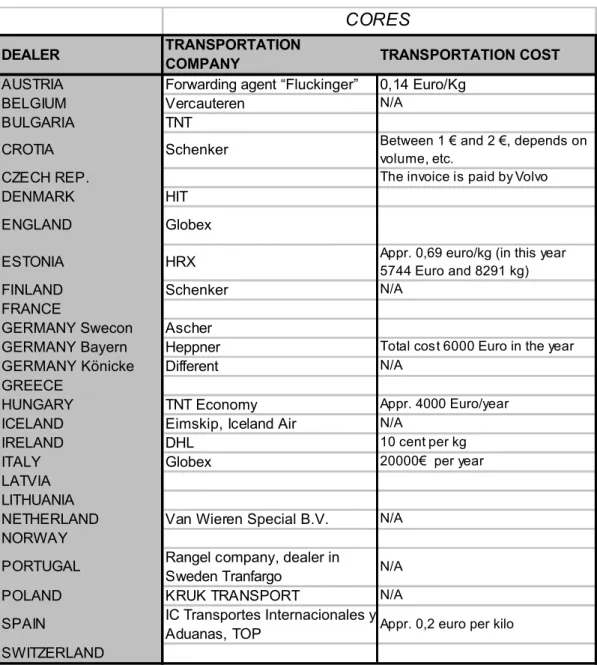
Table 6. Term and explanation of product line (source: Volvo CST). Table 7. Transportation company and cost for the core return flow
(source: core questionnaire).
Table 8. Core returns in quantity (source: Beat). Table 9. Core returns in weight (source: Beat).
Table 10. Increase in core weight and quantity (by authors).
Table 11. Transportation company and cost for the warranty return flow (source: Volvo).
Table 12. Returning reasons for Warranty (by Volvo).
Table 13. Warranty quantity returned to Konz and Eskilstuna (source: Goods). Table 14. Warranty weight returned to Konz and Eskilstuna (source: Goods). Table 15. Buy back quantity returned (source: SPIS).
Table 16. Buy back weight returned (source: SPIS). Table 17. Discrepancy quantity returned (source: SPIS). Table 18. Discrepancy weight returned (source: SPIS). Table 19. Increase in discrepancy weight and quantity
(source: Excel sheet from Volvo)
Table 20. Information about Ford Motor Company (by authors). Table 21. Transportation company for core and warranty returns
(source: dealer questionnaire and Volvo data) Table 22. Transportation cost for core and warranty returns
XV
Authors note
It is always interesting to look in the rear-view mirror when a project is completed. Often it can be thought that it could be better and how many steps that was unnecessary. This is true in many cases, if it is clear from the
beginning were the research is heading. It is easier to do the work if it from the beginning is clear that the research goes from point A to point B.
The problem when carrying out research is that one often does not know where to go, and there is no map to follow. When this work started the overall
objective was defined by the thesis owner and the supervisor together whit the authors. This was a great beginning and really helped us keep the focus thru the entire thesis period. As time went by the agreed upon objective was easier to manage in the actual daily work, but it was not entirely understood until the half time report when the scope of the work felt truly understandable.
The master thesis owner and the supervisor at the company had the outcome of this research figured out from the beginning. Although it was kept secret from the authors in order to not direct the research to much. The reason for this was, that if the master thesis work concludes with the same outcome as was
predicted, it would pretty much mean that the outcome is right.
The outcome of this research is interesting. But from the authors perspective it is not the outcome that is the most interesting part of the work. The opportunity to do this work at Volvo and the amount of valuable knowledge that this gave was the absolute most interesting. The process has not been to discover point B, but how to reach it.
CHAPTER 1
INTRODUCTION I Research Methodology I Theoretical Framework I Company Description Empirical Data I Benchmarking I Analysis I References
1
1 Introduction
This first part of the report includes a description of why the idea of this Master thesis raised and which main areas that was desirable to investigate. This chapter will discuss and set the framework for the conduction of the research. It will thoroughly explain the different stages of the research and the choices that have been made. It will determine the limitation of the research and is a user guide for everyone reading this thesis.
1.1 Background
Volvo Construction Equipment Customer Support Division has the global commercial and development responsibility for parts and service for Volvo’s entire range of construction equipment.
The responsibility comprises marketing, service, purchasing, logistics and business development as well as Remanufacturing of components.
At Region Europe Parts Supply and Logistics the logistics of the reverse flow is handled by daily contacts with the dealers. There are four different reasons why products are in the reverse flow at Volvo CE. Either they will be remanufactured (reman), or because of the product broke (warranty), Volvo have bought the product back (buy back) or it was something wrong with the order (discrepancy). All these flows are necessary because Volvo needs to be competitive. The
articles are sent back to Volvo through the dealers around Europe.
1.2 Problem statement
Volvo has discovered that there is a lack of control of the flows. To be able to control the flows and in order to find cost savings and improvement areas it is important to have accurate information about the flows.
Today Volvo has many different return flows and the products travel many different routes. This system is not always easy to understand for any parties handling the parts. Because of these complicated routines many unnecessary mistakes occur.
This thesis work aims to make the process easier and more manageable for the dealers and for Volvo. Customer satisfaction is an important issue for Volvo and
INTRODUCTION I Research Methodology I Theoretical Framework I Company Description Empirical Data I Benchmarking I Analysis I Recommendations
2
therefore this work is concentrated around finding small as well as big improvement areas in the whole reverse logistic flow.
1.3 Purpose
Volvo CST wishes to have a more detailed picture of the flow between dealers and the warehouses. The purpose of this master thesis is therefore to map the flow of the products being sent back from dealers to the three different warehouses dealing with the returned products from Europe.
With this information the authors wishes to make an analysis containing several recommendations on how Volvo CE should work with reverse logistics and improve the logistic flow from the dealers to the Volvo warehouses.
A detailed description will in turns also make it easier for all parties involved in the reverse logistic program, not least the dealers, to understand the flows and correspondingly impacts.
Compiled information about the flows will most likely also contribute to
observations of improvement areas and therefore the information compiled in this master thesis will lay as a foundation for further research at Volvo CST. This proposal is also designed to assist in the administration at Volvo CST and the material is a foundation for further presentations by Volvo CST.
This thesis work can be used as an introduction to people not familiar with Volvos way of working with reverse logistics.
Since sustainability and environment questions is on the agenda and recognized as an important area to work with, Mälardalen University has interest in this thesis work in the planning of a new area of education, including reverse logistic and recycle design and the marketing of this area.
Another important purpose of this thesis work is to educate the authors in the subject reverse logistic at Volvo at the same time while giving an introduction in how Volvo works.
1.4 Outline of the Master thesis
The structure of this thesis can briefly be divided into nine sections related to the nine main chapters. Together they reproduce the logical working process of this thesis work. And each section complements the next. Table 1 below illustrates the evolution of this thesis work.
INTRODUCTION I Research Methodology I Theoretical Framework I Company Description Empirical Data I Benchmarking I Analysis I Recommendations
3 Table 1. Outline of the Master thesis (by authors).
1.5 Delimitations
This master thesis is limited to only research the European region of Volvo CE CST.
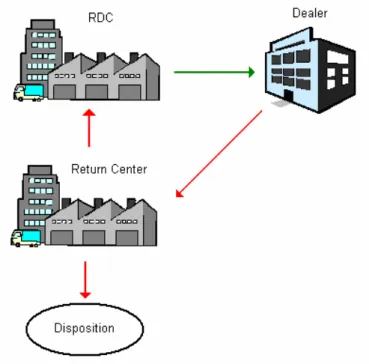
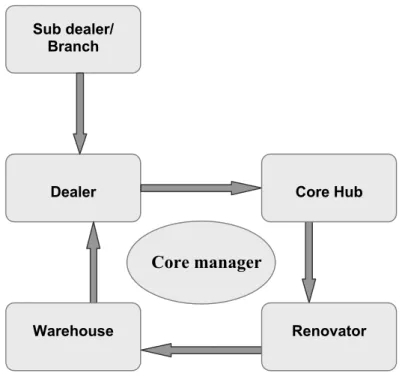
Core return flow is currently described as 4 nodes where in between the returned products passes throw. The core passes; dealer - Core hub-
Renovator-Warehouse. This master thesis will only investigate and analyse the flow from the dealer to the Core Hub. But in order to get an understanding and an overview of the core flow, the flow between the remaining entities of the supply chain will be mapped and described on a comprehensive level.
Buy back returns can be classified in three different types. Two of them that will be mapped in this study occurs when dealer wants Volvo to buy back products from them (Commercial buy back and MMI buy back). In this study, data collection concerning quantity and weight return for these two types has been made. The third buy back type (Repurchase buy back) will not be mapped in this research. There will only be a brief presentation of what Repurchase buy back is. Volvo pool emballage is the fifth return flow at Volvo CST. Due to time
limitations this flow will not be included in the range of this Master thesis.
The analysis will mainly be based on information concerning the warranty- and reman flow. Buy back- and discrepancy flow is not prioritised, the information about these will only be mapped and described in this research.
Contents Chapter Introduction 1 Research methodology 2 Theoretical framework 3 Company Description 4 Empirical data 5 Benchmarking 6 Analysis 7 Recommendations 8 References 9
CHAPTER 2
Introduction I RESEARCH METHODOLOGY I Theoretical Framework I Company description Empirical Data I Benchmarking I Analysis I Recommendations
5
2 Research methodology
This chapter explains the methods used while conducting data gathering, as well as the analysis of data.
Figure 1 below shows the intended research progress in terms of which areas the study planned to focus upon and at what time.
Fig.1. Outline of the master thesis (by authors).
The base of the study is the analysis. To be able to make the analysis, the authors have used two main input sources, theoretical and empirical. Figure 2 below shows that these two sources led to the analysis.
Aug Sep Oct Nov Dec Jan Feb
TIME SCOPE OF
STUDY
Introduction of assignment
Master thesis framework Case study Benchmarking Literature study Analysis Recommendations Presentation
Aug Sep Oct Nov Dec Jan Feb
TIME SCOPE OF
STUDY
Introduction of assignment
Master thesis framework Case study Benchmarking Literature study Analysis Recommendations Presentation
Introduction I RESEARCH METHODOLOGY I Theoretical Framework I Company description Empirical Data I Benchmarking I Analysis I References
6 Fig.2. Design of investigation (by authors).
2.1 Case study
The case study started as soon as the introduction of the assignment was clear and well understood. It meant to collect as much accurate information about the Volvo CST return flow in order to be basis for the upcoming analysis. The scope of information that were to be gathered concerned the aftermarket related return flows from Volvo CE dealers in Europe with respect to:
- Quantity
- Wight
- Pick up- and delivery points
- How to mark the returning goods
- Frequency per flow
- Systems used to administrate the return flows
- Information- and communication flow
Information was gathered from interviews, questionnaires, meetings, Volvo presentations and from Volvos internal Intranet.
The figure below shows which return flows that were studied and at in which areas
Theory Empiric • Interviews • Dealer Ford, workshop * 2 Core hub, • Meetings • Volvo presentations • Intranet • Data Bases • Questionnaires • Literature • Internet • Earlier knowledge Analysis Improvments
Introduction I RESEARCH METHODOLOGY I Theoretical Framework I Company description Empirical Data I Benchmarking I Analysis I References
7 Fig. 3. Studied flows and areas (by authors).
2.1.1 Interviews
During the research many interviews were made with different people in different positions within the reverse supply chain. (For more detail see appendix 1, meeting info). The interviews can be divided into two rounds.
The first rounds of interviews were conducted in the beginning of the research (during the first 10 weeks) when the authors needed to get an overview of the Volvo return flows. In this round the interviews were recommended by the supervisor and mostly made by presentations, explanations and discussions.
After each interview additional pieces of information were given so that the whole picture of the return flows became more and more clear.
The second round of interviews were made when the analysis were starting. At that point the questions regarded other subjects and were more detailed since the search was for more specific data.
Considering the problem of this thesis the openness towards the interviewees can be considered as unrestricted. Since most of the interviewees were made with people working at Volvo and other actors that can benefit from the research.
2.1.2 Questionnaires
To observe information hold by dealers regarding the return flows for warranty and cores a questionnaire were sent to each dealer. The questionnaire was compiled after several discussions with concerned internal employees at Volvo CST to get as accurate questions as possible (see appendix 2 Core questionnaire and appendix 3, Warranty questionnaire). The questionnaire was sent to all the dealers returning products to Volvo CE within Europe.
x x Info- & Communication flow x x x x x Discrepancy x x x Process-description x x Transport x x Frequency x x x Goods labeling x x All return flows x x x Buy back x x x x Warranty x x x x Core Customer satisfaction Pick up-& Deli very point Weight Quantity Returnflow/ Area x x Info- & Communication flow x x x x x Discrepancy x x x Process-description x x Transport x x Frequency x x x Goods labeling x x All return flows x x x Buy back x x x x Warranty x x x x Core Customer satisfaction Pick up-& Deli very point Weight Quantity Returnflow/ Area
Introduction I RESEARCH METHODOLOGY I Theoretical Framework I Company description Empirical Data I Benchmarking I Analysis I References
8
The purpose of the questionnaire was to obtain qualitative and quantitative information. The qualitative information comes from the answers that describe what the different dealers think about the reverse flow.
In appendix 4 it is presented which dealer who was taking part of the questionnaires and answered each question.
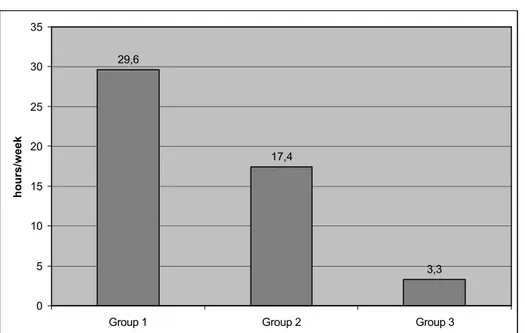
In order to analyse the answers of the questions and to understand the dealer’s behaviour a categorisation in three groups were made. The categorisation is based on an average of how many products each dealer has been returning during the time period: 040101-070630.
The categorisation of dealers for core returns is presented in table 2 below. The dealers in group 1 represent the dealers who contribute to the highest quantity of core returns. The numbers were then divided by 4. The dealers were then grouped according to this number. Dealers with a number between 0-99 is considered as “small” dealers when it comes to amount of core returns and is placed in group 3. Dealers with a number between 100-800 are considered as medium dealers and are therefore part of group 2. Finally dealers with a number between 801 – 4500 are considered as large dealers and are part of group 1.
Introduction I RESEARCH METHODOLOGY I Theoretical Framework I Company description Empirical Data I Benchmarking I Analysis I References
9 Table 2. Core dealer groups (by authors).
The groups are not of the same size, therefore, when comparing them, an average has always been used. Group 1 have 8 members, group 2 have 12 members and group 3 have 9 members. A total of 27 dealers answered the core questionnaire that was sent out to 30 dealers totally. There was a 90 % answering degree on the core questionnaire.
The categorisation of dealers in groups for warranty returns is calculated in the same way as the core groups and the groups is presented in table 3 below. The dealers in group 1 represent the dealers who contribute to the highest quantity of warranty returns. The numbers were then divided by 4. Dealers with a number between 0-50 is considered as “small” dealers when it comes to amount of warranty returns and is placed in group 3. Dealers with a number between 51-200 are
considered as medium dealers and are therefore part of group 2. Finally dealers with a number between 201 – 1163 are considered as large dealers and is part of group 1.
Group 1 Group 2 Group 3
Spain Italy Iceland
Netherlands Austria Hungary
Finland Portugal Bulgaria
Sweden Denmark Lithuania
Ireland Belgium Latvia
England Germany Croatia
Norway Germany Estonia
France Germany
Switzerland
Poland
Czech Rep.
Introduction I RESEARCH METHODOLOGY I Theoretical Framework I Company description Empirical Data I Benchmarking I Analysis I References
10 Table 3. Warranty dealer groups (by authors).
The warranty groups are not of the same size, therefore, when comparing them, an average has always been used. Group 1 have 9 members, group 2 have 6 members and group 3 have 5 members. A total of 20 dealers answered the core questionnaire that was sent out to 29 dealers totally so there was a 69 % answering degree on the warranty questionnaire.
2.1.3 Dealer visits
During the thesis work the information about the different dealers were gathered in different ways. One represent from the dealer in France were interviewed during his visit to Sweden. Swecon Baumaschinen is another dealer of Volvo that also was interviewed during a visit to Germany. During the dealer-interviews the two dealer questionnaires, earlier mentioned (see appendix 2 & 3) were used as basis for discussion. These interviews provided the authors knowledge about how the return flows is considered from a dealer perspective.
2.1.4 Data systems
Different data systems were studied to get information about the returned quantity and weight of products for the different return flows (see table 4 below). The period studied were the years 2004, 2005, 2006 and the first half of 2007. The figure
Group 1 Group 2 Group 3
England Austria Croatia
Finland Belgium Hungary
Germany Denmark Iceland
Germany Germany Italy
Germany Portugal Latvia
Netherlands Poland Norway
Switzerland
Introduction I RESEARCH METHODOLOGY I Theoretical Framework I Company description Empirical Data I Benchmarking I Analysis I References
11
below show which data systems were used for collecting respective return flow info. A more detailed description of each system is presented in the vocabulary.
Table 4. Data systems used for collecting quantity and weight info (by authors).
2.1.5 Core data
Reports from the DW system Beat (see vocabulary, Aftermarket Dw (BEAT) were studied. These include information about core part number, together with each delivering dealer and also concerned quantity received at the Core Hub as presented in table 5 below.
Table 5. Core system info from Aftermarket Dw (BEAT) (by authors).
With this information the total weight could be calculated by exporting the report to Microsoft excel and by using a database over the weight for the different products. The weight was then multiplied with the received quantity of the products to get the total received weight per dealer and year.
Registrations of quantity received at the Core Hub have 3 different reports. Each of the three reports was studied in order to collect quantity information for each year. The reports have been called Rocs-, CMS- and Scrapped report by the authors.
Registrations in Rocs reports were used more frequently in 2004 and 2005, before CMS was introduced, and are nowadays more or less not in use. CMS reports are used mainly today for registrations. Scrapped reports include information
concerning products and that have been received at the Core Hub and thereafter been scrapped. These reports only have data from mars 2006 and ahead since that is when the registrations started.
The authors were able to see which dealers that had sent cores back to Volvo. These were then visualised in maps. Since there was so many dealers in Sweden sending in cores, a separate map of Sweden were made.
Return flow Data system
Core Aftermarket Dw (BEAT)
Warranty Goods
Buy back SPIS
Discrepancy SPIS
Core part
number Parma ID Qty Received
Introduction I RESEARCH METHODOLOGY I Theoretical Framework I Company description Empirical Data I Benchmarking I Analysis I References
12
2.1.6 Warranty data
To get information about how many warranty products that each European dealer have been sent, the Goods system at Volvo were studied. In the system information about which components that had been sent back to the warehouses in Eskilstuna and Konz could be found. It was also possible to sort out from which dealer the product came and how many that was sent. In the Goods system the information was sorted by filling in the information: From date and to date, original location either Eskilstuna or Konz and goods type was installed to all.
The search started by firs seeking out the components that were sent to Eskilstuna by selecting Eskilstuna in the original location box. This Eskilstuna tableau was then exported to Microsoft Excel so that it would be more user friendly to work with.
The system contains duplications; therefore the information hade to be checked against the Konz tableau for each year to make sure that the data is not repeated. The check was done in a program called Microsoft Visual. And the assortment of duplicates was made in Microsoft Excel. The Goods system is neither able to sort out the components that have been sent from dealers outside of Europe. This also hade to be sorted out manually in Excel. The preparations were made in order to get the unique report containing info about the receiving warranty quantity to
Eskilstuna warehouse sent from European dealers.
In a similar way as when calculating the weight of core returns, the warranty weight returns was calculated. An obstacle that were faced was that the data base for warranty product did not contain weight info for all the warranty part numbers. The average kilo of a warranty product was calculated in order to be used to determine the weight return of the warranty products that did not have any weight info. For the warranty products that were returned 2004 there was no missing weight info.
To summarise the quantity- and weight return per dealer, each dealer were picked in the Parma ID/ SPIS ID column. And the sum of each dealer returning quantity and weight were manually written on a separate Excel sheet (See appendix 5-12). While doing this, it got revealed that some dealer hade registrations of unreasonable returning quantities. The suspicious returning orders were therefore manually tracked in the SPIS system (see vocabulary, SPIS). It turns out that these quantities did not agree with the actually returned quantity. Changes were made for these (see appendix 13).
The authors were able to see which dealers that had sent warranty goods back to Volvo. These were then visualised in maps. Since there was so many dealers in Sweden, a separate map for Sweden were made.
Introduction I RESEARCH METHODOLOGY I Theoretical Framework I Company description Empirical Data I Benchmarking I Analysis I References
13
2.1.7 Buy Back and Discrepancy data
The data about the discrepancy and buy back return flows were gathered by exporting the data from SPIS to an excel sheet. The sheet contained information about the received buy backs and discrepancies from the year 2004 to 2007. The sheet included part nr, receiving year, delivery type inbound (which is 3 for
discrepancy and buy backs), quantity, delivery note number, vendor delivered from, weight and date.
The excel sheet was then modified to only include the necessary information for this study.
The discrepancy articles and the buy back article was separated to a sheet of their own since the delivery note number for discrepancies include a 5 digit number and the delivery note number for buy backs include a 4 digit number they were easily separated.
Like with the other flows, only the data from half of the year 2007 was studied (2007-01-01 to 2007-06-30).
The part number made it possible to identify which dealer sent the products. The amount and the weight that each dealer sent in was then calculated and transferred to an excel sheet (see appendix 9-12)
2.2 Benchmarking
To get an understanding of how equally processes for reverse logistics can work at other companies than Volvo CE CST, benchmarking were made at Ford Motor Company in Germany. Before the benchmarking meeting, questions were compiled by discussions with internal employees (see appendix 14, benchmarking
questionnaire)
2.3 Literature study
To assemble accurate information and to get knowledge within the area reverse logistics, a literature study was made. Main literature references have been scientific articles and periodicals taken from the data base ELIN@Mälardalen at Mälardalen University. Other literature sources come from several books lent from the library. Apart from articles, also thesis works written by earlier students has been studied. Further information is gathered from the Internet.
Introduction I RESEARCH METHODOLOGY I Theoretical Framework I Company description Empirical Data I Benchmarking I Analysis I References
14
2.4 Criticism of sources
The information taken from articles that the authors used in this research are published and are therefore expected to have high reliability. Though, some information might be seen as out of date since it is published a long time ago. To judge whether the accuracy is high or low the authors have analysed the theory with help of earlier knowledge within the subject.
A negative effect by using questionnaires is the risk of the questions being
misunderstood by the respondent. In comparison with interviews, the questionnaire method is not based on a dialogue between the researchers and the respondent. Considerable effort must therefore be devoted to the questionnaire, in order to construct well defined questions which will be understood by the respondents.
Some of the data and collected information has been in Swedish and then translated into English. The translations have been made as accurate as possible, but there is a possible effect that the translation might have on linguistic nuances. We would also like to make our readers aware of that citations may include a language
characterised by the business jargon or simply the spoken word.
The authors make reservations against the human error factor that possible can affect the accuracy of information given by data collection. Mainly collection taken from Volvos own data systems may give incorrect information. Some of the made registrations in the data system is made manually which can result in less accurate values due to mistakes. But reservations should also be made against how the answers from the questionnaires have been interpreted. It is worth mentioning that the quality of the answers from the questionnaires varied.
When it comes to data collection of core returns, it is worth mentioning that delays of registrated core returns in CMS influences the veracity of compiled data. That means for example that cores that hade been sent in December a year are not necessary registrated as received in the CMS system until January next year. It also happens that dealer’s sends back wrong core that in the end also affect the veracity of data. That is to say that the counted percentage of returns for a year might be a little misleading.
As mentioned in the data system chapter earlier, while compiling information about the weight of warranty return the authors made the observation that all returned warranty product did not have any weight information. Therefore an average kilo of a warranty product was calculated and used for the warranty products that did not have any weight info. The authors would like to make the readers aware of that the warranty weight information is not completely correct. But still, it indicates a reasonable volume.
Introduction I RESEARCH METHODOLOGY I Theoretical Framework I Company description Empirical Data I Benchmarking I Analysis I References
15
When calculating the warranty volume and weight unusual high quantities were discovered on specific return orders. When the orders were found in SPIS assumptions were made that the number was wrong and was supposed to be one which is the most common quantity for these specific articles since there are one per machine. But since there was no related claim it can not be seen in the system.
Reservations should also be made when it comes to the benchmarking results. Since the visited company knew the purpose of the visit the answers could have been modified in some points.
When calculating the weight of the Buy Back articles some part numbers were missing the weight info. Therefore an average was calculated that showed that an average buy back article weighs 16,73 kg (28428 kg /1699 articles). A total of 19 articles were missing weight info, a reservation is therefore done if there are any misleading information due to this although the chance is very small.
CHAPTER 3
Introduction I Research Methodology I THEORETICAL FRAMEWORK I Company Description Empirical Data I Benchmarking I Analysis I References
17
3 Theoretical Framework
This chapter describes the theories behind this master thesis. The theory found gave the authors a deeper understanding which in turn led to the prerequisites to develop the result and conclusion of the thesis. The theoretical framework also presents the basic of the concept to the reader.
3.1 Supply chain management
Supply chain management (SCM) is the process of planning, implementing and controlling the operations of the supply chain as efficiently as possible (internet source 3).
There are many areas of SCM such as:
Distribution network configuration: number and location of suppliers, production facilities, distribution centres, warehouses and customers. Distribution strategy: centralized versus decentralized, direct shipment,
cross docking, pull or push strategies, third party logistics.
Information: integration of systems and processes through the supply chain to share valuable information, including demand signals, forecasts,
inventory and transportation etc.
Inventory management: quantity and location of inventory including raw materials, work-in-process and finished goods.
Cash-flow: arranging the payment terms and the methodologies for exchanging funds across entities within the supply chain.
The purpose of supply chain management is to improve trust and collaboration among supply chain partners, thus improving inventory visibility and improving inventory velocity.
Many models have been introduced for understanding the activities required to manage material movements across organisational and functional boundaries. SCOR is a supply chain management model promoted by the Supply Chain Management Council. Another model is the SCM Model proposed by the Global Supply Chain Forum (GSCF).
Introduction I Research Methodology I THEORETICAL FRAMEWORK I Company Description Empirical Data I Benchmarking I Analysis I References
18
3.2 Reverse logistics
Reverse logistics came to researchers interest at the beginning of the 1980´s. In 1986 Murphy defines reverse logistics as the “movement of goods from a customer towards a producer in a channel of distribution” (Carter and Ellram, 1998). Throughout the 1980´s the scope of Reverse Logistics was limited to the movement of material against the primary flow, from the customer toward the producer (Rogers and Tibben-Lembke (2001). A more detailed definition of Reverse Logistic was conducted by Rogers et al:
“The process of planning, implementing, and controlling the efficient, cost effective flow of raw materials, in-process inventory, finished goods, and related information from the point of consumption to the point of origin for the purpose of recapturing or creating value or propel disposal”.
Reverse logistic systems, the secondary handling of products, is a competitive advantage to many companies. Reverse logistic can be viewed as the reverse distribution of materials among channel members. A more holistic view of
Reverse Logistic includes the reduction of materials in the forward system in such a way that fewer materials flow back, reuse of materials is possible, and recycling is facilitated (Carter et al. 1998).
Fig. 4. Reverse logistics. (Source: Steinhilper, 1998).
According to Giuntini (2007) the aftermarket material control and planning environment is five times more complex than that of new product manufacturing.
Recover
Prepare and ship
Retire
Reclaim and/or dispose
Renew
Maintain and/or modify configuration
Return
Prepare and ship back to customer
Restock
Recive and stock for next customer demand
Review
Receive and evaluate
Recognize
Introduction I Research Methodology I THEORETICAL FRAMEWORK I Company Description Empirical Data I Benchmarking I Analysis I References
19
3.3 Supply Chain Management and Reverse
Logistics
There is a new focus on reverse logistics according to Rogers et al. 2001. One example of the new focus on reverse logistics is that the Supply Chain Council have extended their SCOR model of supply chain processes from the traditional Plan, Source, Make and Deliver to now include Return (Rommert Dekker). This new focus is also confirmed by the growing number of articles and conference sessions that proves that many companies are starting to have an interest in implementing a reverse logistic system (Rogers, 2001).
Twenty years ago, supply chains were busy fine-tuning the logistics of products from raw material to the end customer (Rommert Dekker). Products are obviously still streaming in the direction of the end customer but an increasing flow of products is coming back. Managers increasingly face the necessity of dealing with products that have been returned, recalled, or are in the reverse flow for some reason (Rogers et al). The reclamation and further handling of assets has become a priority issue for businesses because of the potential simultaneously enhancing profitability and customer satisfaction (Daugherty, Myers, Richey, 2002). In addition to environmental and cost benefits, a reverse logistic program can proactively minimize the threat of government regulation and can improve corporate image (Carter et al. 1998). In today’s competitive environment, going backwards is as important as going forwards (Trebilcock, 2002).
Businesses play a key role in delivering sustainable development through the use of effective transports and logistic systems (The Chartered Institute). However, most of the research in this area has focused on the delivery of the product to the market place.
An inefficient reverse logistic system is not only economically untenable, but also untenable when it comes to the environment. Vehicles running empty or light loaded, increase pollution and energy consumption and produce pressures on the road space.
Many activities are common for both reverse logistics and supply chain
management. The activities can be grouped into strategic, tactical, and operational levels of activities (internet source 3):
Strategic:
Strategic network optimisation, including the number, location and size of warehouses, distribution centres and facilities.
Strategic partnership with suppliers, distributors, and customers, creating communication channels for critical information and operational
Introduction I Research Methodology I THEORETICAL FRAMEWORK I Company Description Empirical Data I Benchmarking I Analysis I References
20
improvements such as cross docking, direct shipping, and third-party logistics.
Information technology infrastructure to support supply chain operations. Aligning overall organisational strategy with supply strategy.
Tactical:
Sourcing contracts and other purchasing decisions.
Inventory decisions, including quantity, location, and quality of inventory. Transportation strategy, including frequency, routes, and contracting. Benchmarking of all operations against competitors and implementation of
best practices throughout the enterprise.
Operational:
Daily production and distribution planning, including all nodes in the supply chain.
Production scheduling for each manufacturing facility in the supply chain (minute by minute).
Demand planning and forecasting, coordinating the demand forecast of all customers and sharing the forecast with all suppliers.
Sourcing planning, including current inventory and forecast demand, in collaboration with all suppliers.
Inbound operations, including transportation from suppliers and receiving inventory.
3.4 Reverse Logistics VS. Green Logistics
Green logistics is defined as “efforts to measure and minimize the environmental impact of logistics activities” (Rogers et al. 2001). There are many activities to which both reverse logistic and green logistic can be applied. But there are also places where they differ.
Fig. 5. Comparison of Reverse Logistics and Green Logistics (source: Rogers et al. 2001). Reverse logistics is about how to manage the supply chain and economically gain more money for the company. The green logistic is about how to work with the environment and minimize the global environmental threats. Figure 1 above shows
Introduction I Research Methodology I THEORETICAL FRAMEWORK I Company Description Empirical Data I Benchmarking I Analysis I References
21
some activities that belong to the reverse logistic and some that belongs to green logistics and also some that belongs to both sides and are common for both.
Even though there are differences between green and reverse logistics, the two goes hand in hand in some parts. One reason for this is because a great driving force for implementing reverse logistic systems is often the motivation to save the environment, and to be part of a society that’s not wasting the earth’s resources (Andersson, 1995).
To take the environment under consideration when managing the company is not only a moral duty for the company but also a way to increase the profitability. According to Esty and Winston (2006) the companies that have considered the environment in their work have had stronger profitability during the last ten years. These companies tend to be more innovative and take more initiatives than their competitors. It also gives advantages like more loyal customers, the company is seen as more trustworthy and their trademark tend to be stronger. It is also stated that to do the right thing when it comes to the environment draws good co-workers to the company.
Remko (1999) states that green competitiveness may be based on:
Leveraging innovation. Design for disassembly for example, can be based on smart product connectors which are easier to (dis-)assemble, lowering assembly lead-times.
Cost-savings realized through resource savings. Using less fuel for example, by lowering trucking miles, not only lowers emissions but also saves on fuel expenses and drivers working hours.
The main activity that impacts on sustainable distribution and the environment must be the use of transports to move goods backwards up the chain (The Chartered Institute). Emissions from vehicles of CO2 are known to be a major contributor to green house gases leading to climate change.
Also the emissions of NO and CO contribute to the acidification of the
environment. The result is damage to buildings and property through acid rain.
The emissions from road vehicles can also have a negative impact on human health. Carbon monoxide for example has a direct affect on human health. Road deaths and accidents are also a social cost of transports.
3.5 Different places in the reverse supply chain
Although reverse logistic is often discussed as one type of system, the large scope of product properties and of structures gives a large variety of Reverse Logistics.
Introduction I Research Methodology I THEORETICAL FRAMEWORK I Company Description Empirical Data I Benchmarking I Analysis I References
22
There is not only the different kind of products that makes the reverse flow complex, there are also many different actors who use reverse logistics for many different reasons. However, one aspect is common for all reverse logistic systems, they have to be effective and efficient.
Reverse logistic is performed at a number of different places in the generic supply chain (Huge, 2002). For example, a product could be sent back from the end-customer to the dealer, and then the dealer could send it back to the producer. Each of the companies in the different positions has their own reverse logistic process.
It is not always the customers who request to send back the product. The request could as well come from someone further down the chain. The supplier could, for example be the one who wants the product back after the customer has used it. The first supplier could handle raw material that very easy is recycled or reused, and may strive to get as much as possible back in the reversed flow. Another scenario is that the producer could have as a service to its customer to take care of the product when it has been used, and have a policy to come and replace the product when the customer changes to a newer version. The product could then maybe be repaired, sold again or recycled.
The products also differ with respect to how they are brought to the recycler, and according to what principles. They could be brought by the end-customer either to a sales place, or to local collection places, from where it is collected and brought to the recycler. The recycler can collect the product directly from the end-user, or from local collection places.
There are many different scenarios, but it is clear that the initiative to the reverse flow could come from both upstream and downstream the supply chain.
3.6 Different reverse logistic flows
There are many reasons why the product is in the reverse logistic flow. Possible reasons are balance of stock, the product was not sold or its lifecycle ended. There are also seasonal products that are being returned when the season ends. There could also be environmental disposal reasons why the product is being returned.
Below are some of the most common reasons why the product is in the reverse flow described.
Warranty
In commercial and consumer transactions, a warranty is an obligation that an article or service sold is as factually stated or legally implied by the seller, and that often provides for a specific remedy such as repair or replacement in the event the
Introduction I Research Methodology I THEORETICAL FRAMEWORK I Company Description Empirical Data I Benchmarking I Analysis I References
23
article or service fails to meet the warranty. A breach of warranty occurs when the promise is broken, i.e., a product is defective or not as should be expected by a reasonable buyer (internet source 4).
Remanufacturing (reman)
When a product becomes defective, the question arises how to put it back into service. Repairing or remanufacturing will immediately be considered
(Steinhilper, 1998). Both processes achieve the same important result: they equally avoid the expenses of buying a new product as well as of disposing of the old one. The difference is that repairing more or less extends the useful life of a product while remanufacturing establishes its next full life cycle. Another distinction is that repaired products will return to its original owner, while
remanufactured products are anonymous and ownerless like new products before they enter their customer’s ownership.
Manufacturers sometimes see remanufactures as unpleasant competitors because remanufacturing a unit can avoid manufacturing a new one. That’s why
manufactures might be afraid of loosing some business if they are not remanufactures themselves.
Products of previous product generations, who have run out of production but still run in large quantities in the market and require maintenance can be taken cared of by remanufactures. That means that the manufacturers are not obligated to keep and run their production for old models (Steinhilper, 1998).
From a financial point of view the ability to refurbish the goods that are returned is very important since refurbishment allows additional cash recovery. Often are specialists from a third party refurbishment company used.
The old unit that becomes a reman is called a core (see vocabulary). A
remanufacture can get these cores directly from the customer or from specialized core brokers, who get their units from salvage yards or workshops.
When a product has newly entered the market there are none or very few cores available in the beginning. Cores are therefore rare and expensive in this first phase. Later in the products market cycle, as more and more products are being scrapped and the exchange business is running on a regular base, enough cores are in the pipeline and their price is becoming balanced. In the last phase until the end, when the products market presence is declining, an excess of cores is occurring, with their prices rapidly falling. There are several variables that influence the length and the characteristics if the core availability and value, like popularity of the product, years of original equipment, scrap rate of the product and