R
Statens vag- och trafikinstitut (VTI) - Fack - 581 01 Linkiiping
No. 117A - 1977
National Road & Traffic Research Institute - Fack - 581 01 Linképing - Sweden
Trials with Differentiated Speed
Limits during the Years 1968 1972
(abbreviated version of RAPPORT No. 88, 1976)
C O N T E N T S
Page
ABSTRACT I
1. BACKGROUND 1
2.
EFFECTS UPON ACCIDENTS
2.1 Injuries and damage resulting from
accidents
4
Types of accidents
12
Light conditions, day of the week
13
and season
2.4
Road width
15
3. EFFECTS ON SPEEDS 17
3.1
Infringements of speed limits
18
4. ECONOMIC ASPECTS OF TRANSPORT 19
REFERENCES 21
APPENDIX 1: Memorandum giving modified
norms for speeds higher than
the basic speed limit of
70 km/h
APPENDIX 2:
Speed limits in force outside
built up areas during the
ABSTRACT
Trials with speed limits differentiated according to
the standard of the roads have been run in Sweden
since 1968. In the course of these trials, the entire
road network has been regulated by speed limits indi
cated by road signs, with roads of good standard being
permitted higher speed limits than roads of poor stan
dard.
The speed limits tested on motorways are 130
and 110 km/h. On two-lane roads the speed limits
tes-ted were 110, 90 and 70 km/h.
The speed limits repre
sent maximum limits.
Concerning the total number of accidents each
reduc-tion in the speed limit has been found to be associa
ted with a reduction in the number of accidents asxmell
as a decrease in resultant injuries.
The change of the speed limit from 90 to 110 km/h on
two-lane road of very high standard has led to an
in-crease in the accident rate
number of accidents per
million axle-pair kilometre
with about 40 %.
Reduc-tion in the speed limit from 90 to 70 km/h has led to
a decrease in the accident rate corresponding to 22 %
and the reduction in the speed limit on motorways from
130 to 110 km/h has led to a decrease in the accident
rate with 30 %.
Speed measurements carried out in
con-nection with the various trials showed a reduction in
the speed limit of 20 km/h led to an average reduction in the speeds of 6 to 8 km/h.
BACKGROUND
Trials with speed limits differentiated according to
the standard of the roads have been run in Swedenxsfnce
1968. In the course of these trials, the entire road
network has been regulated by speed limits indicated
by road signs, with roads of good standard being
per-mitted higher speed limits than roads of poor standard.
The speed limits tested on motorways are 130 and 110
km/h.
On two-lane roads the speed limits tested were
110, 90 and 70 km/h.
The speed limits represent
maxi-mum limits.
Prior to the changeover to right-hand traffic in Sweden
in 1967, trials had been run to enforce speed limits
during weekend and holiday periods.
Unlimited speeds
were permitted in the intervening periods. A summary
of these trials has previously been presented in "The
Effects of Speed Limits Outside Urban Areas", Bulletin
No. 10, 1971, published by the National Swedish Council
of Road Safety Research.
However, the present report
covers only the trials with speed limits differentia
ted according to the standard of the roads run during
1968
1972.
At the request of the National Road Safety Office, the
National Swedish Road and Traffic Research Institute
has studied the effect On accidents and speeds ofciiffe
rent changes made in the speed limits applying to the rural road network according to the demands of the
va-rious trials.
The first trial was started on May 8,
1968 but was terminated on June 28 of the same year
owing to unfortunate developments in the accident trend
on roads where the speed limit had been set at 110 km/h.
The coverage of this road network was approximately
After reverting to general speed limits during the summer of 1968, a second trial was begun in September 1968 in which the total coverage of roads with a speed limit of 110 km/h was reduced to somewhat more than
2 000 kilometres.
In other respects the trial condi
tions complied with those applying during the firsttrial.
The second trial was terminated on April 30, 1970 and
a general speed limit of 90 km/h was again set for all
rural two lane roads. At the same time, the 130 km/h speed limit permissible on motorways was reduced to
110 km/h.
The third trial, which is still being run (1977),began
on June 1, 1971 and its import is that the basic speed
limit of 70 km/h has been introduced for the total ru
ral network.
Two lane roads of a very high standard
and with low traffic intensity, roads of good standard
and with very low traffic intensity in northern Sweden,
and motorways have been given a speed limit of 110 km/h.
Other roads of good standard and with a traffic
inten-sity that does not exceed certain annual daily traffic
have been given a speed limit of 90 km/h. Otherwise,
the 70 km/h speed limit is valid for the rest of the
rural road network. In this third trial, the criteria employed in setting speed limits are derived from data pertaining to road width and traffic volume obtained
from an inventory of the road network.
The results presented in this report cover the second
and third trials in which the accident trend following various changes made to the speed limit has been stu-died. In these investigations, the method used was to
study the same roads with respect to the accident trend
before and after the speed limit was altered.
In those
cases where it was possible, accident trends were also
studied during the corresponding periods on roads where
the speed limit remained unchanged, so called control
roads.
Using this procedure, the following speed limit changes were investigated.
a Unrestricted speed + 90 km/h (1)
e
Unrestricted speed
+ 110 km/h (2)
9 90 km/h +rllO km/h and, concurrently, roads with
unaltered speed limit of 90 km/h (3Ex and 3CX, res
pectively)e llO km/h + 90 km/h and, concurrently, roads with unaltered speed limit of 90 km/h (4E and 4C, respec tively)
o 90 km/h + 70 km/h and, concurrently, roads with
unaltered speed limit of 90 km/h (5E and 5C,
respec-tively)
0
90 km/h
+ 110 km/h on two-lane roads of very high
standard and low traffic intensity, and concurrent ly, roads of corresponding standard with unaltered
speed limit of 90 km/h (6E and 6C, respectively)
0 90 km/h + 110 km/h on two lane roads in northern Sweden with good standard and very low traffic in-tensity and, concurrently, roads of corresponding
standard with unaltered speed limit of 90 km/h (7E
and 7C respectively)
o 130 km/h + 110 km/h on motor-ways (8)
XE = Experimental roads for which the speed limit
was altered
xC Control roads for which the speed limit remai
ned unaltered
Table 1 shows the coverage with respect to length of the roads and time period studied during the different test periods, and also the changes in per cent in the number of accidents reported to the police.
\I TI I R A P P O R T 1 1 7 A
Table 1.
Trials with differentiated speed limits run during 1968-1972 and the effect upon the
number of traffic accidents.
SEQUENCE AND CHANGE INROAD CATEGORY SPEED LIMIT US=UNRESTRIC-TED SPEED ROAD COVE RACE IL] KII
PERIOD TYPE OI? CHANGE~ U 1
CHANGES IN I SLEED LIMIT
NO. OF
69 1970 I971
ACCIDENTS
IN PERCENT IN UN» 1972 REDUCED CREASED CHANGED
6K 7E 7K C D TWO-LANE ROADS US o 9O US pllO 90 +llO 90 * 9O llO >9O 90 * 9O 90- ->7O 90 >9O CO +IIO 90- *90 90 +llO 90 4>90 MOTORWAYS l30 *IIO 200 200 200 30
unrestricted -basic speed limit of »basic speed
li-mit of 70 km/h
I
I
I
I
I
I
I
w >4 0 + IThe studies performed within the framework of the
different trials dealt with the effects of the various
changes in speed limits in respect to the following
factors:
0 the total number of accidents in relation to
resul-tant injuries
0
type of accident
0 light conditions daylight and darkness
0
season of the year
a
day of the week
0
accident rate (number of accidents per million
axle-pair kilometre)
0
actual speeds
o
infringements of speed limits
EFFECTS UPON ACCIDENTS
Concerning the total number of accidents, each
reduc-tion in the speed limit has been found to be associa
ted with a reduction in the number of accidents as
well as a decrease in the severity of resultant
inju-ries.
The opposite effect was obtained when speed
li-mits were increased.
On roads where the speed limit
remained unchanged, it was not possible to establish
any definite differences in the number of accidents or
the extent of injuries. The changes in per cent in the total number of accidents are reported in the
following text.
In this respect it is not possible to
take into account increases in traffic volume
occur-ring between the before and after periods.
Using
available traffic data, the effect upon the accident
rate
the number of accidents per million axle-pair
kilometres
has also been calculated.
These values
are given in brackets after the change in per cent in the total number of accidents.
When the 90 and 110 km/h speed limits were introduced
instead of unrestricted speeds, the number of accidents
taking place on 90 km/h roads decreased by 9 % (acci
dent rate, decrease l6 %) whereas the number of
acci-dents occurring on 110 km/h roads increased by 7 %
(accident rate, decrease 4 %).
An increase in the speed limit from 90 to 110 km/h on
two-lane roads of very high standard and with low
traffic intensity has led to an increase in the number of accidents amounting to about 50 % (accident rate, increase more than 40 %), and on two-lane roads in
northern Sweden of good standard and with very low
traffic intensity an increase in the number of
acci-dents amounting to 10 % (accident rate, increase 6 %).
A reduction in the speed limit from 90 to 70 km/h has
led to a decrease in the number of accidents
corre-sponding to 18 % (accident rate, reduction 22 %),
while a reduction from 130 to 110 km/h on motor-ways
has given a reduction in the number of accidents
corresponding to 16 % (accident rate, reduction 30 %).
The difference in the change in per cent between the
number of accidents and the accident rate is a result
of the increase in traffic volume between the test
periods.
The control roads that were included in the different
trials also show that the unchanged 90 km/h speed
li-mit did not contribute towards any ascertained change in the number of accidents occurring during the trial
periods in any case whatsoever.
As the investigation
method is constructed on before and after-studies,
the results are liable to be affected by other
mea-sures designed to improve traffic safety.
The impli
cation of this is that the changes obtained are not entirely an effect deriving from changes made to speed limits. This is demonstrated partly by the results
obtained from the control road trials in which the
roads were studied with a View to elucidating the in
fluence of other factors and thereby comparing the
different trial periods.
Changes in the accident rate
found for the control roads studied were in no case
of the magnitude found for roads where the speed limit
was changed.
Table 2 shows the accident rates and the changes in
the accident rates found for each change in speed
.l
Table 2
Accident rate and change in accident rate
at different speed limits
CHANGE ACCIDENT RATE
IN
CHANGE IN
SPEED REFERENCE OBSERVATION ACCIDENT
LIMIT PERIOD PERIOD RATE IN %
FF4 90 (l)
0.51
0.43
l6
FF llO (2)
0.52
0.50
-
4
90 110 (3E)
0.32
0.46
+ 44
90
90 (3K)
0.37
0.41
+ ll
110
90 (4E)
0.45
0.32
30
90
90 (4K)
0.34
0.35
+
3
90
70 (SE)
0.69
0.54
22
90 90 (SK)
0.58
0.58
i 0
90 110 (6E)
0.36
0.38
+
6
90
90 (6K)
-
(4 5%)
90-llO (7E)
0.38
0.54
+ 42
90- 90 (7K)
0.57
0.52
-
9
130-110 (8)
0.58
0.40
31
Injuries and damage resulting from accidents
Table 3 shows the changes in per cent in the number of accidents involving injuries to persons and the number of accidents involving only damage to prOperty
recorded for the different follow-up sequences of
changes in speed limit.
E§§i§_§
Changes in per cent in the number of accin
dents resulting in personal injuries and
damage to prOperty in relation to the changes made in speed limit.
CEMKE HJPERCENT
gigggEilggT
ACCIDENTS WETH
ACCIDENTS WITH ONLY
IHHSGWMJINNEUES DNWKETKDPKEERPK
FF - 90 (1)
13.1X
7.4X
FF - 110 (2) + 9.5 + 6.690
110 (3E)
+ 46.9X
+ 55.2x
9O - 90 (BK) - 1.1 + 10.9110
90 (4E)
24.7X
26.8X
9O -
9O (4K)
+
7.5
+
7.9
90 n 70 (5E)
23.8X
15.3X
9O - 90 (SK) + 5.7 + 3.7 90 - 110 (6E) + 7.6 11.690
90 (6K)
90 - 110 (7B)
+ 46.5X
+ 48. X
90 - 9O (7K) - 5.1-13o - 110 (8)
16.6X
- 16.0X
X = The change per cent is significant at the 5 % level of significance.
In many cases,
roads have led to a greater reduction in the number of
accidents involving personal injuries than in the to
tal number of accidents.
been possible to elucidate the change in the numbers
of injuried persons and fatalities,
decreased speed limits on two lane
In such cases where it has
the change in per cent is greater than the applying to the number of accidents involving personal injuries, which illu
strates the effect of Speed limits in reducing damage.
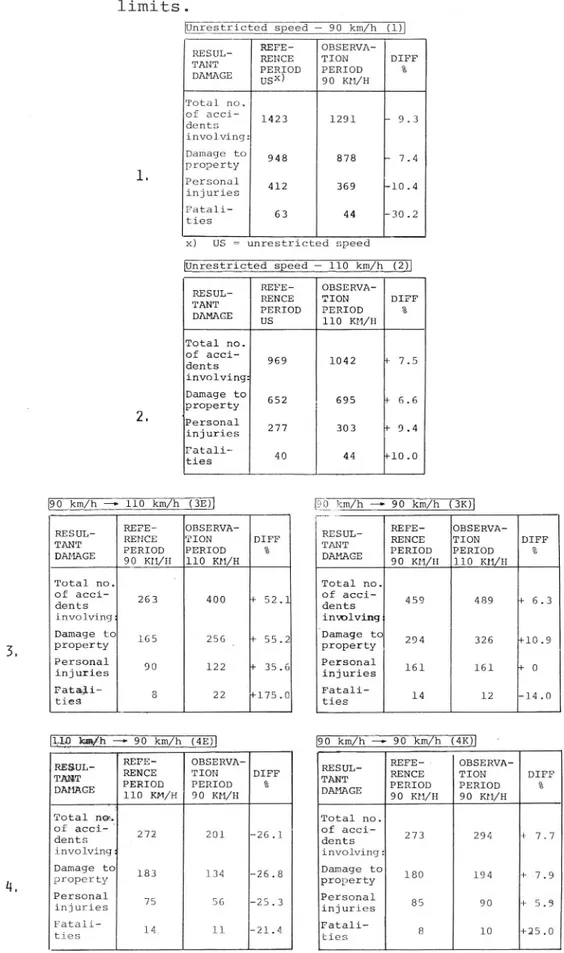
(See Table 4.)
1.0
Table 4. Number of accidents according to injuries and damage in relation to changes in Speed
limits. _
@nrestricted speed 90 km/h (1
REFE OBSERVA
§232L_ RENCE TION DIFF
DAMRGE PERIOD PERIOD %
' USX) 90 KM/H Total no. Of aCCl'dents 1423 1291 - 9.3 involving: Damage to 948 878 ~ 7.4 1 property
'
Pe?509al
injuries412
369
-10.4
Fétalities 63 44 ~30.2 x) US 2 unrestricted speed Enrestricted speed 110 km/h (Z REFEOBSERVA-giggL RENCE TION DIEE
DAMAGE PERIOD PERIOD %
" US 110 KM/H Total no. of acci-dents 969 1042 + 7.5 involving: Damage to property 652 695 + 6.6 2. PetsogalInjuries 277 303 + 9.4 Fatali~ ties 40 44 +10.0 [90 km/h + 110 km/h (3E p0 km/h + 90 km/h (3KH
REFEw OBSERVA REFE OBSERVA iiggL RENCE TION DIFF ii gL RENCE TION DIFF DAMAGE PERIOD PERIOD % DAMAGE PERIOD PERIOD %
90 KM/H 110 KM/H 90 KM/H 110 KM/H
Total no. ' Total no.
Of a001dents 263 400 + 52.1 dentsOf aCCl 459 489 + 6.3
involving: involving
Damage to 165 256 + 55.2 Damage to 294 326 410.9
3 property | property
Petsopalinjuries 90 122 + 35.6 PeFSOValinjuries 161 161 + 0 Fét ii"ties 8 22 +175.0 Fétalities 14 12 14.0
[rig km¢h + 90 km/h (4E) DO km/h + 90 km7H (4E3 , _ REFE OBSERVA- _ REFE ~ OBSERVA
iiggL RENCE TION DIFF iggL RENCE TION DIPE
DA AGE PERIOD PERIOD % DAMACE PERIOD PERIOD %
110 KM/H 90 KM/H 90 KM/H 90 KM/H
Total n@. Total no.
of acci-dents 272. 201 n26.1 of accidents 273 9 429 4 7.7_ involving: involving:
Damage to V . _ Damage to O
4 property 183 134 26.8 property 180 134 + 7.9
Petsodalinjuries 75 56 25.3 Petsotalinjuries 85 90 + 5.9 Eétall'ties 14. 11 -21.4 Fétall"ties 8 10 +25.0
VTI RAPPORT 117 A I90 km/h * 70.km?h (SEN
Jul
90 km/h + 90 km/h (sxREFE~ OBSERVA _ REPE OBSERVA
RESUL RENCE TION DIFF giggL RENCE TION DIFP
TANT PERIOD PERIOD 8 DAMAGE PERIOD PERIOD %
DAMAGE 90 KM/H 70 KM/H 90 KM/H 90 KM/H
Total no. Total no.
0f aCCldents 1856 1521 18.0 Of aC01'dents 1582 1651 +4.4
Involving: Involving:
only damage
to property1250
1059
15.3
only damage 1077
to property1117
+3.7
b
.85508a1
606
462
23.8
Pefsopal
505
534
+5.7
injuries: injuries: Number of Number of personal 965 6 _ Pe¥50¥al _ injuries 85 29.0 injurles 770 765 0.7 Number of Number of fatalities 80 46 42.5 fatalities 61 6O l.6 I90 km/h- + 110 km/h (6Ei] 90 km/h + 90 km/h (6KREFE OBSERVA REFE~ OBSERVA
giggL RENCE TION DIFF giEgL- RENCE TION DIFF
DAMAGE PERIOD PERIOD % DAMAGE PERIOD PERIOD %
9O KM/H 110 KM/H 90 KM/H 110 KM/H Total no. Total no.
gin::01' 165 181 + 9.7 gin::C1 1078 1081 +0.2
Involving: Involving:
Only damage 86 96 +11 6 Only damage » _ w to property ' to property Personal 79 85 + 7 6 Personal _ _ _ injuries: ' injuries: Number of Number of personal personal injuries 126 144 +l4-3 injuries Number of Number of fatalities l5 l3 -18_7 fatalities _ _ _ 90 km/h + 110 km/h (7E)! 90 km7h + 90 km/h (7K
REFE OBSERVA- REFE OBSERVA
giggL" RENCE TION DIFF giggL RENCE TION DIFF
DAMAGE PERIOD PERIOD % DAMAGE PERIOD PERIOD %
90 KM/H 110 KM/H ' 90 KM/H 9o KM/H
Total no. Total no.
of accidents 185 273 + 47.6 of acci-dents 305 291 4.6 Involving: Involving:
only damageto property 114 169 + 48.2 only damageto property 206 197 4.4
PeFSOPal
71
104
+ 46.5
59550831
99
94
5.1
injuries: injuries: Number if -Number of
Personainjuries 129 185 + 434 personalinjuries 171 155 _ 9.4
Numbe? 9f Number of
fatalities 7 14 +100.0 fatalities 19 14 -26.3
E30 km/h + 110 km/h (8H
I _ REFE OBSERVA
iiggL RENCE TION DIFF
DAMAGE PERIOD PERIOD %
130 KM/H 110 KM/H
Total no. of acci
dents 1136 952 16.2 Involving:
Only damaQEto property 751 631 316.0
8' 3e¥809al 385 321 -16.6 injuries: Number of personal 548 495 9.7 injuries Number of fatalities 32 28 -12.5
Types of accidents
l 2
Table 5 shows the change in per cent in the number
of accidents for different accident types from the
different follow-up sequences.
studied are:
The types of accidents
0 single vehicle accidents
multiple vehicle accidents (excluding accidents at
intersections)
accidents at intersections
other types of accidents
Table 5 Changes in per cent in the number of acci dents, in relation to type of accident
CHANGE IN CHANGE IN PER CENT
SPEED LIMIT
SINGLE MULTIPLE VEHICLE INTERSECTION OTHERS VEHICLE ACCIDENTS ACCIDENTS
ACCHENTS
us 90 (1)
15.5X
16
+ 2.7
- 18.4X
05 110 (2)
6.6
+ 19.3X
+ 26.0X
3.5
90 110 (3E)
+ 35.6X
+ 76.2X
+ 142.1X
+ 13.6
90 90 (3K)
+ 2.0
+ 32.1X
+ 59.2X
- 27.2
110 90 (4E) 90- 90 (4K)90 70 (5E)
19.7X
26. X
0.3
- 17.2X
90 90 (SK)
+ 3.3
- 5.8
+ 24.3X
9.0
90-110 (6E)
+ 55.0X
i 0
- 21.8
+ 17.1
90- 90 (6K) x x x 90-110 (7E) + 39.2 + 83.3 + 45.8 + 39.5 90 9O (7K) - 3.9 3.4 + l.l - 16.9 x x 130-110 (8) 19.4 18.2 + 5.2 - 20.3x = the change in per cent is significant at the 5 %
VTI RAPPORT 117 A
13
Taking into account the various roughcategories of accidents that were studied, no tendencies were found to indicate that any particular type of accident was affected more than any other. The effect on the
different types of accidents was largely in agreement with the effects found for the total number of
accidents.
Light conditions, day of the week and season
Table 6 gives the change in per cent in the number of accidents occurring during daylight or in darkness.
Table 6. Change in per cent in the number of accidents in relation to prevailing conditions oflight.
CHANGE IN
CHANGE IN PER CENT
SPEED
DAYLIGHT
DARKNESS
LIMIT
US
90(1)
14.8X
+
0.2
US
110(2)
6.2
+ 30.8X
90
llO(3E)
+ 41.9X
+ 100 X
90
90(3K)
: 0
+ 53.7X
11o -
90(4E)
27.7X
- 21.4
90
90(4K)
+ 5.5
+ 16.7
x = the change in per cent is significant at the 5 % level of significance.
It can be seen from the table that the changes in per
cent are larger during periods of darkness when the light condition parameter is applied to the follow-up sequences. In the tests in which control roads were included, however, the effect in relation to the changes in per cent found for the control roads
appears to be of the same magnitude for daylight as
for darkness.
14
Tables 7 and 8 show the changes in per cent occurring
in the number of accidents according to the weekday
(Monday Thursday) and weekend (Friday Sunday) during
the summer-period and winter period of the year.
Table 7.
Change in per cent in the number of
accidents according to day of the week.
CHANGE IN
CHANGE IN PER CENT
SPEED
MONDAY-THURSDAY FRUEWLQEHEX
LIMIT
wmmmmy
NEEEND
us
90 (1)
-
4.2
- 13.6X
US
110 (2)
+ 16.0X
+
0.4
X90
110 (3E)
+ 44.9
+ 58.8X
90
90 (3K)
+
6.3
+
6.8
110 - 90 (4E)
l6.l
33.1X
90 -
90 (4K)
+ 10.7
+
5.1
90
70 (5E)
13 X
- 22.7X
90
90 (SK)
+
8.0
+
0.6
90
110 (6E)
4
27.0
90 -
90 (6K)
90
110 (7E)
+ 44.6X
50.5
90
90 (7K)
9.7
+
1.4
130 - 110 (8)
18.5X
13.3
x = the change in per cent is significant at
the 5 % level of significance.
With respect to the day of the week - weekday or
weekend - the tendency throughout indicates that the changes made in the speed limits studied have the largest effect during the weekend.
Table 8.
15
Changes in per cent in the number of
acci-dents according to summer period and winter
period of the year.
CHANGE IN SUMMER WINTER
SPEED
LIMIT
April Sept
Oct March
90
70
(5E)
- 18.3X
17.8X
90
90
(SK)
- 2.0
+ 10.1X
9O
llO
(6E)
+
9.4
+ 10.0
90
9O
(6K)
-
_
x
x
90
llO
(7E)
+ 40.4
+ 56.8
90
9O
(7K)
+
0.7
9.3
x = the change in per cent is significant at the 5 % level of significance.
In the tests in which control roads were included, there were tendencies indicating that changes in the
speed limit
particularly a reduction from 90 km/h
to 70 km/h
had a greater effect during the winter
months of the year on the number of accidents than
during the summer months.
Road width
Table 9 shows the changes in per cent in the number
of accidents occurring during the various follow up
sequences, the road width parameter being taken into
account.
l6
Table 9. Changes in per cent in the number of
accidents in relation to the road width.
(Width in meters.)
CHANGE IN ROAD WIDTH
SPEED
LIDEPT
<< 6.0
6.0 6.9
7.0 8.0
9.0-ll.0 i>ll.0
US - 9O (1)
- 17.8
+ 22.1
+ 5.8
US 110 (2) I
+ 18.3
+ 12.0
90
110 (3E)
+ 70.0
+ 55.1
90 - 90 (3K)
+ 11.9
+ 14.7
+ 26.8
110 - 90 (4E)
20.3
27.4
90 - 90 (4K)
+ 9.3
+ 39.0
11.9
+
4.7
90
70 (5E)
17.4
-l7.l
- 19.8
90
90 (BK)
+ 6.5
+ 1.8
With respect
performed do
to the width of the road, the trials
not provide sufficient information upon
which to base estimations of the effect on accidents
uidifferent road widths and different speed limits.
l7
EFFECTS ON SPEEDS
Speed measurements carried out in connection with the
various trials showed that a reduction in the speed limit of 20 km/h led to an average reduction in the mean speeds of 6 8 km/h. This means that the lower
the speed limit, the greater the number of drivers
who exceed the speed limit.
gable 10. Mean speeds at different speed limits for
different road widths.
ROAD
VEHICLE
MEAN SPEEDS (KM/H)
WIDTH
CATEGORY
AT SPEED LIMIT
(M)
90 KM/H
1
110 KM/H
7.0 13.0
FC X)
84.6
91.8
FC + T
82.0
87.8
90 KM/H
70 KM/
13)
2X)
3 X)
Fc
84.5
76.6 72.0 76.1
7.0 9.0
Lb
71.4
69.4 70.0 70.8
Pb + Lb
83.0
75.6 71.9 75.4
Pb
81.0
74.5
6.0-7.0
Lb
70.0
68.0
Pb + Lb
78.7
73.6
Pb
78.5
73.2* 71.5 72.7
6.0
Pb + Lb
76.0
71.5* 71.2 71.7
x) PC = Family cars, T = trucks
x) Speeds measured on three different occasions
The results are based on randomly chosen points of time and place with respect to the comparison between
the 90 and 110 km/h speed limits, and on randcmly
chosen points of place with respect to changes in
18
Speed limits when the basic limit of 70 km/h was
introduced.
Infringements of speed limits
On roads for which the speed limit was lowered from
110 km/h to 90 km/h the frequency of infringements
has increased by about 15 %, whereas a lowering of the
90 km/h limit to 70 km/h gave
rise to an increased
frequency of infringements of about 40 %. At the same time, however, it is important to note that, at
the 70 km/h speed limit, about 25 % of the drivers,
drove faster than 80 km/h and at the 90 km/h speed limit, about 10
100 km/h.
o\
0
of the drivers drove faster than
Figure 1 illustrates the infringements of speed limit at various speed limits.
Frequency of infringements of speed limit
80_.SL
7O 8O 90 100 110
Figure l. The frequency of infringements of speed
limits as a function of the speed limit (SL)
and the speed limit + 10 km/h (SL + 10).
l9
ECONOMIC ASPECTS OF TRANSPORT
An economic evaluation of transport presented in the form of a calculation example in which the costs of accidents, vehicles and time are taken into account, shows that the trials carried out with a speed limit of 70 km/h led to an increase in the economic costs
of transport in comparison with the 90 km/h speed
limit.
Trials with the speed limit set at 110 km/h
give the same increase in transport economic costs as the 90 km/h limit.
The values attributed to accidents, travel times and vehicle costs have been taken from the report:
"Profitability estimations of road projects", National Swedish Road Administration DA 121, i.e. the values applied in the road construction sector. These values are for the year of 1973.
Sw. Crs.
80 000: / traffic accident reported
to the police
Sw. Crs. lS:-/h/family car.
The vehicle cost has been calculated from the follo~
wing regression relationship which has been taken
from the report mentioned above.
No of Sw. Crs. per km per family car = 0.0027v + 0.0002 v2, where v is the speed of the vehicle.
20
SPEED LIMIT REDUCED FROM 90 KM/H TO 70 KM/H
transport economy
Reduction inIncreased epuction in Reduction in
speed travel 'vehicle costs accident rate
time
km/h
sec/km
Sw Crs/km
6 4 0.002 0.15
Accident cost
ml2 000 Sw Crs per million
reduction vehicle kilometres
Vehicle cost m 2 000 Sw Crs per million
reduction vehicle kilometres
Time cost ml6 700 Sw Crs per million
increase vehicle kilometres
Change in
+ 2 700 SW Crs per million
vehicle kilometres
SPEED LIMIT INCREASED FROM 90 KM/H TO 110 KM/H
transport economy
Reduction inlkmnxxuxxiReduction in
Reduction in
speed travel vehicLecosts accident rate
time
km/h sec/km Sw Crs/km
6
3
0.004
0.14
Accident cost mll 200 Sw Crs per million
increase vehicle kilometres
Vehicle cost
% 4 400 SW Crs per million
increase vehicle kilometres
Time cost
W12 500 Sw Crs per million
reduction vehicle kilometres
Change in
+ 2 700 Sw Crs per million
vehicle kilometres
21
R E F E R E N C E S
(Articles written in Swedish, with titles translated into English)
(1)
(3)
(4)
(5)
(6)
Nilsson G and Roosmark P O
Differentiated general speed limits.
Parts 1.1
and 1.2.
The effect on traffic accidents.
VTI (SVI), Special report No. 90, 1970
Edholm S, Kolsrud B and 6stman C
Differentiated general limits. Part 2.
The adjustment of drivers to speed.
VTI (SVI), Special report No. 90, 1970
Nilsson G and Roosmark P-O
A comparison between the speed limits of 110 km/h
(Spring 1969) and 90 km/h (Spring 1970).
VTI (SVI), Preliminary report No. 91, 1970
Carlsson G and Gberg G
Follow-up speed study of the 70 km/h speed limit
during the summer (6 months) of 1971.
VTI, Report No. 12, 1973
Nilsson G and Roosmark P O
The effect on traffic accidents of the 70 km/h
speed limit.
VTI, Report No. 24, 1973 Andersson B-M and Nilsson G
The effect of speed limits on traffic accidents.
A comparison between the speed limits 130 and
110 km/h on motor-ways, and the speed limits 90
and 110 km/h on two-lane roads.
Criteria for higher speed limit
limit 70 km/h.
Appendix 1
than basic speed
Road category l. Motorway Road'width Roads in norther sweden VTI RAPPORT /
12
I A I v ox <m C) C) I V }_1 O C I V U! C)117 IX
\0Speed
limit
km/h
110
Annual daily traffic
(ADT 1969)
f 3 000
110
f l 500
110
f l 000
110
f
800
110
5
250
110
90
f 7 000
90
f 6 000
90
i 5 000
90
E 3 000
90
(gravel) : l 000 90f
500
90
f
300
90
f
200
90
Appendix 2
p. 1(2)
Speed limits in force outside built-up areas during
the years 1960-1976.
Speed limit
Time22 dec 1960 - 9 jan 1961
80
90
100
29 march - 5 april 1961 9019 may - 24 may 1961
90
22 june - 12 july 1961
90
1 sept
11 sept 1961
90
22 dec 1961 - 8 jan 1962
80
18 april - 2 may 1962
100
8 june 25 june 1962 9013 july - 31 july 1962
90
17 aug - 3 sept 1962
100
Zlébc 1962 - 7 jan 1963
80
10 april
17 april 1963
90
31 may
3 june 1963
90
20 june - 23 june 1963
90
every week-end (friday sunday)
during the period
28 june - 4 aug 1963 90