Swedish National Road and Transport Research Institute www.vti.se
The influence of individual characteristics and institutional
norms on bureaucrats’ use of CBA in environmental policy: a
model and a choice experiment
VTI Working Paper 2019:6
Johanna Jussila Hammes,
Transport Economics, VTI, Swedish National Road and Transport Research InstituteLena Nerhagen
, Dalarna UniversityHeather Congdon Fors
, University of GothenburgAbstract
Social scientists regularly criticize the use of cost-benefit analysis (CBA), which has led to much focus being placed on investigating the possible biases related to its results. Recent research shows that CBA is not routinely done prior to environmental, energy, and climate policymaking in Sweden, and in countries where a CBA is made, the results have little influence on political decisions. This paper investigates obstacles to using CBA information with a focus on bureaucrats. We use empirical data from Sweden, where the ministries are small by international standards and hence government agencies have a sizeable influence on policymaking.
We construct a theoretical model and then test the theoretical predictions with empirical data collected from five Swedish government agencies. The empirical results lend support both for the assertion that risk aversion concerning the environmental outcome, the bureaucrats’ environmental attitudes, and the cost of taking CBA information into account have a considerable impact on the probability of using information from a CBA. Hence risk averse and bureaucrats with strong environmental preferences are less likely and bureaucrats with low cost of doing a CBA more likely than other bureaucrats to use CBA information. Finally, a binding governmental budget constraint may positively influence a bureaucrat’s choice of undertaking a CBA. A tentative conclusion is therefore that it may be possible to increase the use of CBA by making the budgetary consequences of policies much clearer and demanding due consideration of costs.
Keywords
Bureaucrats; Cost-Benefit Analysis; Delegation; Environmental Policy; Environmental Preferences; Risk Aversion/Neutral/Loving
JEL Codes D61; D73; H41
1
The influence of individual characteristics and institutional norms on bureaucrats’ use of
CBA in environmental policy: a model and a choice experiment
Authors: Johanna Jussila Hammesa, Lena Nerhagena, Heather Congdon Forsb
a Swedish National Road and Transport Research Institute, VTI; Box 55685; 102 15 Stockholm,
Sweden. E-mail: Johanna.jussila.hammes@vti.se; lena.nerhagen@vti.se b Department of Economics, University of Gothenburg.
Abstract: Social scientists regularly criticize the use of cost-benefit analysis (CBA), which has led to
much focus being placed on investigating the possible biases related to its results. Recent research shows that CBA is not routinely done prior to environmental, energy, and climate policymaking in Sweden, and in countries where a CBA is made, the results have little influence on political decisions. This paper investigates obstacles to using CBA information with a focus on bureaucrats. We use empirical data from Sweden, where the ministries are small by international standards and hence government agencies have a sizeable influence on policymaking.
We construct a theoretical model and then test the theoretical predictions with empirical data collected from five Swedish government agencies. The empirical results lend support both for the assertion that risk aversion concerning the environmental outcome, the bureaucrats’ environmental attitudes, and the cost of taking CBA information into account have a considerable impact on the probability of using information from a CBA. Hence risk averse and bureaucrats with strong environmental preferences are less likely and bureaucrats with low cost of doing a CBA more likely than other bureaucrats to use CBA information. Finally, a binding governmental budget constraint may positively influence a bureaucrat’s choice of undertaking a CBA. A tentative conclusion is therefore that it may be possible to increase the use of CBA by making the budgetary consequences of policies much clearer and demanding due consideration of costs.
2
Keywords: Bureaucrats; Cost-Benefit Analysis; Delegation; Environmental Policy; Environmental
Preferences; Risk Aversion/Neutral/Loving
JEL codes: D61; D73; H41 This version: Aug 14, 2019
Acknowledgements: The first author thanks Amihai Glazer for inspiring the theoretical part of the
paper. The authors thank Anders Lewald for help with formulating the decision-making questions in the questionnaire, Gunilla Björklund and Jan-Erik Swärdh for useful comments in conjunction with a methodology seminar, and Per Henriksson for help with administering the questionnaire. We also thank Mattias Haraldsson, Klaus Hammes, and the participants at the WCERE conference in
Gothenburg on June 27th, 2018 for very helpful comments. The research was funded by the Swedish Energy Agency.
3
1. Introduction
While doing a cost-benefit analysis (CBA) prior to regulation has been standard procedure in the United States at least since the 1980s,1 in many other countries, politicians and (certain) bureaucrats express distrust in CBAs (see Mouter et al., 2013, for a case study of the Netherlands; anecdotal evidence indicates similar attitudes at least in Sweden, Finland, and Australia). However, the use of CBA creates “a reasonably clear standard tied to individual preferences that can make special interest deals harder to accomplish without tying the hands of the state” (Rose-Ackerman, 2007, p. 23). Rose-Ackerman describes CBA, risk assessment, and cost-effectiveness analyses as
“universalizing techniques that cut across substantive fields and provide a way to compare programs and allocate funds using uniform criteria” (2007, p. 12).2 She also notes that these methods are superior to, e.g., the precautionary principle, as this principle is not defined clearly enough to provide realistic policy guidance. Sunstein (2017) makes an argument for doing CBA prior to decision-making in terms of “thinking slow” (see also Kahneman, 2011), i.e., that a CBA reduces at least two common fallacies of thinking, namely the framing effect and loss aversion. The OECD has been recommending the use of CBA at least since 2012 (OECD, 2012). The question that arises is why some bureaucrats feel so negative about CBAs and are so unlikely to perform them and use the information they yield. In Sweden, where the empirical data used in the present study was gathered, the bureaucrats working at government agencies or serving on committees of inquiry are the ones tasked with finding information about the impact of policies. Numerous Swedish studies indicate that CBA is rarely done prior to the launching of environmental, energy, and climate policies (Samakovlis & Vredin Johansson, 2005; 2007; Pyddoke & Nerhagen, 2010; Broberg, Samakovlis, & Forslund, 2010;
1 For a history of the use of CBA in the US, see Enthoven (2019).
2 We will in the following talk about a CBA. We use this term comprehensibly, and it should be thought to
encompass all the universalizing techniques that Rose-Ackerman (2007) and Enthoven (2019) mention and even a regulatory impact assessment.
4 Forsstedt & Nerhagen, 2016; Nerhagen & Forsstedt, 2016). Typical reasons given for this include policymaking traditions and the fact that legal requirements pertaining to regulatory impact assessments focus on budgetary consequences for the state and on reducing the administrative burden for enterprises. Besides, the main principle that has guided environmental policy in Sweden for over 20 years has been the precautionary principle (Nerhagen, Forsstedt, & Edvardsson, 2017; Hansson & Nerhagen, 2019). In Swedish policymaking, CBA is only standard procedure when determining the prices and subsidies paid for medicines, and when transport infrastructure projects are chosen (Hultkrantz (2009).3 The question that arises is, what motivates a bureaucrat to do or use information from a CBA in the absence of explicit political requirements?4
The present paper focuses on the question of what influences a bureaucrat’s decision to do or use information from an existing CBA. Bureaucratic decision-making has often been studied using delegation models (for an overview, see Bendor et al., 2001). The delegation model -literature deals with the circumstances under which decision-making power is delegated from a principal (e.g., a parliament or congress, a chief, etc.) to an agent (an agency, a bureaucrat, an employee, etc.) (Bendor & Meirowitz, 2004). For example, Alesina and Tabellini (2007; 2008) study the normative criteria used for allocating policy tasks to elected policymakers (politicians) or non-elected bureaucrats. They show that it is preferable to allocate a policy task to a bureaucrat if time inconsistency and short-termism is an issue, or if vested interests have large stakes in the policy
3 For a recent assessment of the use of CBA in European policymaking, see Andersson (2018).
4 The present paper does not consider politicians, nor does it explain how or why the bureaucrat has the power
to influence the policy choice. We assume that somebody has delegated this power to the bureaucrat, who in turn will have to choose between making the decision under uncertainty or finding out more information about possible consequences of the proposed decision. The reason for this assumption is that the governance system is decentralized in Sweden and ministerial rule of bureaucrats explicitly forbidden.
5 outcome. Nevertheless, a bureaucrat can very well choose to ignore the socially optimal policy according to Alesina and Tabellini.5
In the present paper, we build on the tradition of delegation models in order to explain why
bureaucrats may or may not be interested in “delegating” power over policy proposals to a CBA. Our model assumes that if a bureaucrat searches for more information (i.e., carries out/uses information from a CBA), they will have to make a decision that results in a socially optimal policy being
implemented rather than their own ideal policy.6 If, however, they do not search for information, they can choose whichever policy they desire but cannot be certain about the outcome of that policy. The model results in four hypotheses about the influences of risk aversion, policy preferences, the cost of carrying out a CBA, and the influence of a binding budget constraint on the likelihood of using information from a CBA. We test the hypotheses using data collected from bureaucrats
working for one of five Swedish government agencies: the Swedish Environmental Protection Agency
5 According to empirical evidence, the same can be said about the politicians, too. Thus, e.g., Nilsson (1991),
Nyborg (1998), Sager and Ravlum (2005), Eliasson and Lundberg (2012), Mouter, Annema and van Wee (2013; 2015), and Mouter (2016) show that politicians, while demanding that the bureaucrats conduct CBAs, do not end up using the results when making decisions. Iaryczower et al. (2013) conduct an empirical study of elected versus appointed bureaucrats (in their case, state supreme court judges in the US) and find that non-elected bureaucrats on average have better information, are more likely to change their preconceived opinions about a case and are more effective (make fewer mistakes) than their elected counterparts (politicians). Their results therefore counter the theory-based claim by Alesina and Tabellini (2008), but support the findings of the large literature showing politicians’ disregard for CBA results.
6 The bureaucrat’s preferred point could be their private preference. However, e.g., Eggert et al. (2016) show
that a person, who thinks they are acting in the capacity of a representative for the entire society, can choose differently from their private preferences. The bureaucrat’s preferences can also represent their social preferences. Finally, the bureaucrat may act out of a professional norm that they have internalized during education or over the course of their professional life.
6 (SEPA), the Swedish Energy Agency (SEA), the Swedish Transport Administration (STAdmin), the Swedish Transport Agency (STAgency), and Transport Analysis (Trafa), respectively. The empirical analysis is based on responses from 439 bureaucrats.
The paper is organized as follows: In the next section, we construct a model of delegation by a bureaucrat to a CBA. In Section 3, we describe the questionnaire and the data collected. Section 4 presents results both from non-parametric and parametric analyses based on the hypotheses formulated in the theoretical part of the paper. Section 5 summarizes the results and concludes the article.
2. The model
2.1. The economy, the bureaucrat, and incentives to do a CBA
The model in this section is an application of the model of delegation developed by Bendor and Meirowitz (2004). Consider an economy consisting of 𝐻 individuals denoted by superscript ℎ = {1,2, … , 𝐻}. Assume also a finite set, {1, … , 𝐽}, 1 ≤ 𝐽 ≪ 𝐻 of bureaucrats. Besides utility from private goods, individuals derive utility from a non-rival and non-excludable public policy outcome, 𝑔 ∈ 𝐺. Utility derived from the public policy outcome is given by a function 𝑞ℎ(𝑔), 𝑞ℎ being increasing and concave in 𝑔, i.e., 𝑞𝑔ℎ> 0, 𝑞𝑔𝑔ℎ ≤ 0, the subscripts denoting differentials. The preferences for the public policy outcome are continuously distributed with mean 𝜇𝑔 and variance 𝜎𝑔2. We denote the socially optimal level of the policy outcome by 𝑔∗.
An individual bureaucrat 𝑗 ∈ {1, … , 𝐽} has a unique preference point for the public policy outcome, denoted by 𝑔𝑗 ∈ 𝐺. We assume that the bureaucrat always prefers a higher level of the public policy outcome than the socially optimal one, i.e., 𝑔𝑗> 𝑔∗.7
7 This assumption may seem restrictive. However, a single individual’s choice of a public policy outcome will
7 A particular policy is given by 𝑝 ∈ 𝑃, the policy being for example a carbon tax, an emissions trading system, a low carbon fuel standard, or a bonus-malus system for low emission vehicles. The policy is perturbed by a random shock (𝜖). The shock reflects society’s response to a given policy, which is not known in advance. For example, the price elasticity of fuel demand could be much lower (or higher) than believed. We assume that the shock is symmetrically distributed with a mean of zero, 𝜖̅ = 0, and a variance of 𝜎𝜖2, and that the influence of the shock is linear, so that 𝑔 = 𝑝 + 𝜖. The outcome 𝑔 is then a random variable that depends on policy, so that the cumulative distribution function of 𝑔 given policy 𝑝 is 𝐹(𝑔|𝑝). 𝑔 reflects the attainment of policy goals, e.g., the Paris Agreement target of no more than 2⁰C average global warming or the Swedish goal of reducing greenhouse gas (GHG) emissions from the transport sector by 70% compared with 2010 values by 2030.
Given uncertainty about the mapping from policies to outcomes, each bureaucrat has an optimal policy. The bureaucrat can, if they so choose, inform themselves about the mapping from policy to outcome, i.e., they can learn the value of the shock. This requires effort, however. The cost of effort is denoted by 𝑐𝑗, with the cost increasing in effort. The greater the effort, the more likely the
bureaucrat is to find the value of the shock, 𝜖. In practice, the cost of effort can be seen as the cost of performing a CBA or taking in and using information from one. Moreover, knowing the perturbation
The probability of this occurring is zero. The level of the policy outcome then either falls short of or exceeds the social optimum. If the bureaucrat does not conduct a CBA, the costs of the policy may be underestimated, two recent examples being the Government Official Reports that set out a strategy for Swedish climate policy (Miljömålsberedningen, 2016:21) and for climate and clean air (Miljömålsberedningen, 2016.:47). If the costs are underestimated, then even a bureaucrat with lower-than-the-population-average preferences for the policy outcome may choose a level of policy that exceeds the social optimum. As is shown by Uba (2010), Swedish bureaucrats tend to prefer quite environmentally friendly policies. Carlsson et al. (2011) and Eggert et al. (2016) conduct empirical studies that show that the bureaucrats at the Swedish Environmental Protection Agency on average prefer policies that are more ambitious than those preferred by the general public.
8 (𝜖) permits complete “shock absorption”; if a decision-maker chooses a policy (𝑝) after they observe the disturbance (𝜖), they can always find a policy that, when combined with the shock, yields any desired (feasible) outcome (𝑔) (Bendor & Meirowitz, 2004, p. 298). We can define the shock as a function of the cost of effort, 𝜖(𝑐𝑗), with 𝜖𝑐(𝑐𝑗) < 0 if 𝜖 > 0 (𝜖𝑐(𝑐𝑗) > 0 if 𝜖 < 0), i.e., the impact of the shock on the outcome approaches zero as the cost of effort increases. Furthermore, there exists some maximum level of effort, 𝑐𝑚𝑎𝑥, such that 𝜖(𝑐𝑚𝑎𝑥) = 0, i.e., that given enough effort, the true value of the shock can be found.
The extensive form of the game is then as follows: A bureaucrat has the authority to propose policy 𝑝.8 Before making their proposal, they decide whether to do/use information from a CBA or not. The bureaucrat consequently faces the following problem: They prefer outcome 𝑔𝑗 > 𝑔∗ but cannot reach that outcome with certainty due to the shock. In the absence of a CBA, they choose policy to maximize their expected utility, given their expectations of the cumulative distribution of outcomes, 𝐹(𝑔|𝑝). Because the bureaucrat’s preferences are strictly single-peaked and because 𝐹(𝑔|𝑝) is nondegenerate for all 𝑝, the expected utility of the bureaucrat is strictly less than the utility obtained by getting the ideal outcome with certainty.
Because utility varies continuously in outcomes, the bureaucrat has certainty equivalents (CE) in outcome space. The CE form a set of outcomes such that the bureaucrat would be indifferent between getting any such outcome for sure and taking a policy that maximized their expected utility.9 This set of certainty equivalents defines the bureaucrat’s CBA set (the CBA set corresponds to the delegation set in Bendor and Meirowitz, 2004, p. 299). It defines the bureaucrat’s propensity to
8 The bureaucrat proposes policy. This does not necessarily mean that the politicians will adopt the proposed
policy. Modelling political decision-making is beyond the scope of this paper.
9 Jehle and Reny (1998, pp. 208-209) define the certainty equivalent as the amount of wealth we could offer an
individual with certainty that would make them indifferent between accepting that wealth with certainty and facing a gamble 𝑘 offering 𝑤𝑖 with probability 𝑝𝑖, the expected value of the gamble being 𝐸(𝑘) = ∑𝑛𝑖=1𝑝𝑖𝑤𝑖.
9 do/use information from a CBA; the larger the CBA set, the more likely a bureaucrat is to carry out a CBA. We examine the determinants of the CE in the next proposition:
Proposition 1. Of two bureaucrats, the one with a higher Arrow-Pratt measure of risk aversion has a higher risk premium than the one with a lower measure.
Proof: The proof of the risk premium being higher for a more risk-averse bureaucrat, i.e., the one with a higher Arrow-Pratt measure, than that for a less risk-averse one follows Jehle and Reny (1998, pp. 208-211) and will not be repeated. ∎
The result in Proposition 1 is ambiguous, however. What is the bureaucrat risk averse toward – the CBA outcome or the environmental outcome? This cannot be determined on theoretical grounds. Therefore, we formulate two alternative hypotheses that we can test empirically:
Hypothesis 1. A more risk-averse bureaucrat is afraid of getting a policy outcome far from the social optimum. Therefore, a more risk-averse bureaucrat has a larger CBA set than a risk-neutral/loving one.
Hypothesis 2. A more risk-averse bureaucrat is afraid of not reaching the environmental goal. Therefore, a more risk-averse bureaucrat has a smaller CBA set than a risk-neutral/loving one.
Turning to the question of the impact of attitudes on the choice of policy, consider a bureaucrat who must make a proposition for a public policy, 𝑝, which together with the shock, 𝜖(𝑐𝑗), determines the outcome of the public policy, 𝑔. Considering a discrete problem, the probability of 𝜖 taking any given value is 𝜋𝑖, 𝑖 ∈ {1, … , 𝑛}. The bureaucrat’s problem is to choose the effort cost to maximize the expected utility from 𝑔:
(1) max 𝑔𝑗 ∑ 𝜋𝑖𝑞 𝑗(𝑝 + 𝜖(𝑐𝑗)) 𝑛 𝑖=1 , 𝑠. 𝑡. 0 ≤ 𝑐𝑗≤ 𝐶,
10 What happens to the effort put into finding the value of the shock as the bureaucrat’s policy
preference, 𝑝, increases? We formulate the following proposition:
Proposition 2. If bureaucrats i has a higher preference for the policy outcome than bureaucrat j, i.e., 𝑔𝑖 > 𝑔𝑗, bureaucrat i will be less likely to do a CBA than bureaucrat j.
Proof: We prove Proposition 2 by totally differentiating (1) with respect to (w.r.t.) 𝑝 and 𝑐𝑖 and rearranging. We find 𝑑𝑐𝑖 𝑑𝑝 = − ∑𝑛𝑘=1𝜋𝑘𝑞𝑔𝑖 (𝑝 + 𝜖(𝑐𝑖)) ∑𝑛𝑘=1𝜋𝑘𝑞𝑔𝑖(𝑝 + 𝜖𝑐(𝑐𝑖)) < 0. ∎
Thus, as 𝑝 increases, the cost of effort, and consequently the effort put into finding 𝜖, falls.
Therefore, a bureaucrat with higher preferences regarding the public policy outcome is less likely to put more effort into finding out the true value of 𝜖, i.e., they are less likely to do a CBA than
bureaucrats with less extreme preferences.
However, how the situation is perceived is also related to education and experience. With little experience with CBAs, a bureaucrat may perceive that the CBA does not reveal all necessary
information about the shock. This case is analogous to that of informationally imperfect agents in the model of Bendor and Meirowitz (2004, p. 300). Thus, even if the bureaucrat does a CBA, it is possible that they will have to make an uninformed decision. This puts them in the worst of all possible worlds: There is policy bias but no compensating adaptation of the policy to the state of the world. Thus, assume that with probability 𝜌𝑗 the CBA reveals the true state of nature, the probability of the state of nature remaining unknown being (1 − 𝜌𝑗). Hence, the expected value of doing a CBA increases in the bureaucrat’s own competence, measured by 𝜌𝑗. As 𝜌𝑗 falls, the CBA set contracts. We formulate the following proposition:
11 To illustrate Proposition 3, assume that with full certainty (𝜌𝑗 = 0), the expected CBA result equals the bureaucrat’s certainty equivalent, i.e., the bureaucrat is indifferent between doing a CBA or not. Now introduce uncertainty about whether the CBA will reveal the true value of the shock or not. The value of the CBA is reduced by uncertainty. This means that the expected value of the CBA falls outside the bureaucrat’s CBA set and the bureaucrat under uncertainty is not willing to do a CBA. We summarize the findings from Hypotheses 1, and 2, and Propositions 2, and 3 regarding the size of the CBA set in Table 1. A minus sign in Table 1 indicates that a bureaucrat with that particular
property has a smaller CBA set and a plus sign that the CBA set is larger, the first sign referring to the individual’s risk aversion, the second to their policy preferences, and the third to the level of
uncertainty about CBA results.
Table 1 The impact of risk preferences (Hypotheses 1 and 2, first sign), policy preferences (Proposition 2, second sign) and the uncertainty about CBA results (Proposition 3, third sign) on the CBA set. A minus sign indicates a smaller CBA set; a plus sign a larger one.
HIGH POLICY PREFERENCE LOW POLICY PREFERENCE
Low uncertainty High uncertainty Low uncertainty High uncertainty RISK AVERSE W.R.T. CBA +, -, + +, -, - +, +, + +, +, - RISK NEUTRAL/LOVING W.R.T. CBA -, -, + -, -, - -, +, + -, +, - RISK AVERSE W.R.T. POLICY OUTCOME -, -, + -, -, - -, +, + -, +, - RISK NEUTRAL/LOVING W.R.T. POLICY OUTCOME +, -, + +, -, - +, +, + +, +, -
Two unambiguous cases arise in Table 1 for Hypothesis 1 and Hypothesis 2, respectively. The bureaucrat who is risk averse with respect to the CBA outcome (Hypothesis 1), who has low policy
12 preferences (Proposition 2), and low uncertainty about the CBA results (low cost of carrying out a CBA, Proposition 3) is the most likely to use information from a CBA, i.e., they have the largest CBA set. The bureaucrat who is risk-neutral/loving with regard to the CBA outcome, with high policy preferences, and high uncertainty about the CBA results (high cost of carrying out a CBA) has the smallest CBA set.
On the other hand, a bureaucrat who is risk averse with respect to the environmental outcome (Hypothesis 2), who has high policy preferences (Proposition 2), and who experiences high
uncertainty about the CBA results (Proposition 3) has the smallest CBA set, while the corresponding risk-neutral/loving bureaucrat with low policy preferences and with low uncertainty about the CBA results has the largest set. All the other cases are of indeterminate size.
2.2. The influence of institutional norms on the use of CBA
In addition to the influence of individual characteristics, institutional norms may influence bureaucrats’ behavior and their search for information. An important norm of this type is the requirement that government agencies have to consider the implications of a regulation on the government’s budget. Jussila Hammes (2017) argues that one difference between government agencies that regularly conduct CBAs and those that do not, is that the former seem to be acting under a governmental budget constraint while the latter do not. A governmental budget constraint can, when binding, impose an upper limit on the supply of public goods. It may then be impossible for a bureaucrat to reach their ideal point. If, however, the bureaucrat, by doing a CBA, can get the government to relax the budget constraint, they may have an incentive to do so.
Consequently, if the governmental budget constraint limits the supply of the public good to a level below the bureaucrat’s CBA set, the incentives to do a CBA depend on the bureaucrat’s expectations about the social optimum. An expected social optimum that corresponds to the budget constraint will not induce them to do a CBA. If, however, the CBA results likely lie closer to the bureaucrat’s ideal point, they will do a CBA. The bureaucrat’s CBA set may consequently increase in this case. This
13 is because the social optimum, though non-desirable for the bureaucrat, lies closer to their ideal point than the budget-constrained level of provision.
Proposition 4 A binding governmental budget restriction increases the probability of a bureaucrat doing a CBA.
The null of Proposition 4 is that there are no systematic differences between bureaucrats working for government agencies acting under a binding budget constraint and those not so constrained.
To test the four propositions, we designed a choice experiment that was sent to civil servants at five government agencies. In the next section, we describe the questionnaire and data collection.
3. Questionnaire, data collection, and the data
3.1. Description of the questionnaire and the data
The choice experiment tested the influence of CBA information on the participating civil servants’ response behavior. The questionnaire dealt with a government policy to encourage the production of biofuels from forestry. The questions were based on a number of recent studies (Bosted, Mustonen, & Gong, 2015; Henning, 2015; Swedish Energy Agency, 2015; 2016; Apaydin, 2016;
Konjunkturinstitutet, 2016; Kungliga ingenjörsveternskapsakademien (IVA), 2016; Nationellt
skogsprogram, 2016; Ministry of Enterprise and Innovation, 2016; Swedish Transport Administration, 2016). A pre-study was conducted on a reference group consisting of representatives from the Swedish Energy Agency, the Swedish Environmental Protection Agency, the Swedish Transport Administration, the Swedish Transport Agency, and Transport Analysis, i.e., the same agencies that answered the questionnaire.
As an introduction, the respondents were given information about the current policy landscape in Sweden with a political ambition of creating a fossil-free vehicle fleet by 2030. They were also informed that biofuels from forests could be part of the solution and about current energy use and CO2 emissions from the car fleet in Sweden. Finally, they were told that the government in different
14 ways encourages the transformation of the car fleet, for example through government grants (see Appendix A1).
The questions were divided into three sections. The first concerned the respondents’ education and previous work experience. The second part consisted of five choice experiment questions, four of a standard type evaluating the trade-offs between different attributes, and a fifth, which is the one analyzed in this study. Hence, when answering the fifth question, the respondents had already been forced to consider the possible trade-offs involved. The questionnaire ended with questions about individual characteristics (age, sex, income, etc.) and attitudes both to risk and more generally. The aim of the fifth choice question was to create a scenario that resembles a real-life choice context. The assumption is that the choice situations that the bureaucrats encounter in their everyday work include a description of both the benefits and the costs of undertaking a certain action. To mimic this, the questionnaire contained information about the estimated societal benefit of reducing CO2 emissions (0.8–1.2 SEK per kg CO2 reduced) and the cost of four different action programs to reduce these emissions from the transport sector over the 10-year period 2020–2030; see Table 2.10, 11 The respondents also had the option to reject all alternatives, hence choosing the status quo. This we assumed to imply a zero willingness to pay.
Table 2. Action programs presented to respondents in the questionnaire.
KWH PER 100 VEHICLE KILOMETERS ON AVERAGE IN 2030 CO2 EMISSIONS IN 2030 (REDUCTION COMPARED INVESTMENT GRANT IN
10 We tested a similar question in a previous study where the respondents were university students in
economics, biology or social sciences (Jussila Hammes, Pyddoke, & Nerhagen, 2013; Nerhagen, Pyddoke, & Jussila Hammes, 2014). We found differences in response behavior between the economics majors and those in the other fields.
11 The average exchange rate in 2017 when the experiment was conducted was 9.6326 SEK per EUR and 8.538
15
WITH 2020 VALUES WITH THE SAME TRAFFIC VOLUME)
TOTAL UNTIL 2030
PROGRAM 1 50 9.1 billion kg/year (1.9 billion kg/year)
5 billion SEK
PROGRAM 2 30 4.5 billion kg/ year (6.5 billion kg/ year)
20 billion SEK
PROGRAM 3 48 8.4 billion kg/ year (2.6 billion kg/ year)
0,5 billion SEK
PROGRAM 4 20 1.9 billion kg/ year (9.1 billion kg/ year)
200 billion SEK
For Programs 1–3 (P1–P3), total benefits exceed the total costs. P1 is inefficient compared with P3, which results in approximately the same climate impact at a much lower cost. Which of the two alternatives, P2 or P3, is to be preferred depends on the choice of benefit estimate and decision rule (net present value or benefit-cost ratio).12 The upper benefit estimate, 1.2 SEK per kg CO
2, yields a
higher net present value for P2, while the lower estimate of 0.8 SEK per kg CO2, yields a higher estimate for P3. The average benefit estimate, 1 SEK per kg, yields the same net present value for P2 and P3. P2 makes a larger contribution to the reduction of CO2 emissions, however. Using the
benefit-cost ratio as the decision criterion, P3 is superior to P2. P4 is the only alternative that reaches the goal of reducing GHG emissions from the transport sector by 70% by 2030, but at a very high cost.
In the third part of the questionnaire, we started by gauging the respondents’ risk preferences. The respondents were asked to choose between a series of small sums of money with certainty (starting from 10 SEK; about 1 EUR or 1.2 USD and running up to 200 SEK) or a lottery with a 50% chance of
12 According to Boardman et al. (2006), the appropriate decision rule in a CBA is to choose the project with the
largest net present value (NPV) since this always provides the correct answer, unlike the benefit-cost ratio. However, NPV may not result in the most efficient allocation of resources since there may be other alternatives not included in the choice set that might be better. This may be so due to budgetary and/or political
16 winning 300 SEK (31 EUR or 35 USD), the game stopping when the respondent chose the sum of money with certainty over the lottery. The answers were used to construct the variable Risk neutral/loving (RN/RL), which takes the value of one if the respondent is risk neutral or loving and zero if risk averse.
The third part of the questionnaire ended with a large number of questions examining the respondents’ attitudes. We used this information to construct two indexes of attitudes and
aptitudes. Each index was constructed using the first components of a principal component analysis. The first index (economic preferences) is composed of responses to questions about the importance of CBA, rationality, and cost-effectiveness. The variable is used as a proxy for the cost of doing a CBA (Proposition 3). The second index (environmental preferences) is composed of responses to questions about the importance of the natural environment, ecological sustainability, and reduced oil
dependency. This variable is used as a proxy to test the intensity of preferences for the environment (Proposition 2). The responses to both these questions range from 1 (not at all important) to 6 (great importance). The correlation between economic and environmental preferences is 0.1032 (at the 5% level of statistical significance).
Altogether there were 4 × 2 = 8 different versions of the questionnaire; four versions of the basic choice experiment questions, and two versions where half of the respondents received additional information about the policy context. The extra information contained, first, an explicit reminder of the CO2 reduction goal for the transport sector to be achieved by 2030, i.e., a reduction by 70% compared with 2010 levels, and second, a reminder of the alternative cost of public funds. This is similar to an ordinary willingness to pay study where respondents are reminded about their own income and budget constraint. The binary variable Infotext captures this aspect of the questionnaire; it takes the value of one for those who got the additional information and zero otherwise. The variables used are summarized in Table 3.
17
Table 3 Descriptive statistics of the variables included in the regressions.
VARIABLE N MEAN STD. MIN MAX
INFOTEXT 425 0.496 0.501 0 1 SEPA 425 0.195 0.397 0 1 STAGENCY 425 0.061 0.240 0 1 STADMIN 425 0.492 0.501 0 1 SEX (1=WOMAN) 425 0.447 0.498 0 1 WORK EXPERIENCE 425 9.913 9.939 0.5 46 ECONOMIC PREFS 425 -0.003 1.388 -5.337 2.242 ENVIRONMENT PREFS 425 -0.005 1.372 -5.051 1.852 RISK NEUTRAL/LOVING (RN/RL) 425 0.395 0.489 0 1 3.2. Data collection
The questionnaire was sent to 1,488 civil servants at five Swedish government agencies: the Swedish Energy Agency (SEA), the Swedish Environmental Protection Agency (SEPA), the Swedish Transport Administration (STAdmin), the Swedish Transport Agency (STAgency), and Transport Analysis (Trafa). These are the main agencies working with the transition to a fossil-free vehicle fleet by 2030. The data was collected in May 2017.13 As noted above, eight versions of the questionnaire were used, and 185–188 copies of each version were sent out.
At SEA, SEPA, and STAdmin, we could send the questionnaire to all staff involved in policy-related work, including heads of office. Only office clerks were excluded from the sample at these agencies. At the STAgency, we received permission to send the questionnaire to a random sample of 67 out of about 243 relevant workers, and at Trafa to the 11 employees working with economic analysis. The results of the data collection are summarized in Table 4. As can be seen, some respondents were on
13 The original questionnaire was sent out on May 3rd to SEA, SEPA, STAgency, and Trafa, and on May 11th to
18 leave of absence or were not relevant for other reasons. Hence, the valid sample consists of 1,383 respondents.14
Table 4. Summary statistics for respondents from the government agencies.
EMPLOYEES CONTACTED ON LEAVE ADMINIS-TRATOR NO REPLY DUE TO TIME CONSTRAINT NET SAMPLE RESPONSE RATE SEPA 442 37 3 2 400 91 (23%) SEA 287 25 1 0 261 103 (39%) STADMIN 681 34 2 0 645 226 (35%) STAGENCY 67 1 0 0 66 29 (44%) TRAFA 11 0 0 0 11 10 (91%) TOTAL 1,488 97 6 2 1,383 459 (33%)
The response rate varied considerably between the agencies. SEPA had the lowest response rate at 23%, and Trafa the highest at 91%. From comments sent by personal e-mail to the lead author as well as comments in the questionnaire, we found that there are several reasons for the variation in the response rate. An important one appears to be that bureaucrats are hesitant to answer questions outside their area of expertise. This may explain why the response rates from STAgency and Trafa are comparatively high, while not all staff at SEA and SEPA work with transport-related questions.
Moreover, the time available to answer the questionnaire appears to have been a limiting factor, and it seems the questions were considered complicated. Other comments along this line were that the choice questions do not reflect current management practices and/or that the questions do not fully reflect a more complex reality. Some respondents therefore deliberately chose not to answer the questionnaire. One person claimed that the reason for not replying was that bureaucrats only provide information to the decision-making process, while the decisions and trade-offs are made by
14 The analysis is based on “out of office” and some written replies to the lead author. Assuming not all office
clerks sent e-mails stating this, or that not all persons on leave had an “out of office” reply, the valid workforce may still be overestimated.
19 politicians. It is possible that only persons with a more favorable attitude to questionnaires of this type responded, which may above all bias the answers obtained from SEPA.
3.3. Description of respondents
Descriptive statistics of the respondents are provided in Table 5. A zero after the name of an agency indicates that the questionnaire version they received did not contain information about the emissions reduction goal and budget constraint, and a 1 that the information was included.
Table 5. Summary statistics for respondents per agency and questionnaire version (minima and maxima in parentheses). RESPONSE TIME (MINUTES)* YEARS AT PRESENT WORK YEARS AFTER EDUCATION YEAR OF BIRTH SHARE OF ECONOMICS DEGREES SHARE OF WOMEN SEPA (0) 27.4 (6–99) 7.94 (0.5–30) 19.15 (2–39) 1969 (1952– 1990) 0.14 0.39 SEPA (1) 34.37 (5–99) 9.23 (0.5–46) 20.12 (1.5–48) 1969 (1946– 1993) 0.14 0.58 SEA (0) 35.76 (6–99) 6.01 (0.5–18) 13.46 (2–34) 1975 (1953– 1991) 0.12 0.52 SEA (1) 38.13 (11–99) 6.36 (0.5–20) 18.15 (3.5–45) 1971 (1952– 1991) 0.15 0.53 STADMIN (0) 32.97 (5–99) 12.78 (0.5–42) 22.57 (2–43) 1967 (1950– 1991) 0.07 0.47 STADMIN (1) 34.75 (2–99) 12.97 (0.5–42) 23.03 (2–47) 1968 (1946– 1991) 0.06 0.41 STAGENCY (0) 16.67 (8–32) 7.27 (0.5–22) 19.87 (5–45) 1971 (1952– 1988) 0 0.36 STAGENCY (1) 45.64 (12–99) 3.93 (0.5–16) 19.69 (4–37) 1972 (1953– 1989) 0.07 0.07 TRAFA (0) 26.67 (17–44) 4.17 (2–7) 14.67 (10–22) 1975 0.33 0.67
20 (1970– 1978) TRAFA (1) 21.14 (15–30) 5,5 (1.5–7) 15.71 (2–25) 1972 (1962– 1981) 0.43 0.14
*99 is used for those with a recorded time of over one hour. In these cases, it is likely that they started to fill in the questionnaire, took a break and then came back later to complete.
The bureaucrats at STAdmin have worked the longest at the agency and also have the longest work experience. SEPA and STAdmin have the highest average ages of workers. Respondents at SEA, STAgency and Trafa have relatively few years of work experience at their respective agency but especially employees at the STAgency have a lot of work experience from other jobs. One
explanation for this is that STAGency is the result of a merger between previous regulatory agencies; hence, some of the employees have been working with these issues for a long time. A similar
explanation applies for Trafa, which was created at the same time as STAdmin and STAgency. STAdmin together with STAgency have the lowest share of employees with a degree in economics, while Trafa has the highest. Regarding gender, there is some variation across agencies, with Trafa and STAgency having the lowest shares of women.
Summary statistics for risk preferences are shown in Table 6. The majority of individuals are risk averse, which is in line with standard economic theory. Breaking the numbers down by agency, we see that while risk aversion remains the biggest category in each case, there are marked differences in the degree of risk aversion, risk neutrality, and risk loving across agencies. These differences, however, are not statistically significant.
Table 6. Results from analysis of risk aversion
MEAN OBS
FULL SAMPLE
Risk averse 61.20% 433
Risk neutral 17.09% 433
21 SEPA Risk averse 54.76% 84 Risk neutral 17.86% 84 Risk loving 27.38% 84 SEA Risk averse 60.61% 99 Risk neutral 22.22% 99 Risk loving 17.17% 99 STADMIN Risk averse 66.20% 213 Risk neutral 13.15% 213 Risk loving 20.66% 213 STAGENCY Risk averse 51.85% 27 Risk neutral 25.93% 27 Risk loving 22.22% 27 TRAFA Risk averse 40.00% 10 Risk neutral 20.00% 10 Risk loving 40.00% 10 ECONOMICS MAJOR Risk averse 38.30% 47 Risk neutral 29.79% 47 Risk loving 31.91% 47 OTHER MAJOR Risk averse 62.81% 398 Risk neutral 15.08% 398 Risk loving 22.11% 398
The differences between individuals who have a degree in economics and those with other degrees are statistically significant (see bottom boxes of Table 6). Thus, workers with economics degrees are significantly less risk averse than individuals with other degrees, and significantly more risk neutral and risk loving.
We analyze the responses to the choice question in two ways. First, we provide nonparametric information on the response behavior of the different agencies. Secondly, we add the influence of individual specific characteristics with a multinomial logistic regression.
22
4. Results
4.1. Non-parametric analysis of the influence of institutional norms
We start by examining the difference between the group that received extra information about a budget constraint and the emissions reduction goal and the group that did not receive this information (variable Infotext). In these analyses, 27 observations were excluded since those
individuals chose P1.15 We have applied the non-parametric approach in Kriström (1990), testing the difference between the groups receiving different “treatments” as in Frykblom (1997). Figure 1 shows the empirical survival functions for the two groups in four of the five government agencies included. The data underlying the graphs are presented in Appendix A3.16 Trafa is not included because of too few observations. The x-axis shows the average costs of, i.e., the bids for, the status quo (the alternative of not choosing any of the programs) and P2–P4. On the y-axis are the shares accepting a certain bid. The black curve shows responses without Infotext and the grey curve displays the responses with it.
From the graphical presentation, we can see that there is heterogeneity in the response behavior. Based on the results from Eggert et al. (2016), this was to be expected. There are some clear patterns in the behavior. First, a majority of the respondents at all agencies prefer P2, for which total cost is approximately equal to total benefit. This is illustrated in Figure 1 by the distance between points P3 and P2. As described in the appendix, the share accepting this bid is in most cases above 50%.
15 The P1 option was included in the questionnaire because in real life, there may be several options that
achieve approximately the same reduction but some of them are costlier than others. Furthermore, it is commonly found in choice experiments (willingness to pay studies) that some individuals deviate from the theoretical assumptions of rationality underlying the questions and we wanted to test whether this was the case also in our experiment. The option is included in the regression analyses presented below.
16 Since we are interested in finding whether there is a difference in the share accepting each bid in the two
23 Furthermore, the share of respondents choosing P4, which would achieve the 70% reduction goal in CO2 emissions by 2030, is fairly stable for those not receiving additional information, at around 20% (distance between point P2 and the end point, P4). It is somewhat higher for SEPA and STAgency and lower for STAdmin and SEA. However, providing additional information changes the response behavior by lowering the share of respondents accepting each bid, the difference being statistically significant for all agencies except STAdmin. In other words, with the additional information a larger share of the respondents chose lower bids or status quo.
P3
P2
P4 SQ
24 P4 P4 SQ SQ P3 P3 P2 P2
25
Figure 1. Empirical survival curves for STAdmin, STAgency, SEPA, and SEA. The grey curve shows responses with (indicated by 1) and the black curve shows responses without Infotext.
We use Pearson’s χ2-test to examine whether the share accepting different bids at each agency varies systematically. Moreover, we test whether the responses differ systematically between SEA and SEPA. The results are presented in Table 7. Due to the small number of observations, these tests were not done for STAgency or Trafa.
Table 7 Results from an 𝜒2 test for the treated (1) and non-treated (0) groups.
ALTERNATIVES N PEARSON CHI2(3) PROBABILITY
STADMIN (0) – STADMIN (1) 189 0.7541 0.860 SEPA (0) – SEPA (1) 80 17.5056 0.001 SEA (0) – SEA (1) 94 7.2002 0.066 SEPA (0) – SEA (0) 84 4.9617 0.175 SEPA (1) – SEA (1) 90 8.3194 0.040 SQ P3 P2 P4
26 Based on Table 7, we can reject the null hypothesis of no influence of the information text for SEPA but not for SEA and STAdmin. Moreover, there are statistically significant differences in response behavior between the respondents from SEPA and SEA.
The difference in response behavior between the different government agencies suggests support for Proposition 4 about the influence of a binding governmental budget constraint. The reasoning is as follows: Out of the three agencies studied, STAdmin is the one where the bureaucrats regularly work under a budget restriction since the investment funds available for the building of,
maintenance of, and reinvestment in infrastructure are limited. It may then be that the bureaucrats at this agency automatically take a governmental budget constraint into consideration, without any extra reminders. The SEA is an “intermediate” case where, e.g., those working with research funding regularly meet a budget constraint, while analysts probably more rarely have to consider one. As noted by Hultrantz (2009), environmental and energy policies more seldom meet a governmental budget constraint; instead, such policies are either revenue neutral for the state or generate an income. The exposure of the bureaucrats at SEPA and, to some extent, SEA to a budget constraint is limited.
Finally, we find that economic information appears to influence the response behavior. This is illustrated by the majority of respondents choosing the alternative where the total cost is
approximately equal to the total benefit (P2). Including information about a budget constraint for SEPA and SEA reduced the share accepting the alternative with the highest bid (P4), which would achieve the politically stated reduction goal. These results therefore strongly suggest that having information about the economic costs of policy will put restraints on bureaucrats’ decision-making and force them toward an outcome that is closer to a social optimum. To examine the issue further, we next turn to regression analysis.
27
4.2. Regression analysis of the influence of both institutional norms and individual characteristics
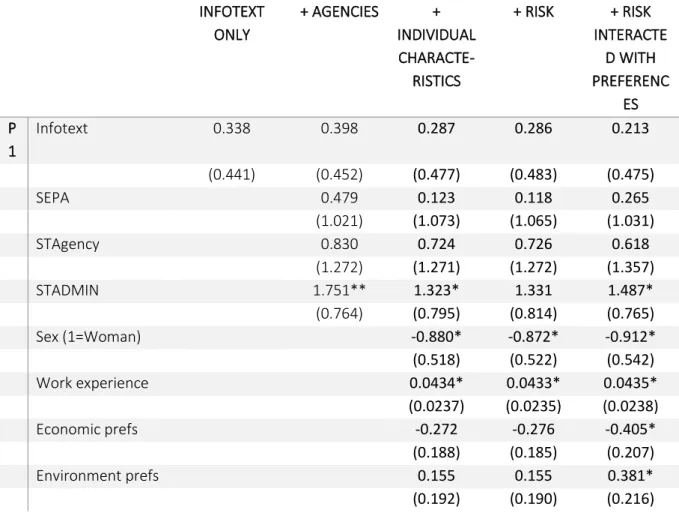
To further investigate the response behavior, we undertook a multinomial logistic regression. The results are presented in Table 8. We present five models, the first with only the two treatment groups (Infotext), the second with SEPA, STAgency, and STAdmin added, and SEA and Trafa thus being treated as the base agencies, the third with individual characteristics added, the fourth with an indicator of being risk neutral/loving, and finally a model that includes an interaction between being risk neutral/loving and economic and environmental preferences.17 The base program in the
regressions is P2 (see Table 2).
Table 8 Results from a multinomial logistic regression
INFOTEXT ONLY + AGENCIES + INDIVIDUAL CHARACTE-RISTICS + RISK + RISK INTERACTE D WITH PREFERENC ES P 1 Infotext 0.338 0.398 0.287 0.286 0.213 (0.441) (0.452) (0.477) (0.483) (0.475) SEPA 0.479 0.123 0.118 0.265 (1.021) (1.073) (1.065) (1.031) STAgency 0.830 0.724 0.726 0.618 (1.272) (1.271) (1.272) (1.357) STADMIN 1.751** 1.323* 1.331 1.487* (0.764) (0.795) (0.814) (0.765) Sex (1=Woman) -0.880* -0.872* -0.912* (0.518) (0.522) (0.542) Work experience 0.0434* 0.0433* 0.0435* (0.0237) (0.0235) (0.0238) Economic prefs -0.272 -0.276 -0.405* (0.188) (0.185) (0.207) Environment prefs 0.155 0.155 0.381* (0.192) (0.190) (0.216)
17 We also tested separate estimation for the two treatment groups (Infotext = 0 or 1). Since there were only
few observations in some categories the models were sensitive to the specification and were therefore not included.
28 Risk neutral/loving 0.0857 0.166 (0.494) (0.512) RNRL*econ prefs -0.565** (0.287) RNRL*env prefs 0.459 (0.339)
Econ prefs*env prefs -0.103
(0.0981) P 3 Infotext 0.327 0.345 0.327 0.324 0.350 (0.284) (0.281) (0.286) (0.286) (0.292) SEPA 0.144 0.295 0.284 0.400 (0.453) (0.467) (0.470) (0.468) STAgency 0.273 0.319 0.318 0.259 (0.635) (0.648) (0.651) (0.701) STADMIN 0.497 0.303 0.326 0.280 (0.353) (0.378) (0.373) (0.375) Sex (1=Woman) -0.0198 -0.00329 -0.0980 (0.295) (0.297) (0.311) Work experience 0.0165 0.0161 0.0192 (0.0153) (0.0155) (0.0150) Economic prefs 0.0964 0.0890 -0.139 (0.116) (0.114) (0.151) Environment prefs -0.353*** -0.349*** -0.380** (0.0935) (0.0936) (0.150) Risk neutral/loving 0.196 0.0405 (0.298) (0.337) RNRL*econ prefs -0.0551 (0.206) RNRL*env prefs 0.656*** (0.239)
Econ prefs*env prefs 0.0649
(0.0688) P 4 Infotext -0.460 -0.461 -0.494* -0.495* -0.487 (0.288) (0.291) (0.296) (0.296) (0.297) SEPA 0.967** 0.666 0.655 0.788* (0.448) (0.455) (0.454) (0.464) STAgency 0.868 0.752 0.754 0.771 (0.615) (0.648) (0.648) (0.691) STADMIN 0.746* 0.728* 0.738* 0.781* (0.392) (0.403) (0.403) (0.423) Sex (1=Woman) -0.499 -0.486 -0.636** (0.314) (0.314) (0.321) Work experience 0.00766 0.00752 0.00522
29 (0.0146) (0.0146) (0.0150) Economic prefs -0.199** -0.206** -0.429*** (0.100) (0.102) (0.148) Environment prefs 0.411** 0.408** 0.866*** (0.163) (0.165) (0.233) Risk neutral/loving 0.139 0.405 (0.311) (0.341) RNRL*econ prefs -0.697** (0.282) RNRL*env prefs 0.356* (0.207)
Econ prefs*env prefs 0.132
(0.0913) P 5 Infotext 0.813** 0.781** 0.738* 0.737* 0.733* (0.389) (0.392) (0.395) (0.395) (0.395) SEPA 0.559 0.558 0.549 0.580 (0.457) (0.462) (0.458) (0.464) STAgency -0.890 -0.678 -0.675 -0.653 (1.112) (1.117) (1.117) (1.108) STADMIN -0.528 -0.475 -0.462 -0.508 (0.463) (0.484) (0.491) (0.505) Sex (1=Woman) 0.417 0.442 0.419 (0.378) (0.381) (0.379) Work experience -0.0157 -0.0163 -0.0151 (0.0189) (0.0190) (0.0196) Economic prefs -0.117 -0.126 -0.152 (0.149) (0.152) (0.223) Environment prefs -0.117 -0.116 -0.204 (0.165) (0.163) (0.232) Risk neutral/loving 0.176 0.140 (0.390) (0.391) RNRL*econ prefs 0.157 (0.330) RNRL*env prefs 0.0721 (0.342)
Econ prefs*env prefs 0.0361
(0.130)
N 425 425 425 425 425
30 Looking at the results for the first model, they confirm the findings from the non-parametric analysis. Including additional information (Infotext) implies that respondents are less likely to choose P4 and more likely to choose the status quo option (= P5 in the table). Including the government agencies (the second model), we find that respondents at SEPA are more likely to choose P4 than those at SEA and Trafa.
To aid the interpretation of the rest of the models, we summarize the properties of the five programs and the predicted properties these have in the left-hand panel of Table 9, which is based on Table 1. The right-hand panel of the table contains a summary of the significant regression results from Table 8, model 5. The base case, against which we compare the results, is P2, which has the profile of being chosen by a risk-averse bureaucrat with medium environmental preferences and a low cost of doing a CBA. From Table 6, we see that the majority of bureaucrats are risk averse, and a majority of the bureaucrats also chose P2 (56.24% of the respondents). Moreover, the average bureaucrat has slightly negative economic (-0.003) and environmental preferences (-0.005).
31
Table 9 Properties predicted to raise the probability of choosing the respective programs in the left-hand panel, and an interpretation of the regression results from model 5 in the right-hand panel.
PREDICTED REGRESSION RESULTS
PROGRAM Properties of the programs Risk profile H1 (H2) Environ-mental profile Economic profile RN/RL Econ prefs (#RA) Env prefs (#RA) RN/RL # Env prefs RN/RL # Econ prefs
P1 The irrational choice RN/RL
(RA)
Low Low - + -
P2 Cost-efficient, greater environmental benefits, higher cost than P3 – BASE
RA (RN/RL) Medium High P3 Cost-efficient RA (RN/RL) Low High - +
P4 Reaches the environmental goal RN/RL
(RA)
High Low - + + -
P5 Status quo RN/RL
(RA)
32 Interpreting the right-hand side of Table 9, we note that the impact of the cost of doing a CBA
(economic preferences) has the expected sign for P1 – those with a low cost of doing a CBA are less likely to choose the inefficient P1. Moreover, the finding that the risk-averse individuals with high environmental preferences prefer P1 lends support to Hypothesis 2.
The impact of environmental preferences on the probability of choosing P3 over P2 is as predicted by Proposition 2 and lowers the probability of choosing the cost-efficient alternative P3. The other significant coefficient, the interaction between RN/RL and economic preferences indicates that risk neutral/loving individuals with low cost of doing a CBA choose P3. This finding, too, lends support to Hypothesis 2, besides supporting Proposition 3.
Finally, the impact of the cost of doing a CBA (economic preferences) on the probability of choosing P4 is as expected according to Proposition 3, i.e., bureaucrats with a low cost of doing a CBA are less likely to choose the cost-inefficient alternative. Even the impact of environmental preferences is as predicted by Proposition 2, i.e., bureaucrats with high ideological beliefs choose the program that reaches the environmental goal. Moreover, the fact that the risk-neutral/loving individuals with high environmental preferences are less likely than their risk-averse peers to choose P4 lends support to Hypothesis 2 and Proposition 2. Finally, the risk-neutral/loving individuals with high economic
preferences (low cost of doing a CBA) were in fact predicted to choose P2 or P3 by Hypothesis 2. That they are also less likely to choose P4 than the risk-averse individuals with a low cost of doing a CBA is in line with the model.
We conclude that the model fares very well when confronted with data. Thus, we find support for all three of the tested Propositions, i.e., 2, 3, and 4. Moreover, the data lends support to Hypothesis 2. We thus reject Hypothesis 1 and conclude that the bureaucrats behave as if they are risk averse with respect to environmental outcome.
33
5. Summary and conclusions
This paper has examined a bureaucrat’s incentives to carry out or to take into consideration information from a cost-benefit analysis (CBA). The theoretical framework for this choice is a delegation model, where CBA is a form of delegation since we assume that not doing a CBA leads to decision-making under uncertainty. The main contribution of the paper is the surveying of civil servants at five Swedish government agencies, data from which is used to test the theoretical model against empirical data.
The theoretical model in the paper rests on a few assumptions. The most important is that the bureaucrats’ assessment of the uncertainty pertaining to the policy outcome is heterogeneous among bureaucrats. The second one is that the bureaucrats are risk averse. Without risk aversion, the civil servants would be indifferent between obtaining the expected value of their preferred policy with and without certainty. The third assumption is that uncertainty about the policy outcome can be mitigated by doing a CBA. We do not assume a specific distribution of the shock. The model
therefore applies for fairly general circumstances.
According to theory, the three main factors driving a bureaucrat’s propensity to do a CBA are their risk averseness, their preferences for environmental quality, and the cost of doing a CBA. The data lends support to these hypotheses. Thus, a bureaucrat who is risk averse with respect to the environmental outcome, i.e., who is afraid of not reaching their desired environmental outcome, is less likely to do a CBA than a risk-neutral/loving one. Moreover, a bureaucrat with high preferences for environmental quality is less likely to do a CBA than a bureaucrat with less extreme
environmental preferences. Finally, increasing cost of doing a CBA reduces the probability of doing one. Thus, a risk-averse bureaucrat with high environmental preferences and a high cost of doing a CBA is the least likely candidate to do a CBA and tends to choose the most environmentally far-reaching alternative with a greater probability than other bureaucrats. On the other hand,
34 low cost of doing a CBA are more likely to choose a cost-efficient environmental policy, however with less environmental benefits than the equally cost efficient base case.
We also examine a fourth possible explanation to the propensity to do a CBA, namely an institutional aspect. The presence of a governmental budget constraint may raise the probability of a bureaucrat doing/using information from a CBA. We find that a reminder of the existence of a budget constraint makes the bureaucrats more likely to choose less costly alternatives or even the status quo. Thus, we find support for this hypothesis.
CBA as a delegation mechanism within this simple model can explain some circumstances in which a bureaucrat would not be interested in doing/using information from a CBA. These include risk aversion with regard to the environmental outcome, high preferences for the environment, and the cost of doing a CBA. Other reasons for the lacking use of CBAs have been studied in a sister paper, Jussila Hammes (2017). That paper identifies cognitive dissonance as an important factor and notes that a binding governmental budget constraint can induce an otherwise unwilling bureaucrat to do a CBA. The present paper adds the importance of educating bureaucrats about the uses of a CBA.
References
Alesina, A., & Tabellini, G. (2007). Bureaucrats or politicians? Part I: A single policy task. The American Economic Review, 97(1), 169-179.
Alesina, A., & Tabellini, G. (2008). Bureaucrats or politicians? Part II: Multiple policy tasks. Journal of Public Economics, 92, 426-447.
Andersson, H. (2018). Application of BCA in Europe - Experiences and challenges. Journal of Benefit-Cost Analysis, 9(1), 84-96. doi:https://doi.org/10.1017/bca.2018.5
Apaydin, M. (2016). Lägesbeskrivning av arbetet med Klimatklivet. Stockholm: Naturvårdsverket skrivelse.
Bendor, J., & Meirowitz, A. (2004). Spatial models of delegation. American Political Science Review, 98(2), 293-310. doi:http://dx.doi.org/10.1017/S0003055404001157
Bendor, J., Glazer, A., & Hammond, T. H. (2001). Theories of delegation in political science. Annual Review of Political Science, 4, 235-269. doi:10.1146/annurev.polisci.4.1.235
Bosted, G., Mustonen, M., & Gong, P. (2015). Increasing forest biomass supply in Northern Europe - Countrywide estimates and economic perspectives. Umeå: Centre for Environmental and Resource Economics (CERE).
35 Broberg, T., Samakovlis, E., & Forslund, J. (2010). Investeringsstöd - ett överskattat styrmedel i
miljöpolitiken. Ekonomisk debatt, 38(3), 17-26.
Carlsson, F., Kataria, M., & Lampi, E. (2011). Do EPA administrators recommend environmental policies that citizens want? Land Economics, 87, 60-74.
Eggert, H., Kataria, M., & Lampi, E. (2016). Difference in preferences or in preference orderings? Comparing choices of environmental bureaucrats, recreational anglers, and the public. Gothenburg, Sweden: University of Gothenburg Working Papers in Economics No 669. Enthoven, A. (2019). How Systems Analysis, Cost-Effectiveness Analysis, or Benefit-Cost Analysis First
Became Influential in Federal Government Program Decision-Making. Journal of Benefit-Cost Analysis, 10(2), 146-155. doi:https://doi.org/10.1017/bca.2019.23
Forsstedt, S., & Nerhagen, L. (2016). Samhällsekonomisk analys i regelgivningsarbetet. Borlänge: Transportstyrelsen.
Frykblom, P. (1997). Hypothetical question models and real willingness to pay. Journal of Environmental Economics and Management, 34, 275-287.
Hansson, L., & Nerhagen, L. (2019). Regulatory measurements in i policy coordinated practices: the case of promoting renewable energy and cleaner transport in Sweden. Sustainability, 11(6), 1-18. doi:http://www.doi.org/10.3390/su11061687
Henning, D. (2015). Beskrivning av beräkningar av minskade växthusgasutsläpp för ansökningar i Klimatklivet. Stockholm: Naturvårdsverket skrivelse.
Hultkrantz, L. (2009). Ett styvbarn. Ekonomisk debatt, 37(7), 3-5.
Iaryczower, M., Lewis, G., & Shum, M. (2013). To elect or to appoint? Bias, information, and responsiveness of bureaucrats and politicians. Journal of Public Economics, 97, 230-244. Jehle, G. A., & Reny, P. J. (1998). Advanced Microeconomic Theory. Reading, Massachusetts:
Addison-Wesley.
Jussila Hammes, J. (2017). The impact of career concerns and cognitive dissonance on bureaucrats' use of cost-benefit analysis. Stockholm: S-WoPEc 2017:5.
Jussila Hammes, J., Pyddoke, R., & Nerhagen, L. (2013). The impact of education on environmental policy decision-making. CTS S-WoPEC 2013:9.
Kahneman, D. (2011). Thinking, Fast and Slow. Penguin Random House UK.
Konjunkturinstitutet. (2016). Kostnadseffektiv styrning mot mål om förnybar energi. Stockholm: Konjunkturinstitutet.
Kriström, B. (1990). A non-parametric approach to the estimation of welfare measures in discrete response valuation studies. Land Economics, 66(2), 135-139.
Kungliga ingenjörsveternskapsakademien (IVA). (2016). Fem vägval för Sverige. Syntesrapport. Stockholm: IVA-projekt Vägval el. IVA-M 471.
Miljömålsberedningen. (2016.:47). En klimat- och luftvårdsstrategi för Sverige. Stockholm: Wolter Kluwer Sverige AB.
36 Miljömålsberedningen. (2016:21). Ett klimatpolitiskt ramverk för Sverige. Stockholm: Wolters Kluwer
Sverige AB.
Ministry of Enterprise and Innovation. (2016). Sveriges handlingsprogram för infrastrukturen för alternativa drivmedel i enlighet med direktiv 2014/94/EU. Stockholm: Regeringskansliet. Mouter, N. (2016). Dutch politicians' use of Cost-Benefit Analysis. Washington: Meeting of the
Transportation Research Board.
Mouter, N., Annema, J. A., & van Wee, B. (2013). Attitudes towards the role of cost-benefit analysis in the decision-making process for spatial-infrastructure projects: A Dutch case study. Transportation Research Part A, 58, 1-14.
Mouter, N., Annema, J. A., & van Wee, B. (2015). Managing the insovable limitations of cost-benefit analysis: results of an interview based study. Transportation, 42, 277-302.
Nationellt skogsprogram. (2016). Främjande av biobaserade produkter och energi, smarta transporter, en skogsindustri i världsklass och ökad epoert. Underlagsrapport från arbetsgrupp 3 inom nationellt skogsprogram.
http://www.regeringen.se/rapporter/2016/09/underlagsrapporter-till-arbetet-med-det-nationella-skogsprogrammet/, Stockholm.
Nerhagen, L., & Forsstedt, S. (2016). Regulating transport. The possible role of regulatory impact assessment in Swedish transport planing. Stockholm: Paper to be presented at the ITF/OECD round table in Stockholm, 6-7 October 2016.
Nerhagen, L., Forsstedt, S., & Edvardsson, K. (2017). Bounded precaution and initial assessment of risk in transport regulation - lessons from Sweden. Stockholm: Centre for Transport Studies. Nerhagen, L., Pyddoke, R., & Jussila Hammes, J. (2014). Response to a social dilemma: An analysis of
the choice between an economic and an environmental optimum in a policy-making context. CTS S-WoPEc 2014:8.
OECD. (2012). Recommendation of the council on regulatory policy and governance. Paris: OECD. Retrieved from http://www.oecd.org/gov/regulatory-policy/49990817.pdf
Pyddoke, R., & Nerhagen, L. (2010). Miljöpolitik på samhällsekonomisk grund. En fallstudie om styrmedlet miljökvalitetsnormer för partiklar och kvävedioxid. VTI, Linköping.
Rose-Ackerman, S. (2007, March 31). Public choice, public law and public policy. Amsterdam: Keynote address, First World Meeting of the Public Choice Society. Retrieved from
http://www.creedexperiment.nl/pc2007/Rose-AckermanPCS07keynote11111.pdf
Samakovlis, E., & Vredin Johansson, M. (2005). Samhällsekonomiskt underlag i miljöpolitiken: brister och förbättringar. Ekonomisk debatt, 7, 30-39.
Samakovlis, E., & Vredin Johansson, M. (2007). En soppa med Klimp? Utvärdering av
kostnadseffektiviteten i klimatinvesteringsprogrammen. Ekonomisk debatt, 7, 31-43. Sunstein, C. R. (2017). Is cost-benefit analysis a foreign language? Quarterly Journal of Experimental
Psychology, 1-15.
Swedish Energy Agency. (2015). Laddinfrastruktur inom Klimatklivet. Redovisnings- och utvärderingsrapport. Eskilstuna: Energimyndigheten, diarienummer 2015-5982.
37 Swedish Energy Agency. (2016). Drivmedel och biobränslen 2015. Mängder, komponenter och
ursprung rapporterade i enlighet med drivmedelslagen och hållbarhetslagen. Eskilstuna: Statens Energimyndighet.
Swedish Transport Administration. (2016). Åtgärder för at tminska transportsektorns utsläpp av växthusgaser - ett regeringsuppdrag. Borlänge: Trafikverket 2016:111.
Uba, K. (2010). Who formulates renewable-energy policy? Energy Policy, 6674-6683. doi:10.1016/j.enpol.2010.06.037