June 2013
1
Careem: A car within 15 minutes
Careem is a start-‐up company in Dubai that is taking the concept of ordering luxury taxi from your smartphone to the Dubai and the Middle East. It has proven successful in the US and Europe where Uber and Hailo among others are expanding rapidly but Careem is first-‐mover in its market. To be competitive high customer satisfaction is needed and this paper tries to break down the problem of demand and supply for Careem. The company wants to provide a car in 15 minutes. Is this reasonable and if so, what could be the solution to this problem in the challenging Dubai market?
Background
When the financial crisis hit in 2008 it also hit Dubai. After a couple of tough years it now seems like the city is booming again and is an excellent market for entrepreneurs who which to try their luck. This is exactly the opportunity that two former McKinsey consultants wanted to seize. They wanted to set a new benchmark for customer service in the ground transportations industry and therefore started Careem in late 2012. The company aims at using the excess capacity of so-called limousine cars, i.e. luxury cars but not the usual stretched limousine. By creating a technology platform for drivers and customers the company aims to consolidate the market by functioning as a bridge between the supply and demand of the industry. This gives the customers the possibility to order Careem cars from their smartphone on-demand, also known as NOW. The drivers have their own device in the cars where they can accept and reject booking requests.
This service has proven successful in other markets where big players such as Uber and Hailo are currently
operating. However, there are
challenges that Careem faces when entering the Dubai market. There are no street addresses and the customer service level is extremely poor only to mention a couple of difficulties.
Purpose & Problem breakdown The purpose of this project is to develop tools that ensure that you 95% of the times will get a Careem car within 15 minutes of your booking request. To solve this problem it can at a high-level be broken down into two sub-problems seen in Figure 1.
June 2013
2
The first one is the demand problem and the second is the supply problem. The optimal solution for the demand problem is a model that with great accuracy predict ‘when’, ‘where’ and ‘how many’ booking request that will appear. This prediction would then be the input to the supply model. The supply model needs to be able to advice how many drivers that are needed and also where they are needed. The high-level components can be seen as a dimensioning and positioning problem.
Modeling demand
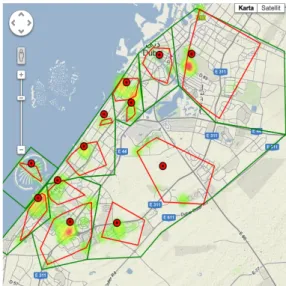
As other papers and researchers have suggested there is a need for a geographical aggregation. This would be the answer to where the demand is. In this paper a three-level zone structure is constructed. The three levels give different levels of details. The three levels consist of zones, clusters and center of masses. In this project a K-means clustering method is used to form clusters from historical pick-up locations. Within the clusters are centers of masses, which show the spots that are closest to the intensity of
the pick-ups. The zones are
constructed to cover the entire Dubai area, including the locations where no pick-ups have been made. A historical distribution of pick-ups across the zones gives the answer to ‘where’ the total number will occur at a given time. The final outcome can be seen in Figure 2.
Figure 2. Three-level clustering
To answer the questions of ‘when’ and ‘how many’ autoregressive, neural network and standard average models are used. These are also models used for similar purposes in previous research. The models are tested on historical time series data for NOW pick-ups to evaluate if any of the
models are considered to be
inappropriate to use. There are five metrics that compare the models, namely the mean error, standard deviation, mean squared error, mean absolute error and the max and min. The best predictions at this stage come
from an AR(24)-process, an
ARMA(16,11), neural networks
models based on large data sets and a seasonality average model. It is clear that peaks in the data are hard to handle, as their magnitude and occurrence are hard to predict.
Modeling supply
The modeling of supply is based on the breakdown of the problem. First the predicted number from the demand model works as an input for the supply model. As this number is given on a zone level there are two things that
June 2013
3
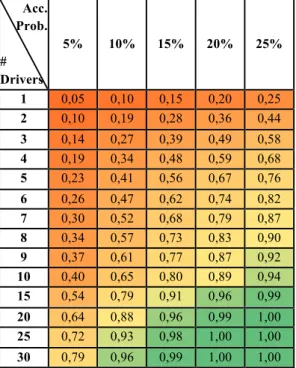
could happen that the supply model needs to handle. A first check would be to see if there are enough available drivers overall to handle the predicted bookings. By using probabilities of accepting a booking for one driver given that he is available this model suggests the number of drivers needed. This acceptance matrix for some probabilities is shown in Figure 3. Additionally a threshold level is incorporated in this model to ensure that each zone always has a minimum coverage. If the level is not reached an action matrix gives appropriate actions depending on whether the issue is at a shift, availability or acceptance level.
Acc. Prob. # Drivers 5% 10% 15% 20% 25% 1 0,05 0,10 0,15 0,20 0,25 2 0,10 0,19 0,28 0,36 0,44 3 0,14 0,27 0,39 0,49 0,58 4 0,19 0,34 0,48 0,59 0,68 5 0,23 0,41 0,56 0,67 0,76 6 0,26 0,47 0,62 0,74 0,82 7 0,30 0,52 0,68 0,79 0,87 8 0,34 0,57 0,73 0,83 0,90 9 0,37 0,61 0,77 0,87 0,92 10 0,40 0,65 0,80 0,89 0,94 15 0,54 0,79 0,91 0,96 0,99 20 0,64 0,88 0,96 0,99 1,00 25 0,72 0,93 0,98 1,00 1,00 30 0,79 0,96 0,99 1,00 1,00
Figure 3. The acceptance matrix. If the first criterion is met the next problem to solve is to have them located in the right zone. From the distribution in the demand it tells how the drivers should be positioned. If there are drivers missing in one or more zones a recursive algorithm suggests the relocation of drivers that
minimizes the time consumption. As it is hard to relocate drivers without certain bookings the algorithm has a
constraint on the number of
relocations.
Evaluation of the demand model An evaluation on new data of the chosen demand models gives good indications on how well the models perform in this setting. The AR(24)-process and the seasonality average model show good results and the latter one is implemented due to the simplicity of implementation. The recommendation is that the AR(24)-process should be implemented but that it needs close monitoring for two reasons. First, the model needs regular calibration and second, the data needs to be stationary which it may not be. Evaluation of the supply model The supply dimensioning model shows good numbers for shift levels and reasonably good for availability. There is however a major issue with keeping the acceptance rate high. There are several potential reasons to this. First,
the drivers may have future
commitments with their limousine company that Careem is unaware of. Second, the drivers do not get enough incentives, e.g. to drive a long way to only get a short ride. Third, drivers reject because lack of area knowledge and hence do not feel comfortable accepting. Fourth, if drivers have not received training with their device they do not know how to accept a booking. Last, inattention to the alerts on the device lead to not accepted requests.
June 2013
4
The supply positioning model gives good help to the operations team. Interviews reveal that the model gives good suggestions and is easy to follow. However it is hard to make drivers relocate between zones as they want certain bookings.
Evaluation of 15 minutes goal
The goal of getting a Careem car within 15 minute 95% of the times is not reached yet. The results indicate significant improvements though and as can be seen in Figure 4 the all parameters have improved since the start of the project.
Figure 4 Evaluation of 15 min. goal Bookings are matched more often and they more often result in a trip. This also leads to an increase in the rate of trips where the driver arrived within 15 minutes.
Conclusion
There are numerous interesting
conclusions from this project. It is interesting to conclude that a simple average model performs equally good as sophisticated mathematical models. Further, the clustering method is a very helpful and powerful tool that in an intuitive way explains areas of large demand. A key success factor for the models to work is that Careem will success in increasing the acceptance rate of the drivers. Moreover, the breakdown of the initial problem
shows the complexity of the industry and especially on the Dubai market. Further research
There are fields that should be taken into account when continuing the research. One of the major fields is to include scheduling of the drivers in the model and not only manage the supply
real-time. Another area is to
incorporate traffic in the model as this has a large impact on the time to customer. Further peak analysis should be made to calibrate and develop more accurate demand models. Another part of that is to have dynamic clusters updating continuously. Conclusively the supply positioning model could include a large set of additional parameters not discussed or measured in this project. Jörgen Olsson Erik Rignér Lund University Faculty of Engineering % Match % Trips % 15min Av. time < Jan15 55.18 % 30.27 % 16.70 % 36mi n Apr 16- 29 88.23% 64.42% 43.65% 22min