CESIS Electronic Working Paper Series
Paper No. 300
Regional Variation of Returns to Education
Mikaela Backman
March, 2013
The Royal Institute of technology Centre of Excellence for Science and Innovation Studies (CESIS) http://www.cesis.se
2
Regional Variation of Returns to Education
Mikaela Backman
Jönköping International Business School
Centre for Entrepreneurship and Spatial Economics (CEnSE)
P. O. Box 1026 SE-551 11, Jönköping, Sweden Telephone: +46 (0) 36 10 17 46
Fax: +46 (0) 36 12 18 32 mikaela.backman@jibs.hj.se
ABSTRACT
Returns to education are mainly influenced by the characteristics of the individual. However, returns are also likely to depend on location characteristics. Thus, there are different location premiums for educational attainment. This paper analyse the regional variation of returns to education where Swedish municipal markets are divided into four categories based on size and commuting patterns. Through the obtained results, the often-assumed hypothesis of equal returns to education for all regions in a country can be rejected. Highest returns to education are found in municipalities in metropolitan functional regions and the lowest in peripheral municipalities in small functional regions.
Keywords: returns to education, regional attributes, fixed-effects model JEL classification codes: H52, I21, I22, J61, R11
Acknowledgments: Financial support from Sparbankernas Forskningsstiftelse is gratefully acknowledged. The author has also received financial support from the Centre of Excellence for Science and Innovation Studies (CESIS) and the Centre for Entrepreneurship and Spatial Economics (CEnSE) as well as intellectual stimuli from the associate researchers. I especially thank Lina Bjerke for support and helpful comments.
3
1. Introduction
Returns to education have been extensively analysed since the 1960s and provides insights into how societies reward education. There are several aspects of returns to education such as social, individual, regional, and national.1 Most studies tend to focus on the cross-country variation in returns to education. This paper adds
to the existing literature by focusing on variation across regions within a country. The purpose is to provide a description of how returns to education in Sweden vary by the type of location. Knowledge concerning the regional differences in returns to education provides insights into the geographical spread of human capital since the location decision of individuals is influenced by the returns to education. This is important since the distribution and location of educated individuals is an important factor for regional well-being. Educated individuals are associated with productivity externalities, consumption externalities, and economic growth.
Returns to education are expected to vary across locations due to location-specific factors such as market potential, size and labor market structure, and access to amenities. In other words, workers with similar jobs and educational levels have different wage levels due to different location premiums (Hanushek, 1973; Farber and Newman, 1987; Asplund and Pereira, 1999; Black et al., 2009). Differences in returns to education can exist in a general equilibrium since firm and household amenities vary over space and therefore create differences in wage and rent compensation (Roback, 1982). The findings in this paper are those of a partial equilibrium since only wages are considered.
In this paper, a distinction is made between metropolitan municipalities, central municipalities in functional regions, peripheral municipalities in larger functional regions, and peripheral municipalities in small functional regions.2 Using this approach, the marginal effects can be identified in a Mincerian wage type equation
through a fixed-effects model controlling for unobserved individual ability. Further, this paper adds to the existing literature by estimating wage premiums for various levels of education for different location categories.
The results show that returns to education differ with the type of location. Conclusively, the results in this paper highlight the importance of controlling for the location when measuring the returns to education. Individuals living in municipalities in metropolitan functional regions have the highest returns to education. These regions have a more diversified labor market, yielding more career opportunities and a larger share of highly educated individuals, which may increase knowledge spillovers and overall productivity highlighting the importance of agglomeration effects on the returns to education (Fuchs, 1967; Glaeser and Maré, 2001; Yankow, 2006). Individuals living in peripheral municipalities in small functional regions have the lowest returns to education. The difference is statistically significant but of a small magnitude. The small variation of returns to
1 The discussion about whether the social returns to education exceed the private returns is immense and, due to brevity, will not be
presented here; instead see Moretti (2004).
2 A municipality corresponds to the lowest level of government in Sweden. Sweden has 290 municipalities. Functional regions
4
education could be due to the special characteristics of the Swedish labor market, such as a high union membership rate and high levels of collective bargaining coverage leading to reduced wage differentials. Hence, despite the institutional framework there is a significant difference in regional returns to education in Sweden. Another reason is labor supply factors that increase the returns to education in more sparsely populated areas (Adamson et al., 2004; Corcoran et al., 2010).
The remainder of this paper is organized as follows. Section 2 presents the conceptual framework and a discussion on the link between geographical location and wage differentials. Section 3 presents location categories used in the empirical model. Section 4 describes the data, variables, and method. The empirical results are presented in Section 5, and Section 6 concludes the paper.
2. Spatial wage variations
Wage variations across regions arise due to differences in individual productivity, overall regional productivity, and/or lower cost of capital (Glaeser and Maré, 2001). The most prominent factors determining the wage rate are individual characteristics such as educational level, experience level, skills, and inherited abilities (Combes et al., 2008).3 Nevertheless, location characteristics such as labor market conditions, agglomeration economies,
and amenities influence the returns to education (Hanushek, 1973; Farber and Newman, 1987; Asplund and Pereira, 1999; Black et al., 2009).
Differences in wages may arise from differences in productivity stemming from geographical features and local institutions (Combes, et al., 2008). There is an established connection between regional size, per-worker productivity, and wages (Glaeser and Maré, 2001; Yankow, 2006; Combes et al., 2010). Agglomeration factors, such as proximity to customers, information sharing, specialized suppliers, and workers, leads to cost reductions and higher productivity (Marshall 1890; Ciccone and Hall, 1996; Glaeser, 1998).
The theoretical micro-foundations of urban agglomeration economies are discussed in Duranton and Puga (2004) and classified as sharing, matching, and learning mechanisms. The sharing mechanism involves the sharing of indivisible goods and facilities, the gains of input suppliers, the gains of a narrower specialization, and sharing risks. The matching mechanism both involves the quality of the matching and the probability of a match. The probability of receiving a suitable job offer is enhanced in larger market since the number of job openings in a given period is higher (Burdett, 1978). The quality of each match is also influenced by the locational size the quality is a function of the number of individuals in a location (Helsley and Strange, 1990). An improved matching process between jobs and workers enables individuals to be more productive with the same technological set-up (Pissarides, 1979; 1984; 2011).
The learning mechanism involves the accumulation, diffusion and generation of knowledge. Larger agglomerations facilitate the learning process by enabling more frequent face-to-face interaction that foster the
3 There is extensive literature regarding the impact of human capital at the individual level (Schultz 1961; 1975; Becker, 1962; 1964;
5
learning process. Other sources are production externalities such as knowledge spillovers and labor pooling which increase the individual productivity level. Knowledge spillovers are enhanced in large urban areas since job turnovers are more frequent (Andersson and Thulin, 2008). Large urban areas often have a high human capital level that increase the overall productivity and is correlated with higher incomes and job turnover (Becker, 1964; Jacobs, 1969; Lucas, 1988; Rauch, 1993; Moretti, 2004; Finney and Kohlhase, 2008; Abel and Gabe, 2011). The learning effect is also stronger in human-capital-intensive locations (Glaeser, 1998; Glaeser and Resseger, 2010).
Labor markets differ in their demand for and supply of labor which influence the individual wage and produces regional wage differences. Since the demand for different characteristics of individuals differs spatially, the level of those characteristics embodied in individuals across regions may differ as well (Farber and Newman, 1987). Thus, there is a sorting of individuals into different locations. Individuals, especially those with great skills and abilities, tend to agglomerate in large urban locations (Fuchs, 1967; Rauch, 1993; Tabuchi and Yoshida, 2000).
Household amenities are determined by the fixed stock of natural resources and economic size (Ullman, 1954; Bartik and Smith, 1987; Knapp and Graves, 1989; Hellerstein et al., 2002; Chen and Rosenthal, 2008). As a location grow it may increase household amenities by offering a wider range of services and consumer goods, ease of moving around for individuals, access to services and jobs, and higher quality of public services (Glaeser et al., 2001). Pure household amenities tend to increase rents and lower wages (Roback, 1982). Firm amenities, such as proximity to customers and suppliers, both increase the return to land and labor. Factors that influence both household utility and firm profitability increase the rent level and have an ambiguous effect on wages depending on whether the effect is more important for firms or for households (Graves et al., 1999).
3. Classifying locations
In order to test the claim that returns to education differ across locations, Sweden’s municipalities are divided into four categories based on their size and commuting patterns. The categories are defined using the concepts of functional regions. A functional region is normally formed by grouping together several municipalities between which the commuting intensity is high. The functional region form a common market for labor, housing, and household and company services, and provide the home market for most firms. A functional region consists of one central municipality with several surrounding, peripheral, municipalities. A central municipality has the largest number of residents in a functional region and the highest inward commuting in absolute terms.
The categories intend to capture specific regional characteristics affecting returns to education and are the following:
6
1. Metropolitan functional regions: this class contains those municipalities that belong to the functional regions with the three largest cities in Sweden, Stockholm, Gothenburg, and Malmö. There are 61 municipalities in this category. Over 40 percent of the Swedish population lives in these three regions, and the regions account for 50 percent of the total gross regional product in Sweden.
2. Central municipalities: this class contains all central municipalities except the three largest cities in Sweden. 78 municipalities are in this group.
3. Peripheral municipalities in larger functional regions: this class contains the non-central municipalities in functional regions with a population larger than 100 000. The functional regions with the three largest cities are excluded. This is the category containing the largest number of municipalities (102).
4. Peripheral municipalities in small functional regions: this class contains the non-central municipalities in functional regions with a population of less than 100 000. 49 municipalities fall into this category. Even if the two last categories both comprise peripheral municipalities there is a clear difference between the two. The separation between large and small functional regions is motivated by the development conditions of the two types of regions. Larger functional regions have a large central municipality that works as a driving force both for the central and the surrounding municipalities. Small functional regions often lack this shared growth factor (Johansson and Klaesson, 2007).
4. Data, method, and variables
The dataset used in this paper is provided by Statistics Sweden and covers all employees in Sweden for the period 1998 to 2008.4 All industries are incorporated, i.e. there is no distinction between public and private
firms. For each individual, information on age, occupation, residence and work municipality, labor income, and education is available. All employees can be assigned to their employer. For the purpose of this paper only individuals in working age (aged 16 to 65) are selected. The same employee can be traced over the whole period. Consequently, the final number of individuals included in the dataset is roughly 900 000. The individuals dropped from the dataset are those that miss information on some of the variables and are a random sample. The gross income of an individual is registered in the municipality in which the individual lives. No other sources of income (such as income from capital) except labor income are reported. It is not possible to distinguish if the individual works part- or full-time.5 The lion’s share, 96 percent, of the
individuals is born in Sweden, and 52 percent of the individuals in the dataset are men.
4.1 Mincer wage equation, extended
The estimations in this paper are based on one of the wage equation specifications by Mincer (1974). The most frequently used Mincer wage equation relates the logarithm of earnings to years of schooling, years of
4 The dataset has restricted public access.
5 Individuals with a yearly income below SEK 156 000 is therefore removed. This value corresponds to the minimum income required
7
work experience, and years of work experience squared. Due to market frictions and market dynamics there are good arguments to extend the Mincer wage equation according to Equation 1.
(1)
where and is the returns to education and experience, respectively, represents a vector of
control variables related to individual characteristics g, is a firm variable for firm i where individual g works,
and represents a vector of control variables related to municipal characteristics, where the individual
works, and represents a vector of control variables related to municipal characteristics, where the
individual lives. , , and are vectors of parameters, and is the error term.
Two issues need to be discussed and addressed: multicollinearity and endogeneity. When dealing with quadratic terms, multicollinearity is inevitably present. In order to reduce multicollinearity problems, experience has been centered on its mean. By centering, the relationship between high (low) original value and high (low) squared values is reduced and hence also the multicollinearity (Smith and Sasaki, 1979).6
The second problem that needs to be discussed relates to endogeneity. There is an extensive debate regarding measurement errors and failure to control for ability. Assuming that the individual ability, which cannot be captured by education and experience, is time-invariant, its effect can be controlled for by using an individual fixed-effects model. By using a fixed-effects model, only the within-effects from the independent variables are observed for each individual. Hence, the effect of education on wages without any ability bias can be identified. One possible limitation of the fixed-effects approach is that it cannot handle variables with no or few variations over time and as a consequence of this is the estimated parameters become inefficient. As it happens, education has often minor or no variations over time. The within-variation for the education variable in this paper constitutes around five percent of the total variance. This might at first appearance seem low, but due to the large sample there is substantial variation in the education variable. A robust Hausman test rejects a random-effects model suggesting that fixed-effects model should be used.
In the estimations the location choice is assumed to be exogenous. The estimations investigate different location categories so this assumption needs some discussion. Combes et al. (2008), argue that there is a bias if the location choice is driven by the exact wage that the employee can earn at a specific location in a given year but not if the location decision is driven by the location’s average wage. There are also other factors that reduce the bias from this selection process. The migration decision taken by an individual is most likely driven by long-term decisions in which the future expected wage is more important than the wage a particular year
6 The bivariate correlation before centering is around 0.98 for the experience variables. After centering the bivariate correlation is
8
(Topel, 1986). Location decisions are also driven by features such as amenities that are separate from wage influence. The results in Dahl (2002) suggest that this selection bias only has minor effects on returns to education across the states in the United States. The value of the parameter change, but not the difference of returns to education across regional categories.
4.2 Description of variables
Labor income (dependent variable): The gross income, in thousands of Swedish kronor (SEK), that individual g receives at time t, either from labor income or from an active business during the year is used as the dependent variable.
The human capital of individuals is mainly measured through education and experience. Immutable individual characteristics such as gender and country of origin cannot by definition be included in the fixed-effects model.
Education: The independent variable in focus measures the number of years of school education for individual g at time t.
Experience is measured through the age minus years of education minus six and defines a proxy for the general experience or informal training of individual g at time t. This measure is, however, not optimal since it does not take into account participation breaks in the labor force. The function of experience is expected to be concave, so a squared term of the experience is included to allow for decreasing returns (Mincer, 1974).7
Commuting: A dummy variable controls for whether individual g at time t lives and works in different municipalities: 1 for “commutes”, 0 for “does not commute”. This variable partly accounts for the fact that if an individual lives in the periphery and works in the center, the income in the periphery will overstate the benefits of living there.
Industry controls for the industry in which individual g works at time t. Ten groups of industries are distinguished: (1) agriculture and fishery, (2) manufacturing, (3) public utilities, (4) wholesale and retail, (5) transportation, (6) hotels, restaurants and communication, (7) finance, insurance, real estate and law, (8) business services, (9) advanced public health sector, (10) recreation and other public services.
Firm Size: The size of firm i where an individual works at time t is defined as the number of employees at each firm.
Location attributes are in this paper measured at the municipal level in order to capture variation among municipalities in the different categories. In this paper, firm-specific amenities include the proportion of human capital and firm density assigned to the municipality in which the individual works, since these variables influence the work environment and the individual’s productivity ( in Equation 1). Consumer
services amenities deal with the presence of restaurants, culture, and entertainment and are measured at the municipality of residence ( in Equation 1).
9
Size is defined by the total access to the aggregated value of all individuals’ wages (in thousand SEK) for municipality s at time t, a detailed description of the accessibility measure can be found in Johansson et al. (2002; 2003). The accessibility to wages is a proxy for market potential and captures interdependencies among municipalities. By using an accessibility measure, the effect of economic activity in neighboring municipalities and interdependencies among municipalities are captured. This has the attractive property of reducing spatial autocorrelation (Gråsjö, 2005; Andersson and Gråsjö, 2009).The size of a location can represent both firm-specific and household-firm-specific amenities, e.g. consumer services as well as proximity to other firms. The estimations therefore include more measures of firm amenities and consumer services. This variable is assigned to the municipality in which the individual works.8
Human capital intensity: is measured as the proportion of all individuals in municipality s at time t with at least three years of higher education. Three years is a natural threshold, since it normally takes at least three years to acquire a bachelor’s degree. Human capital intensity is often associated with the number of years of formal education (Hanushek and Kim, 1995; Schwerdt and Turunen, 2007). This variable is assigned to the municipality in which the individual works since it is hypothesized to influence the work environment of the individual.
Firm density is measured as the number of employers divided by the population, in municipality s at time t. This variable is used as a proxy for proximity to other firms and potential knowledge spillovers (Ciccone and Hall, 1996). This variable has only effects on firms, i.e. a firm-specific amenity, and is expected to have a positive influence on individual wage. The variable is also a measure of local competition that can foster innovation and innovation spreading (Porter, 1990). This variable is measured at the municipality in which the individual works.
Proportion of employment in culture, restaurants, and entertainment: This variable measures the proportion of employment in residence municipality r at time t in firms with activities in the restaurant, cultural, and entertainment sector (two-digit SIC codes 55-56, 90-93). This variable is aimed at capturing consumption amenities that differ between locations.
Tax level: The tax level in the residence municipality r at time t is measured as the total municipal tax rate in percent of the income that employees pay. This tax rate is set by the local government in each municipality. Table 1 presents the descriptive statistics for the variables in focus: labor income and education, registered at the municipality of residence. It also shows how the wage differs according to educational level and classification of locations.
Table 1 Descriptive statistics
Full sample Municipalities in metropolitan functional regions Central municipalities in functional regions
Mean St. dev Mean St. dev Mean St. dev
Labor incomegt* 335.93 203.08 373.04 270.04 315.09 140.55
10
Educationgt 12.23 2.43 12.61 2.51 12.18 2.40
Mean income by educational level
Senior high school 294.57 122.30 315.40 155.98 283.28 99.59
2 years of university education 350.48 172.84 378.98 210.61 328.94 135.87
Bachelor’s degree 397.00 332.64 447.97 440.68 351.09 162.76
More than 3 years of
university 488.91 320.37 521.96 383.97 456.87 225.63 Research (licentiate, Ph.D.) 547.44 300.35 567.77 344.58 524.31 227.54 N individuals (share of total) 905 892 (100) 358 862 (43) 277 177 (33) N municipalities (share of total) 290 (100) 61 (21) 78 (27)
Peripheral municipalities, large functional
regions Peripheral municipalities, small functional regions
Mean St. dev Mean St. dev
Labor incomegt* 298.41 115.18 291.24 104.59
Educationgt 11.57 2.14 11.37 2.08
Mean income by educational level
Senior high school 280.23 86.01 276.85 83.55
2 years of university education 322.41 118.41 317.84 117.80
Bachelor’s degree 338.49 149.42 328.02 139.52
More than 3 years of
university 435.86 243.26 416.98 193.88 Research (licentiate, Ph.D.) 500.76 208.19 523.83 247.74 N individuals (share of total) 141 569 (17) 57 751 (7) N municipalities (share of total) (35) 102 (17) 49
*Yearly income, in thousands of SEK. The median is below the mean for the labor income and education variables in all categories.
The average length of education for the full sample is roughly 12 years. Thus, the average individual in the sample has completed senior high school. In Sweden, nine years of schooling are compulsory. In reality, over 99 percent enroll in 12 years of schooling and approximately 84 percent complete senior high school. The average education and yearly income are highest in municipalities in metropolitan functional regions and fall with declining size. The same pattern can be found when looking at the different educational levels; individuals living in municipalities in metropolitan functional regions have the highest overall income regardless of educational level. All individuals do however increase their income as their educational level increases irrespective of where they live. The income range increases as the educational level increases for all classifications of locations except for municipalities in metropolitan functional regions. The widest income range is in the metropolitan functional regions for individuals with a bachelor’s degree.
Approximately 16 percent of the sample has changed location in terms of changing residence municipality one or several times during the period 1998 to 2008. There is a considerably smaller amount of individuals that have changed category classification, approximately eight percent. Individuals who have changed location during the period investigated are not included in the different location categories to avoid wage premiums arising from a change in location, for example an individual moves from Stockholm and experience a higher wage level in the new location (Glaeser and Maré, 2001). Hence, the returns to education in this paper are estimated for stayers. The total number of individuals in the different locational categories therefore does not
11
add up to the total number of individuals in the full sample. The movers are on average younger, more educated and have a higher income. The difference in the returns to education for the movers compared to stayers in the full sample is 0.005, where movers have the higher return. Across the regional categories the difference is between 0.00007 to 0.0004. The smallest difference is for the peripheral municipalities in larger functional regions. The returns to education for stayers are lower for all categories except for peripheral municipalities in small functional regions.
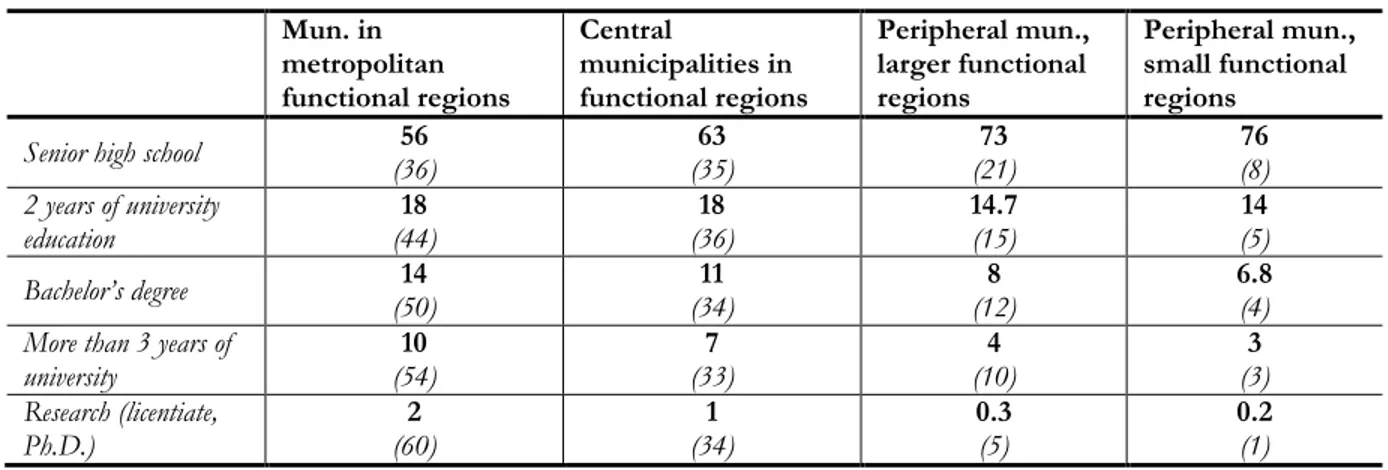
Several studies have identified a self-selection of skilled and able individuals towards large urban locations and metropolitan regions (Marshall 1890; Fuchs, 1967; Tabuchi and Yoshida, 2000). If the same tendency can be found in Sweden is examined using the relative shares of individuals in each educational category (rows) and location categories (columns), presented in Table 2.
Table 2 Educational attainments in different regional categories, relative shares Mun. in metropolitan functional regions Central municipalities in functional regions Peripheral mun., larger functional regions Peripheral mun., small functional regions
Senior high school (36) 56 (35) 63 (21) 73 (8) 76
2 years of university
education (44) 18 (36) 18 14.7 (15) (5) 14
Bachelor’s degree (50) 14 (34) 11 (12) 8 6.8 (4)
More than 3 years of
university (54) 10 (33) 7 (10) 4 (3) 3
Research (licentiate,
Ph.D.) (60) 2 (34) 1 0.3 (5) 0.2 (1)
Table 2 shows that highly educated individuals have a higher representation in municipalities in metropolitan functional regions. 60 percent of all individuals that have a research degree are located in these regions. Such regions attract individuals by supplying urban amenities and a diverse and broad labor market. Individuals with a higher education are in particular attracted to these locations and have overall a higher mobility rate (Borjas, 2002). Individuals living in municipalities in the metropolitans region are fairly speared out across the different educational attainments. A completely different story is identified in peripheral regions, almost 90 percent of the individuals have an education below two years of university education. Thus, the supply of highly educated individuals is skewed towards the metropolitan functional regions.
5. Analysis
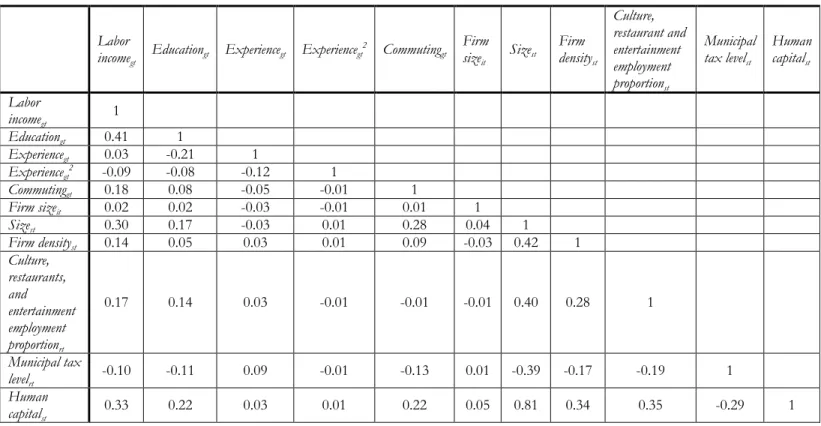
A two-way fixed-effects model is used to estimate the coefficients of Equation 1. The variables controlling for municipal size and human capital intensity have been separated into two specifications due to a high correlation; see correlation matrix in the Appendix, Table A1. The estimation including the size of municipalities is presented in Table 3. The specification including the human capital intensity can be found in Table A2 in the Appendix. The Appendix also includes estimations based on pooled OLS and random-effects
12
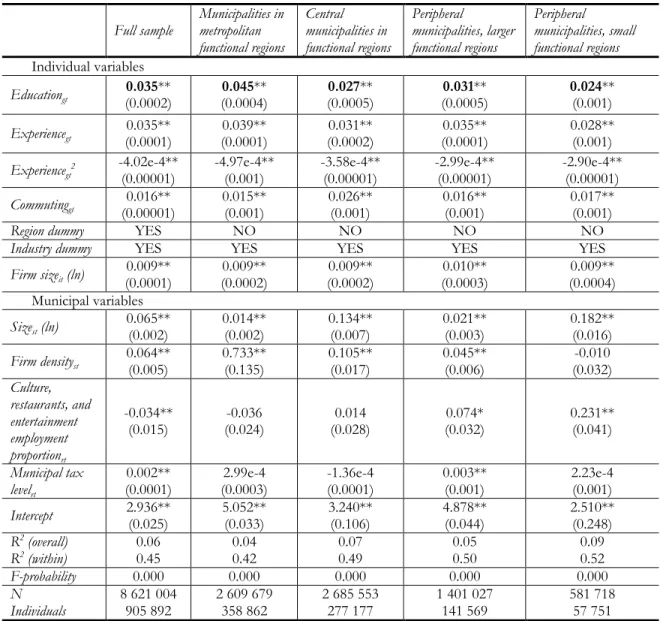
model, Table A3. Due to the large number of observations, it is practically impossible to correct for spatial correlation at the individual level. It is perhaps more likely that there is spatial correlation among groups of individuals, i.e. they are clustered in some sense. Since the focus in this paper is not on the spatial aspect of the data per se, standard errors are clustered to reduce the spatial effect (Bertrand et al., 2004; Kézdi, 2004). Table 3 Regression results for full sample and locational categories, two-way fixed-effects estimation, 1998 to 2008. Dependent variable:Labor income (ln)
Full sample Municipalities in metropolitan functional regions Central municipalities in functional regions Peripheral municipalities, larger functional regions Peripheral municipalities, small functional regions Individual variables Educationgt (0.0002) 0.035** (0.0004) 0.045** (0.0005) 0.027** (0.0005) 0.031** 0.024** (0.001) Experiencegt (0.0001) 0.035** (0.0001) 0.039** (0.0002) 0.031** (0.0001) 0.035** 0.028** (0.001)
Experiencegt2 -4.02e-4** (0.00001) -4.97e-4** (0.001) -3.58e-4** (0.00001) -2.99e-4** (0.00001) -2.90e-4** (0.00001)
Commutinggt (0.00001) 0.016** 0.015** (0.001) 0.026** (0.001) 0.016** (0.001) 0.017** (0.001)
Region dummy YES NO NO NO NO
Industry dummy YES YES YES YES YES
Firm sizeit (ln) (0.0001) 0.009** (0.0002) 0.009** (0.0002) 0.009** (0.0003) 0.010** (0.0004) 0.009** Municipal variables Sizest (ln) 0.065** (0.002) 0.014** (0.002) 0.134** (0.007) 0.021** (0.003) 0.182** (0.016) Firm densityst 0.064** (0.005) 0.733** (0.135) 0.105** (0.017) 0.045** (0.006) (0.032) -0.010 Culture, restaurants, and entertainment employment proportionrt -0.034** (0.015) (0.024) -0.036 (0.028) 0.014 (0.032) 0.074* 0.231** (0.041) Municipal tax levelrt 0.002**
(0.0001) (0.0003) 2.99e-4 -1.36e-4 (0.0001) 0.003** (0.001) 2.23e-4 (0.001)
Intercept 2.936** (0.025) 5.052** (0.033) 3.240** (0.106) 4.878** (0.044) 2.510** (0.248) R2 (overall) R2 (within) 0.06 0.45 0.04 0.42 0.07 0.49 0.05 0.50 0.09 0.52 F-probability 0.000 0.000 0.000 0.000 0.000 N Individuals 8 621 004 905 892 2 609 679 358 862 2 685 553 277 177 1 401 027 141 569 581 718 57 751
**Significant at one percent, * significant at five percent. Cluster standard errors in parentheses to control for heteroscedasticity. The estimations have also been performed for the period 1998-2007 in order to test if the crisis in 2008 had any effect on the estimations; the results are robust.
13
5.1 Spatial variation in returns to education
The intercept gives the average value of the fixed effects. The highest value is found for municipalities in metropolitan functional regions and lowest for peripheral municipalities in small functional regions. The intercept ranking follows the same pattern of the income levels from the descriptive statistics in Table 1. The return to education, represented by in Equation 1, is positive and significant for all specifications. As expected an extra year of education has a positive effect on income. The returns to education across the different categories are statistically different from each other. This is confirmed by looking at the confidence intervals and by a Chow test of equality of coefficients.
The highest value for returns to education appears for individuals living in municipalities in metropolitan functional regions. These municipalities are characterized by high levels of urban amenities such as entertainment, consumption opportunities, and culture that are valued by individuals and in particular those with a higher education level (Adamson et al., 2004). There is also a broader job variety, giving individuals access to a wider range of potential jobs in their field of expertise and better opportunities of making a career. Individuals in city regions also tend to be more productive than those in rural areas since the interaction possibilities are enhanced and by this potential knowledge spillovers and information transfers. Firm-amenity and consumer services are partly controlled for by including proxies for these as independent variables. Even though there is a large supply of highly educated individuals in municipalities in metropolitan regions that puts a downward pressure on wages, the demand for these individuals from firms increases the wages. The positive effects outweigh the higher wages they have to pay for the highly educated individuals; if this were not the case, private firms would relocate.
The lowest returns to education are found for individuals living in peripheral municipalities in small functional regions. These municipalities are characterized by low levels of urban amenities and their labor markets are small and homogenous. These are factors that tend to repel individuals. These regions also tend to lack firm-specific amenities. All taken together, these factors lower the return to education. These regions do, however, often provide more and a broader range of natural amenities that are valuable for individuals.9
The difference in returns to education is quite small, approximately 0.02 between the highest and lowest value. Even so, that there exist regional differences in a country with a low wage variance emphasizes the robustness and strength of regional differences in returns to education. The small range of estimates suggests that even though the location factor is important and produces significant different returns to education, there are other effects that explain the large wage difference among urban and rural areas. One explanation is the sorting effect where skill-intensive and hardworking individuals tend to cluster in normally larger urban locations (Glaeser and Maré, 2001; Rosenthal and Strange, 2003; Combes, et al., 2008) based not on the returns to education but perhaps on other factors such as urban amenities. Further, regions with a large and
9 Average temperature, average rainfall, crime level, share of land used for recreational use, and share of land with lake or ocean access
14
diverse labor market offer better career opportunities in terms of the number of job opportunities and advancement opportunities and not just in terms of the prospect of initially higher wages. This aspect is especially important for married couples where both spouses have a higher education, i.e. “power couples”. The dual career opportunities play a significant role in their location decision (Costa and Kahn, 2000). Firms in locations with a homogenous and small labor market, e.g. peripheral municipalities, may therefore need to pay higher wages to compensate individuals for the lack of career opportunities, for individuals and couples (Corcoran, et al., 2010). Thus, firms need to reward individuals with relatively high wages in order to attract them to a certain location. This might be particularly true in the case of highly educated individuals, since these individuals tend to be more mobile and more attracted to large urban settings. This might explain the small difference in returns to education between the metropolitan functional regions and the peripheral municipalities in small functional regions.
The returns to education for individuals in the different location categories imply that an additional year of education increases an average individual’s yearly income by approximately 16 500 SEK in municipalities in metropolitan functional regions, 8 500 SEK in central municipalities in functional regions, 9 300 SEK in peripheral municipalities in large functional regions and 7 000 SEK in peripheral municipalities in small functional regions. The calculations only consider the returns of education for an individual and not the discount rate or the precise shape of each individual’s earnings function (Hanushek, 1973). These figures should be viewed as an indication and not as absolute values but give a striking picture of the value of one additional year of education. The effects are more than twice as large in municipalities in metropolitan functional regions than in peripheral municipalities in small functional regions.
The industry structure in a region might also influence the returns to education. The location decisions of private and public firms are not based on the same criterion. A private firm can choose the location most suitable for its core activities. Thus, the private sector is market-driven in its location decisions. Wage differentials in the private sector are most likely driven by labor demand-side factors such as spillovers and agglomeration effects. The public sector is population-driven and must be located all over Sweden in order to provide services to the inhabitants. Wage differentials in the public sector may be driven by labor supply-side factors such as amenities appreciated by workers. In order to attract individuals to less attractive locations the individuals must be compensated with a higher wage. One example of this is the value of the industry dummy representing the advanced public health sector. The value of the dummy is highest in the peripheral locations, indicating that individuals in these occupations in peripheral locations earn a relatively higher wage. The public sector has to supply services in all locations and, in order to attract individuals, particularly those with a high level of human capital, to remote locations they need to increase wages (Corcoran, et al., 2010).
To illustrate differences between the levels of education and location categories, a comparison is made between five different educational levels: senior high school (base), two years of university education, three years of university education, more than three years of university education, and research degree (licentiate or
15
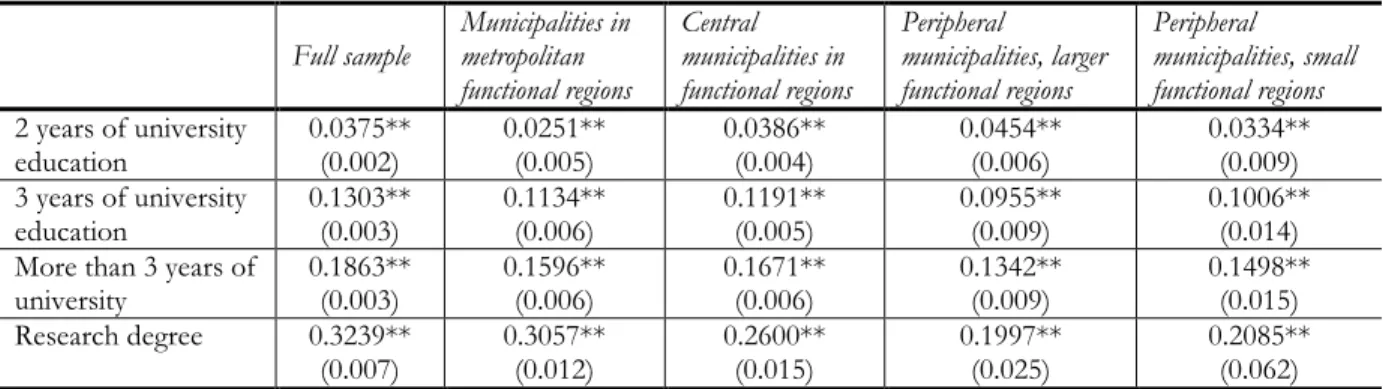
PhD). This allows a more complete picture of the differences in returns to education. The same estimation as presented in Table 3 was performed, but instead of the continuous number of years in education, dummy variables are used for different educational levels. This follows an approach similar to that of Goetz and Rupasingha (2003). The results for the dummy variables are presented in Table 4. The other variables have the same magnitude and significance level as reported in Table 3.
Table 4 Income increases of educational degrees, dummy variables representing five educational degrees, all location classifications. Dependent variable:Labor income (ln)
Full sample Municipalities in metropolitan functional regions Central municipalities in functional regions Peripheral municipalities, larger functional regions Peripheral municipalities, small functional regions 2 years of university education 0.0375** (0.002) 0.0251** (0.005) 0.0386** (0.004) 0.0454** (0.006) 0.0334** (0.009) 3 years of university education 0.1303** (0.003) 0.1134** (0.006) 0.1191** (0.005) 0.0955** (0.009) 0.1006** (0.014)
More than 3 years of
university 0.1863** (0.003) 0.1596** (0.006) 0.1671** (0.006) 0.1342** (0.009) 0.1498** (0.015)
Research degree 0.3239**
(0.007) 0.3057** (0.012) 0.2600** (0.015) 0.1997** (0.025) 0.2085** (0.062)
**Significant at one percent. Cluster standard errors in parentheses to control for heteroscedasticity.
The results in Table 4 show that there are differences between educational levels and location categories. Differences in educational level generate the expected effects, i.e. higher educational levels generate higher incomes. Naturally, incomes can also vary between occupations within a municipality, but this is the general picture. There are, however, some differences between locations. There is not one regional category that has the overall highest premiums for all educational levels. The lowest educational degree has the highest reward in peripheral municipalities in large functional regions. Individuals living in central municipalities experience a high premium for university studies above three years but below the research degree. The highest premium for a research degree is paid to individuals living in municipalities in metropolitan functional regions. The premium is considerably smaller in peripheral municipalities. In the case of individuals living in peripheral municipalities in small functional regions, there is a relatively large premium for all educational levels below a research degree and in particular for the lower levels of education. The dummy indicating the research degree could be misleading especially for peripheral municipalities due to the low number of observations. The overall picture is that lower levels of education, up to three years of higher education, is more rewarded in peripheral municipalities. The highest level of education is on the other hand more rewarded in urban locations.
5.2 Control variables
Individual predictors: Experience raises an individual’s income, but at a decreasing rate. As individuals become more experienced, older, their wage growth might increase at a slower pace due to lower job turnover and/or due to a decrease in productivity growth. The returns to experience follow the same pattern as the returns to education. An individual gains the most from acquiring an extra year of experience if he/she lives in a municipality in metropolitan functional regions. The diminishing effect is also largest in this regional category and
16
lowest in peripheral municipalities in small functional regions. The effects of informal training or learning by doing are hence larger in these municipalities. Individuals also have access to a larger labor market where this experience is more valued, if they want to change their job.
Commuting is positively associated with the labor income for all estimations. Thus, by commuting, an individual reaches a job with a higher income. If the individual did not receive a higher income by commuting, it is not likely that the individual would choose to commute. By commuting in peripheral municipalities and in metropolitan functional regions individuals reach a larger and more diversified labor market. The parameter is surprisingly large for those living in central municipalities in functional regions. The commuting variable cannot only be interpreted as a cost since it incorporates the benefits from working and living in different locations.
The gender dummy, in the random-effects model and pooled OLS, is positive for all classifications. Men overall receive a higher income than women irrespective of location, and this finding is consistent with earlier studies (Blau and Kahn, 1994; Albrecht et al., 2003). This could be due to the fact that women more often work part-time, to discrimination, or to women being more represented in occupations where the wage level is commonly lower, such as in the public sector. By further examining this, the dataset is divided by gender and estimated through a fixed-effects model. The results show that the returns to education are larger for women in all location classifications, a result found in earlier studies (Psacharopoulos and Patrinos, 2004), even though the difference is small. The small difference for Sweden is confirmed by other studies (Harmon et al., 2003). The difference is largest for individuals in peripheral municipalities in small functional regions. Men and women living in municipalities in metropolitan functional regions experience similar returns from investments in education. The dummies controlling for country of origin have the same impact in all estimations. A country of origin other than Sweden has a negative impact. These discrepancies may be caused by the level of language proficiency, lack of experience of the Swedish labor market, cultural barriers, or discrimination.
Firm predictor: The effect of size of firms is positive and of the same magnitude for individuals in all locations. The tendency that larger firms pay higher wages has several explanations: more qualified employees, higher productivity, a more stable workforce, market power allowing firms to share the profits among their workers, compensation of workers for bad working environments, and matching of high-skilled workers (Lallemand et al., 2005). That larger firms tend to pay higher wages is supported by numerous studies (Brown and Medoff, 1989; Idson and Oi, 1999; Lallemand, et al., 2005).
Municipal predictors: The size of a municipality has a positive influence in all estimations. There is a well-established connection between size of locations and labor income, i.e. urban wage premium (Glaeser and Maré, 2001; Yankow, 2006; Combes et al., 2010). The accessibility measure captures the interdependence across municipalities since it weights the market potential in all municipalities by a distance decay function. Accessibility to wages has a high correlation with density measures such as population density, and has been used as a density measure in previous studies (Andersson and Noseleit, 2011).
17
An individual in a human capital-rich location earns a higher wage compared to a similar individual in a less human capital rich location. To work in a municipality with a high proportion of highly educated individuals is positively related to an individual’s income. Similar results are found in Rauch (1993), Acemoglu and Angrist (2004), and Moretti (2004). This effect may arise from spillover effects from other educated individuals, which increases individual productivity. Individuals also tend to learn more from each other in regions with a higher proportion of skilled individuals (Glaeser, 1998). Hence, there are productivity externalities arising from human capital. The increase in the wage due to a higher overall level of human capital comprises besides spillovers the complementarity effect across individuals with different level of human capital (Moretti, 2004). The size of the effect is largest for peripheral municipalities in small functional regions. Since the municipalities are divided into four categories, the variance of the municipal variables is limited for some categories. For example, the size measure, access to wages, has a smaller variance across municipalities in metropolitan functional regions. This can be the reason why an increase in the size measure has a smaller impact on wages in metropolitan functional regions. The overall size is large and an increase therefore has minor effects.
The firm density variable is positive and significant for all specifications except for individuals living in peripheral municipalities in small functional regions. The magnitude of this variable is largest for municipalities in metropolitan functional regions and falls with decreasing size. Thus, it follows a hierarchical structure. The proxy for household amenities, i.e. the proportion of culture, restaurants, and entertainment employment, has a significant negative influence on income for all individuals. Individuals “pay” to live in pleasant locations by accepting a lower wage, consistent with expectations and other studies (Blomquist et al., 1988; Tabuchi and Yoshida, 2000). This variable is, however, positive for peripheral regions indicating that this feature increases the wage. One potential problem regarding amenities is that they vary within locations (Cho et al., 2008). Thus, when aggregated to the municipal level, only the average effect from the variable is captured and there is less variation across municipalities. There might however be differences within the municipality. The municipal tax level is positive and significant for peripheral municipalities in large functional regions. A positive variable was unexpected but the magnitude is small and close to zero.
6. Conclusions
This paper concludes that there is significant variation in returns to education across locations in Sweden. Thus, rates of return are dependent on location-specific factors and differ across location categories. Analysis of returns to education becomes unreliable if the location is not considered or controlled for.
The largest returns to education are found for individuals living in municipalities in metropolitan functional regions. These regions attract a large number of highly educated individuals, are characterized by a high level of human capital, have a dense economic environment and a more diversified labor market compared to other
18
parts of the country, and offer a variety of urban amenities. These are all factors that increase an individual’s wage. Individuals living in peripheral municipalities in small functional regions have the lowest returns to education.
The difference in returns to education is statistically significant but of a small magnitude. The Swedish educational system, decentralization of higher educational institutions, and a long tradition of wage equalization may have a smoothing effect on the regional differences in returns to education. That there still exist regional differences of the returns to education, given the institutional setting in Sweden, strengthen the finding that location premiums are important. The result is most likely applicable in other countries where the wage differentials are not as compressed as in Sweden.
Another reason for the low difference is that individuals with a higher education are often compensated in rural municipalities for lack of career opportunities and urban amenities. In order to have positive in-migration of highly educated individuals, wages must be increased. Thus, the results emphasize the well-established importance of firm demand factors such as agglomeration and knowledge spillovers in metropolitan regions. In addition, this paper emphasizes that other factors, such as labor supply conditions in small peripheral regions, increase returns to education – a point often neglected in other studies.
From a policy perspective, it is important to understand the motives that attract educated individuals to different locations, since the benefits from having access to educated individuals are well documented. One of these factors that influence the location choice is the return to education. The return to education is mainly determined by individual characteristics, but the economic environment is also important. The return to education can be used as an incentive for individuals to invest in education and hence their human capital. Thus, policies should be designed in such a manner that individuals in peripheral locations perceive the benefits of this investment since the differences between different locations are relatively small.
By analyzing the regional returns to education in other countries, a more detailed picture of specific factors could be displayed. It would then be possible to find patterns that are region- and/or location-specific instead of country-location-specific aggregates. It is also interesting to investigate the wage premium individuals experience as they move up or down in the hierarchical level.
References
Acemoglu, D., and Angrist, J. (2004). How Large are the Social Returns to Education? Evidence from Compulsory Schooling Laws. In D. Acemoglu (Ed.), Recent Developments in Growth Theory. Cheltenham, UK: Edward Elgar Publishing.
Abel, J. R., and Gabe, T. M. (2011). Human Capital and Economic Activity in Urban America. Regional Studies, 45(8), 1079-1090.
Adamson, D. W., Clark, D. E., and Partridge, M. D. (2004). Do Urban Agglomeration Effects and Household Amenities have a Skill Bias? Journal of Regional Science, 44(2), 201-224.
19
Albrecht, J., Björklund, A., and Vroman, S. (2003). Is There a Glass Ceiling in Sweden? Journal of Labor Economics, 21(1), 145-177.
Andersson, M., and Gråsjö, U. (2009). Spatial dependence and the representation of space in empirical models. Annals of Regional Science, 43(1), 159-180.
Andersson, M., and Noseleit, F. (2011). Start-ups and employment dynamics within and across sectors. Small Business Economics, 36(4), 461-483.
Andersson, M., and Thulin, P. (2008). Globalisering, arbetskraftens rörlighet och produktivitet: Globaliseringsrådet, Underlagsrapport 23.
Asplund, R., and Pereira, P. T. (Eds) (1999). Returns to Human Capital in Europe: A Literature Review. Helsinki: Taloustieto Oy.
Bartik, T. J., and Smith, V. K. (1987). Urban Amenities and Public Policy. In E. S. Mills (Ed.), Handbook of Regional and Urban Economics Volume II (pp. 271-318). Cheltenham, U.K.: Elsevier Science Publishers. Becker, G. S. (1962). Investment in Human Capital: A Theoretical Analysis. Journal of Political Economy, 70(5,
Part 2), 9-49.
Becker, G. S. (1964). Human Capital: A Theoretical and Empirical Analysis with Special Reference to Education. Chicago, IL: Chicago University Press.
Bertrand, M., Duflo, E., and Mullainathan, S. (2004). How Much Should we Trust Difference-in-Difference Estimates? Quarterly Journal of Economics, 119(1), 249-275.
Black, D. A., Kolesnikova, N., and Taylor, L. (2009). Earnings Functions When Wages and Prices Vary by Location. Journal of Labor Economics, 27(1), 21-47.
Blau, F. D., and Kahn, L. M. (1994). Rising Wage Inequality and the U.S. Gender Gap. The American Economic Review, 84(2), 23-28.
Blomquist, G. C., Berger, M. C., and Hoehn, J. P. (1988). New Estimates of Quality of Life in Urban Areas. The American Economic Review, 78(1), 89-107.
Borjas, G. J. (2002). Labor Economics. Singapore: McGraw-Hill
Brown, C., and Medoff, James L. (1989). The Employer Size-Wage Effect. Journal of Political Economy, 97(5), 1027-1059.
Burdett, K. (1978). A Theory of Employee Job Search and Quit Rates. American Economic Review, 68(1), 212-220.
Chen, Y., and Rosenthal, S. S. (2008). Local amenities and life-cycle migration: Do people move for jobs or fun? Journal of Urban Economics, 64(3), 519-537.
Cho, S.-H., Poudyal, N. C., and Roberts, R. K. (2008). Spatial analysis of the amenity value of green open space. Ecological Economics, 66(2–3), 403-416.
Ciccone, A., and Hall, R. E. (1996). Productivity and the Density of Economic Activity. American Economic Review, 86(1), 54-70.
20
Combes, P.-P., Duranton, G., and Gobillon, L. (2008). Spatial wage disparities: Sorting matters! Journal of Urban Economics, 63(2), 723-742.
Combes, P.-P., Duranton, G., Gobillon, L., and Roux, S. (2010). Estimating Agglomeration Economies with History, Geology, and Worker Effects. In E. L. Glaeser (Ed.), Agglomeration Economics (pp. 15-66). Chicago: University of Chicago Press.
Corcoran, J., Faggian, A., and McCann, P. (2010). Human Capital in Remote and Rural Australia: The Role of Graduate Migration. Growth and Change, 41(2), 192-220.
Costa, D. L., and Kahn, M. E. (2000). Power Couples: Changes in the Locational Choice of the College Educated, 1940–1990. Quarterly Journal of Economics, 115(4), 1287-1315.
Dahl, G. B. (2002). Mobility and the Return to Education: Testing a Roy Model with Multiple Markets. Econometrica, 70(6), 2367-2420.
Duranton, G., and Puga, D. (2004). Micro-foundations of urban agglomeration economies. In J. V. Henderson and J.-F. Thisse (Eds.), Handbook of Regional and Urban Economics (Vol. Volume 4, pp. 2063-2117). Amsterdam: Elsevier.
Farber, S. C., and Newman, R. J. (1987). Accounting for South/Non-South Real Wage Differentials and for Changes in Those Differentials over Time. Review of Economics and Statistics, 69(2), 215-223.
Finney, M. M., and Kohlhase, J. E. (2008). The Effect of Urbanization on Labor Turnover. Journal of Regional Science, 48(2), 311-328.
Fuchs, V. R. (1967). Differentials in hourly earnings by region and city size (Vol. Occasional paper 101). New York: National Bureau of Economic Research.
Glaeser, E. L. (1998). Are Cities Dying? Journal of Economic Perspectives, 12(2), 139-160.
Glaeser, E. L., Kolko, J., and Saiz, A. (2001). Consumer city. Journal of Economic Geography, 1(1), 27-50. Glaeser, E. L., and Maré, D. C. (2001). Cities and skills. Journal of Labor Economics, 19(2), 316-342.
Glaeser, E. L., and Resseger, M. G. (2010). The Complementarity Between Cities and Skills. Journal of Regional Science, 50(1), 221-244.
Goetz, S. J., and Rupasingha, A. (2003). The Returns on Higher Education: Estimates for the 48 Contiguous States. Economic Development Quarterly, 17(4), 337-351.
Graves, P., Arthur, M. M., and Sexton, R. L. (1999). Amenities and the labor earnings function. Journal of Labor Research, 20(3), 367-376.
Gråsjö, U. (2005). Spatial Spillovers of Knowledge Production: An Accessibility Approach. Ph.D. Dissertation, Jönköping International Business School Dissertation Series No. 034, Jönköping.
Hanushek, E. A. (1973). Regional Differences in the Structure of Earnings. Review of Economics and Statistics, 55(2), 204-213.
Hanushek, E. A., and Kim, D. (1995). Schooling, Labor Force Quality, and Economic Growth. New York, NY: National Bureau of Economic Research Working Paper No. W5399.
21
Harmon, C., Oosterbeek, H., and Walker, I. (2003). The Returns to Education: Microeconomics. Journal of Economic Surveys, 17(2), 115-156.
Hellerstein, D., Nickerson, C., Cooper, J., Feather, P., Gadsby, D., Mullarkey, D., . . . Barnard, C. (2002). Farmland Protection: The Role of Public Preferences for Rural Amenities Agricultural Economic Report No. 815. Washington, DC: Economic Research Services, U.s. Depatment of Agriculture.
Helsley, R. W., and Strange, W. C. (1990). Matching and agglomeration economies in a system of cities. Regional Science and Urban Economics, 20(2), 189-212.
Idson, T. L., and Oi, W. Y. (1999). Workers Are More Productive in Large Firms. American Economic Review, 89(2), 104-108.
Jacobs, J. (1969). The Economy of Cities. New York, NY: Random House
Johansson, B., and Klaesson, J. (2007). Infrastructure, Labour Market Accessibility and Economic Development. In C. Karlsson, W. P. Andersson, B. Johansson and K. Kobayashi (Eds.), The management and Measurement of Infrastructure: Performance, Efficiency and Innovation (pp. 69-98). Cheltenham, UK: Edward Elgar Publishing.
Johansson, B., Klaesson, J., and Olsson, M. (2002). Time distances and labor market integration. Papers in Regional Science, 81(3), 305-327.
Johansson, B., Klaesson, J., and Olsson, M. (2003). Commuters’ non-linear response to time distances. Journal of Geographical Systems, 5(3), 315-329.
Kézdi, G. (2004). Robust standard error estimation in Fixed-Effects panel models. Hungarian Statistical Review, Special number 9, 95-116.
Knapp, T. A., and Graves, P. E. (1989). On the Role of Amenities in Models of Migration and Regional Development. Journal of Regional Science, 29(1), 71-87.
Lallemand, T., Plasman, R., and Rycx, F. (2005). Why do large firms pay higher wages? Evidence from matched worker-firm data International Journal of Manpower, 26(7-8), 705-723.
Lucas, R. E. J. (1988). On the mechanics of economic development. Journal of Monetary Economics, 22(1), 3-42. Marshall, A. (1890). Principles of Economics: An Introductory Volume. London: Macmillan.
Mincer, J. (1962). On-the-Job Training: Costs, Returns, and Some Implications. Journal of Political Economy, 70(5, Part 2), 50-79.
Mincer, J. (1974). Schooling, Experience, and Earnings. Human Behavior & Social Institutions No. 2. New York, NY: National Bureau of Economic Research.
Moretti, E. (2004). Estimating the social return to higher education: evidence from longitudinal and repeated cross-sectional data. Journal of Econometrics, 121(1-2), 175-212.
Nelson, R. R., and Phelps, E. S. (1966). Investment in Humans, Technological Diffusion, and Economic Growth. American Economic Review, 56(1-2), 69-75.
22
Pissarides, C. A. (1979). Job Matchings with State Employment Agencies and Random Search. The Economic Journal, 89(356), 818-833.
Pissarides, C. A. (1984). Search Intensity, Job Advertising, and Efficiency. Journal of Labor Economics, 2(1), 128-143.
Pissarides, C. A. (2011). Equilibrium in the Labor Market with Search Frictions. American Economic Review, 101(4), 1092-1105.
Psacharopoulos, G., and Patrinos, H. A. (2004). Returns to investment in education: a further update. Education Economics, 12(2), 111-134.
Rauch, J. E. (1993). Productivity Gains From Geographic Concentration of Human Capital: Evidence From the Cities. Jornal of Urban Economics, 34, 380-400
Roback, J. (1982). Wages, Rents, and the Quality of Life. Journal of Political Economy, 90(6), 1257-1278.
Rosenthal, S. S., and Strange, W. C. (2003). Agglomeration, Labor Supply, and the Urban Rat Race: Center for Policy Research, Paper 106, Syracuse University.
Schultz, T. W. (1961). Investment in Human Capital. American Economic Review, 51(1), 1-17.
Schultz, T. W. (1975). Economics of the Family: Marriage, Children and Human Capital. Chicago, IL and London, UK: University of Chicago Press.
Schwerdt, G., and Turunen, J. (2007). Growth in Euro Area Labor Quality. Review of Income and Wealth, 53(4), 716-734.
Smith, K. W., and Sasaki, M. S. (1979). Decreasing Multicollinearity: A Method for Models with Multiplicative Functions. Sociological Methods & Research, 8(1), 35-56.
Tabuchi, T., and Yoshida, A. (2000). Separating Urban Agglomeration Economies in Consumption and Production. Journal of Urban Economics, 48(1), 70-84.
Topel, R. H. (1986). Local Labor Markets. Journal of Political Economy, 94(3, Part 2), S111-S143. Ullman, E. L. (1954). Amenities as a Factor in Regional Growth. Geographical Review, 44(1), 119-132.
Weiss, A. (1995). Human Capital vs. Signalling Explanations of Wages. Journal of Economic Perspectives, 9(4), 133-154.
Welch, F. (1970). Education in Production. Journal of Political Economy, 78(1), 35-59.
Yankow, J. J. (2006). Why do cities pay more? An empirical examination of some competing theories of the urban wage premium. Journal of Urban Economics, 60(2), 139-161.
23
Appendix
Table A1 Correlation matrix*
Labor
incomegt Educationgt Experiencegt Experiencegt
2 Commuting gt Firm size it Sizest Firm densityst Culture, restaurant and entertainment employment proportionst Municipal tax levelst Human capitalst Labor incomegt 1 Educationgt 0.41 1 Experiencegt 0.03 -0.21 1 Experiencegt2 -0.09 -0.08 -0.12 1 Commutinggt 0.18 0.08 -0.05 -0.01 1 Firm sizeit 0.02 0.02 -0.03 -0.01 0.01 1 Sizest 0.30 0.17 -0.03 0.01 0.28 0.04 1 Firm densityst 0.14 0.05 0.03 0.01 0.09 -0.03 0.42 1 Culture, restaurants, and entertainment employment proportionrt 0.17 0.14 0.03 -0.01 -0.01 -0.01 0.40 0.28 1 Municipal tax levelrt -0.10 -0.11 0.09 -0.01 -0.13 0.01 -0.39 -0.17 -0.19 1 Human capitalst 0.33 0.22 0.03 0.01 0.22 0.05 0.81 0.34 0.35 -0.29 1
*Significant at one percent
Table A2 Regression results for full sample and location categories, fixed-effect estimation specification 2, 1998 to 2008. Dependent variable:Labor income (ln)
Full sample Municipalities in metropolitan functional regions Central municipalities in functional regions Peripheral municipalities, larger functional regions Peripheral municipalities, small functional regions Individual level variables
Educationgt (0.0002) 0.036** (0.0004) 0.045** (0.0004) 0.032** 0.031** (0.001) 0.030** (0.001)
Experiencegt (0.0001) 0.036** (0.0001) 0.039** (0.0001) 0.035** (0.0001) 0.034** (0.0002) 0.033**
Experiencegt2 -4.01e-4** (0.00001) -4.97e-4** (0.00001) -3.58e-4** (0.00003) -2.98e-4** (0.00003) -2.92e-4** (0.00001)
Commutinggt (0.0004) 0.016** 0.015** (0.001) 0.026** (0.001) 0.015** (0.001) 0.016** (0.002)
Region dummy YES NO NO NO NO
Industry dummy YES YES YES YES YES
Firm sizeit (ln) (0.0001) 0.009** (0.0001) 0.009** (0.0001) 0.009** (0.0002) 0.010** (0.0003) 0.009**
Municipal level variables
Human capitalst 0.321** (0.006) 0.087** (0.008) 0.289** (0.017) 0.343** (0.023) 0.741** (0.051)
Intercept 5.318** (0.003) 5.334** (0.006) 5.323** (0.005) 5.302** (0.006) 5.275** (0.009)