http://www.diva-portal.org
Postprint
This is the accepted version of a paper published in International Journal for Quality in
Health Care. This paper has been peer-reviewed but does not include the final publisher
proof-corrections or journal pagination.
Citation for the original published paper (version of record):
Algurén, B., Andersson Gäre, B., Thor, J., Andersson, A-C. (2018)
Quality indicators and their regular use in clinical practice – results from a survey
among users of two cardiovascular National Registries in Sweden
International Journal for Quality in Health Care, 30(10): 786-792
https://doi.org/10.1093/intqhc/mzy107
Access to the published version may require subscription.
N.B. When citing this work, cite the original published paper.
Permanent link to this version:
Quality indicators and their regular use in clinical practice–results from a survey among users of two cardiovascular National Registries in Sweden
Objective: To examine the regular use of quality indicators from Swedish cardiovascular National Quality Registries (NQRs) by clinical staff; particularly differences in use between the two NQRs and between nurses and physicians. Design: Cross-sectional online survey study. Setting: Two Swedish cardiovascular NQRs: a) Swedish Heart Failure Registry and b) Swedeheart. Participants: Clinicians (n=185; 70% nurses, 26% physicians) via the NQRs’ email networks. Main outcome measures: Frequency of NQR use for a) producing healthcare activity statistics; b) comparing results between similar departments; c) sharing results with colleagues; d) identifying areas for quality improvement (QI); e) surveilling the impact of QI efforts; f) monitoring effects of implementation of new treatment methods; g) doing research; h) educating and informing healthcare professionals and patients. Results: Median use of NQRs was ten times a year (25th and 75th percentiles range: 3 – 23 times/year). Quality indicators from the NQRs were used mainly for producing healthcare activity statistics. Median use of Swedeheart was six times greater than SwedeHF (p<0.000). Physicians used the NQRs more than twice as often as nurses (18 vs. 7.5 times/year; p<0.000) and perceived NQR work more often as meaningful. Around twice as many Swedeheart users had the role to participate in data analysis and in QI efforts compared to SwedeHF users. Conclusions: Most respondents used quality indicators from the two cardiovascular NQRs infrequently (< 3 times/year). The results indicate that linking registration of quality indicators to using them for QI activities increases their routine use and makes them meaningful tools for professionals. Word count Abstract: 250 Manuscript: 3181 Keywords: Quality indicators, Quality Registry, meaningful usage, quality improvement, eHealth
INTRODUCTION
In healthcare as well as in all organizations, information is a prerequisite for quality management and improvement (1, 2). Information is the basis for a learning healthcare system in which informed decision-making and a culture for continuous quality improvement (QI) are a natural part of professionalism (3, 4). To improve
quality of care, whether in a particular healthcare organization or internationally across many
organizations, stakeholders need information to continuously monitor and improve treatment
effectiveness and health outcomes (5). Globally, work is ongoing to identify sets of relevant information for
performing high quality care, often called quality standards or indicators (6-8). One example of the latest international work of developing and implementing quality standards for the global disease burden might be the International Consortium of Health Outcome Measurements (www.ichom.org). Up to now, they provide 21 standards sets for different diseases, e.g. heart failure, hypertension, diabetes. The National Library of Medicine defines quality indicators as “norms, criteria, standards and other direct qualitative and quantitative measures used in determining the quality of health care” (9). In Sweden, the National Quality Registries (NQRs) can be seen as a collection of quality indicators defined as “individualized data concerning patient problems, medical interventions, and outcomes after treatment, within all healthcare production” (10). Applications for use of NQRs as well as for quality indicators in general range from education, quality improvement, and accountability to research (11-13). The Swedish NQRs aim to collect nationwide individual-based clinical data to examine and improve the delivery and outcome of healthcare (10). There are more than 100 NQRs for different diseases with national coverage and support (14). Between 2012 and 2016, NQRs received increased funding from the Swedish government and the Swedish Association of Local Authorities and Regions (SALAR) (70% and 30% respectively) in order to improve their quality and increase their use for quality improvement and research. The Swedish NQRs and their organization are described in detail by Emilsson et al. (14). Not only in Sweden but internationally, the number of quality indicators that healthcare providers are required to report has increased over the past decade, which has raised questions of whether costs of accounting might actually outweigh the benefits for improvement (2, 7, 15-17). NQR use seems mostly directed towards external accountability, for example the registries’ annual report, national “Open comparison,” a report published yearly on transparently compared clinical results, while clinical staff have the burden of collecting the information (18). Integrated and active use of NQRs in clinical practice is a prerequisite to make them a meaningful tool for healthcare professionals for continuous QI (18-20).While there is evidence that NQRs can be useful tools for dedicated QI teams within QI projects (21, 22), little is known about their regular clinical use beyond time-limited projects.
Therefore, the present study aimed to illuminate the regular use of quality indicators by clinical staff as exemplified by two Swedish cardiovascular NQRs. It focused in particular on differences in clinicians’ use between the two NQRs as well as differences in use between nurses and physicians. METHODS This study is part of a larger project with a mixed methods approach to evaluate the use of NQRs in Swedish health services during a period of increased public funding (2012 to 2016). Between March and May 2016, a national online survey with users of two NQRs concerning cardiovascular healthcare was conducted. The specific examples of NQRs – Swedeheart and the Swedish Heart Failure Registry (SwedeHF) Cardiovascular disease causes a large share of the population’s burden of disease and generates a considerable need for healthcare services. It is a priority for healthcare improvement nationally as well as internationally. The two chosen cardiovascular registries differed regarding to their maturity (e.g. life-time 24 versus 13 years): A) Swedeheart, established in 1991, comprising six previously separate registries which cover myocardial infarction (acute care and secondary prevention) as well as procedure- and surgery-related indicators (e.g. coronary angiography, heart surgery; http://www.ucr.uu.se/swedeheart/); B) SwedeHF, the registry for congestive heart failure, established in 2003, which focuses on health services across the chain of care (hospital as well as ambulatory and community care; http://www.ucr.uu.se/rikssvikt-en/). In 2016, 79 hospital units were reporting data into Swedeheart (23), whereas 50 hospitals and 66 primary healthcare centers were continuously registering data in SwedeHF (according to registry coordinator’s information). Survey content The development of the questionnaire was done in the scope of a larger project (see above) and contained 77 items distributed on 22 questions (available from the corresponding author). For the present study one part of
the questions were considered 1) the frequency of the respondents’ use of the quality registry; 2) respondents’ characteristics (including questions on respondents’ motivation to use the registry and to what extent they perceive its use as meaningful measured by a four-point Likert-scale); and 3) what training respondents had received for using the NQR. Use was divided into nine different applications in line with the national vision for NQRs’ to be “used in an integrated and active way for continuous learning, improvement, research and management to create the best possible health and care together with the individual” (10). This involves: a) producing healthcare activity statistics; b) comparing results between similar departments; c) reporting results to colleagues; d) identifying areas for quality improvement; e) surveilling quality improvement efforts; f) monitoring implementation of new treatment methods; g) doing research; and h) educating and informing healthcare professionals as well as patients. The questions about annual frequency of use of the data from the registry were asked in five response categories: 0, 1-2, 3-4, 5-9 and 10 or more times per year. The latter questions were matched with the survey done by the National secretariat for NQRs. The survey was designed in the Swedish University Network (Sunet) Survey program (Artologik). Members of the steering groups of Swedeheart and SwedeHF pilot tested the questionnaire; we made minor revision of formulations and registry-specific questions according to their comments. Finally, to reflect registry-specific issues, there were two slightly different (in the background section) survey versions administered, one specific to Swedeheart and one to SwedeHF. Data collection procedure In order to reach health professionals who use the registries, an intensity sampling strategy was used (Passon, 2001). Thus, the survey was sent via email by the respective registry’s coordinator through their existing user email network (n=254 active users for Swedeheart, n=501 active, past and incoming users for SwedeHF) in early March of 2016. Two reminders were sent before the survey was closed at the end of May. Analysis The participant characteristics were described by univariate statistics. Medians were used for variables with a non-normal distribution (Kolmogorov-Smirnov test). To characterize the total use of NQR indicators, a summary score for the nine applications outlined above were calculated. Prior to this, the annual use response categories of each application were recoded as follows: “0 times/year” into 0, “1-2 times/year” into 1.5, “3-4 times/year”
into 3.5, “5-9 times/year” into 7 and “at least or more than 10 times/year” into 10. Consequently, the summary score could range between 0 and 90 times/year. To investigate differences in subgroups (Swedeheart users versus SwedeHF users; physicians versus nurses), the U-test was used for non-normally distributed variables, the Chi-square test for proportions. All tests were carried out as two-sided at local alpha level of 0.05. Statistical analyses were performed with IBM SPSS Statistics (Version 24).
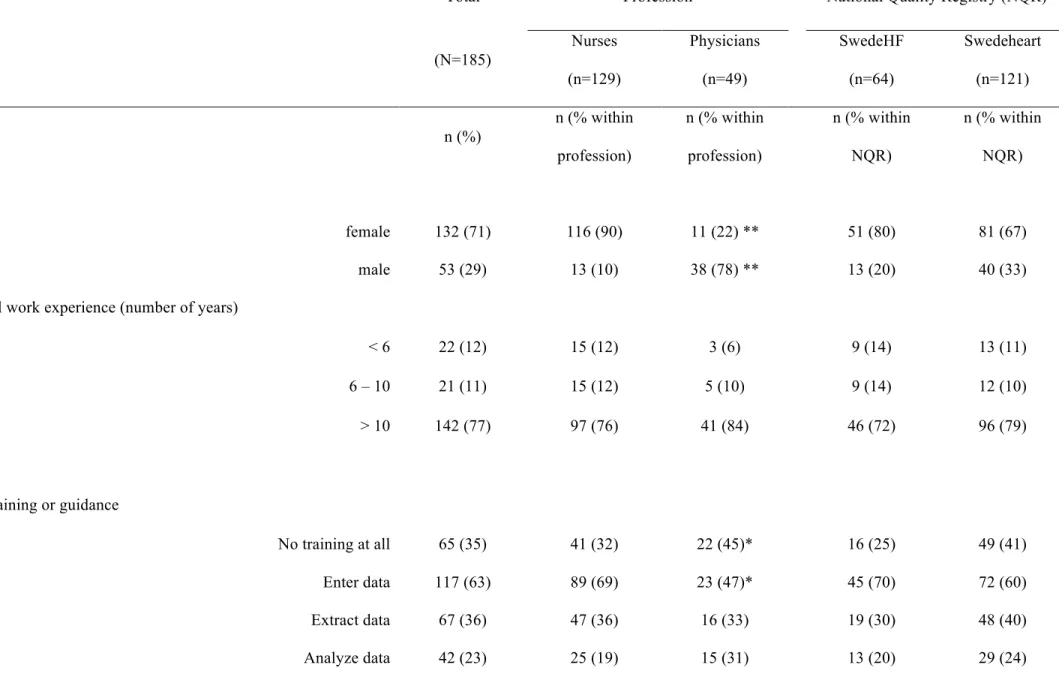
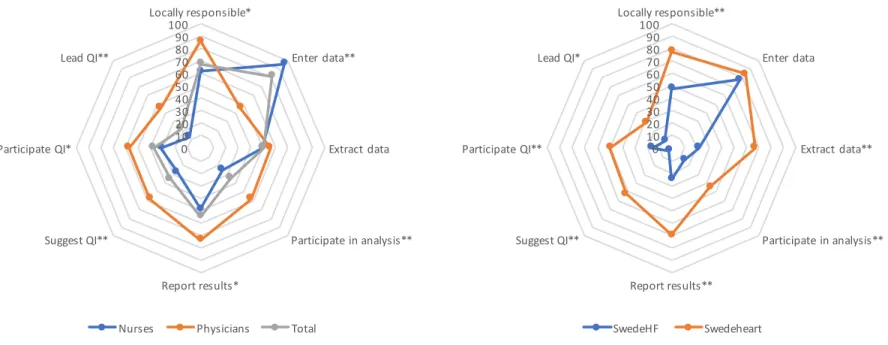
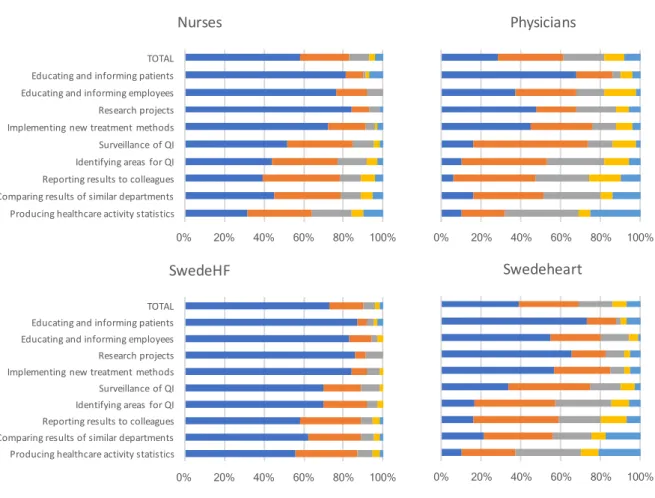
RESULTS Study participants The 185 study participants’ characteristics (121 Swedeheart users and 64 SwedeHF users) are shown in Table 1. Figure 1 shows how participants perceived their role within quality registry work, stratified by profession and registry. Three quarters of respondents were nurses (n=129), and one quarter physicians (n=49), most of them (77%) with more than ten years of work experience. The proportion of nurses versus physicians differed between the registries: 4:1 (SwedeHF) and 2:1 (Swedeheart). The most common role among respondents was to enter data into the NQR (82%) and to be the local coordinator for the NQR in question (68%). Nurses’ and physicians’ roles differed significantly. Almost all nurses, but only half of physicians, had the role to enter data (95% versus 46%). Significantly more physicians than nurses had the role to participate in NQR data analysis and suggest, participate in and lead quality improvement efforts. Respondents’ roles also differed significantly between the two NQRs: Around twice as many Swedeheart users had the role to extract data and participate in data analysis, as well as in quality improvement efforts compared to SwedeHF users. Regarding training/user guidance received, one-third did not receive any training (32%). Of those receiving training, over half were trained in how to enter data into the NQR; less than one-third were trained in how to extract and analyze data, and even fewer were trained in how to use data for quality improvement. While nurses had been trained significantly more often to enter data into the system than physicians, there were no further significant differences between nurses and physicians in relation to training, or between Swedeheart and SwedeHF. Generally, respondents felt motivated to use the registry, found their work with the registry meaningful, and experienced that the registry contributed to their own learning (e.g. professionally and regarding organizational processes) to a large extent. However, nurses experienced this significantly less often than physicians and SwedeHF users did so less often than Swedeheart users (p<0.001). -Insert table 1 and figures 1 - Frequency of National Quality Registry Use The proportions of frequency use among the nine applications are shown in figure 2. Respondents’ median use of NQRs was 10 times a year (25th and 75th percentiles range: 3 – 23 times a year). Out of the nine applications, quality indicators from the NQRs were mainly used for producing healthcare activity
statistics, i.e. how often different situations occurred or how often different interventions were performed. Almost 30% of respondents used the registries for healthcare activity statistics one to two times a year (29 %) or three to four times a year (24 %). Fifteen percent of respondents produced healthcare activity statistics more than ten times a year. The registries were also used to report results to colleagues, to compare results between departments and to identify areas for QI. More than half of respondents did this, but most of them only two times a year (34% – 39%). Most of the respondents answered that they did not use the registries at all (i.e., zero times a year) for the following applications: Educating and informing patients (78 %) or employees (65 %), research (73 %) and implementing new treatment methods (66 %).
Median use of Swedeheart was around 14 times a year, six times more often than SwedeHF (median=2.24; p<0.000). While more than half of Swedeheart users applied the registry for producing healthcare activity statistics, comparing and reporting results to colleagues, as well as identifying areas for and evaluation of quality improvement work, more than half of SwedeHF users did not use any of those applications. At least a third of SwedeHF users produced statistics, compared and reported results to colleagues one to two times a year. Around 20% of the Swedeheart users used data more than ten times a year for producing healthcare activity statistics (21 %) and for comparing results (19 %). Physicians used the NQRs more than twice as often as nurses (median 18 times/year vs. 7.5 times/year; p<0.000). More than 50 % of physicians used the NQRs for all of the nine applications except for educating and informing patients (33% of physicians used the NQRs at least once a year for this purpose). Applications that more than 50 % of the nurses used were: producing healthcare activity statistics, comparing and reporting results to colleagues, and identifying areas for quality improvement; nurses most commonly used the NQRs one to two times a year for this. The proportion of physicians who used the NQRs more than ten times a year or more was more than double the proportion of nurses. Figure 2 gives an overview of the distribution of registry use stratified by NQR and profession.
DISCUSSION
The survey revealed that NQRs were rarely integrated regularly in clinical work for quality improvement. There were principal differences between the two studied NQRs and between nurses and physicians. Among the respondents, quality indicators from Swedeheart were used more often (median at least once a month) than indicators from SwedeHF – (two times a year), and more often by physicians (almost twice a month) than by nurses (eight times a year). This mirrors the distribution of roles among users. Physicians’ as well as Swedeheart users’ roles were more often (than nurses’ and SwedeHF users’ roles) to compare and report results, to analyze data, and to initiate, participate in and lead improvement efforts. Nurses more often than physicians had the role only to enter data into the NQRs. A contemporary study on the Swedish Stroke Registry similarly found that most of the users only entered data in the registry and used data less often for QI (24). Reports from the Swedish Agency for Health and Care Services Analysis (Vårdanalys) also documented this problem despite the increased funding for NQRs (25). Our study suggests, however, that if respondents do not view registration of the quality indicators as an end in itself but as the basis for developing and evaluating improvement strategies, it contributes to increased regular use and the reported perceptions of meaningfulness. These findings mirror other studies; clinicians’ involvement in QI is important for enhancing the meaningful use of NQR data (26, 27). In the present study, nurses entered data, while physicians’ use went beyond entering data to include using data for QI, despite the fact that guidance/training material received on how to use NQRs for QI activities did not differ between physicians and nurses. A parallel study from our group found that nurses’ work with SwedeHF was fragmented, as their role was only to enter data while physicians use the registry for optimizing treatment (Norman et al., forthcoming). Other factors that affects the likelihood that quality indicators are used regularly is their perceived relevance for day-to-day practice (27). The importance of selecting quality indicators based on the needs of end users and “measures that really matter and thereby focus on what we need to do for our patients” were likewise pointed out by Meyer et al (8). The substantial differences in registry use between nurses and physicians might be related to the fact that quality indicators within each registry were not adapted to the information needs of nurses nor linked to their tasks within team care delivery. A closer look on quality indicators of cardiovascular registries
revealed that they mainly contain indicators on processes (e.g. surgery, procedures and pharmacological treatment), followed by outcomes on body functions and anatomical structures (Algurén et al., forthcoming). Without doubt, this information is of utmost importance for the correct medical treatment (responsibility of physicians). For example, the sub-registry “Swedish Coronary Angiography and Angioplasty Registry”, which comprises information on the surgical procedures and medical products used, medication and patients’ body functions (23). This information is important for monitoring distinctly heart surgeons’ operations and how well it restores patients’ body functions. Furthermore, the team (as the end users of a registry) is well-defined and includes a surgeon and surgery nurse. Compared to the scope of mostly episodic care represented in Swedeheart, the care of heart failure patients is more complex, often fragmented while concerning a chronic condition, with multiple healthcare providers in multiple sites, often with limited coordination (28). The end users of SwedeHF are a diverse group whose members, particularly in primary care, see many patients with multiple health conditions, not only heart failure and not only in cardiology. This complexity may contribute to the less frequent use in clinical practice among SwedeHF respondents. The end users’ need for information is less distinct than among Swedeheart users. Additionally, nurses’ more holistic perspective requests more information on impact on patients’ daily lives, e.g. how the disease influences patients’ activities and participation in life (29, 30). One might speculate that NQRs were not based on nurses’ need for information, which may contribute to less use of QI, which is then experienced more often as neither meaningful nor contributing to professional learning by nurses. With this in mind, value creation of NQRs can be questioned if the balance between efforts to report quality indicators diminishes the opportunity to actually use the data to improve quality of healthcare. Other studies have shown that the burden and cost associated with documentation — either regular reporting in electronic health records or in quality registries — reduced face-to-face time with patients to one-third of total time (18, 31). The way forward involves both reducing the burden of data management and increasing the utility of using NQR data, e.g. to improve care. One might argue that the administrative task to enter data should be done by data management personnel so that nurses and physicians could spend more time to analyze data and suggest QI instead. However, the studies from DeLone and McLean, the fathers of the Model of Information Systems (IS) Success, shown that the use of IS depends among others on the quality of the data collected that is determined by their completeness, consistency, accuracy, validity and timeliness (32). Strong et al put data quality in its
context and define high data as data that is fit for use by its end-users with dimensions like relevancy, value-added, and amount of data (33). The latter can be influenced among others by two “main” facts: a) how the person who enters the data can use the information meaningful in clinical routine; b) how technical solutions of information systems support the data entry and timeliness. Thus, we argue, that a set of quality indicators should be carefully developed and adapted to each clinicians’ need of information in clinical work, documented in a consistent way in order to allow aggregation of data to a group-level. Furthermore, the entry of data into a set of quality indicators might be subdivided between different professions in accordance to their “fit for the end-users” at the same time decreasing the burden of collecting information for each. Parallel, the technical solutions and the functionality of the information systems should improve. Methodological considerations One should keep in mind that the study population consisted of an intensity sample, e.g. users with specific roles within Swedeheart and SwedeHF as identified by registry coordinators. As such, the results might be representative for so-called “super-users” (though most of them only had the rather limited role of entering data and being the local coordinator). Conclusions and implications Many respondents used quality indicators in the two cardiovascular NQRs in clinical practice infrequently. Nurses perceived their role most often as limited to data collection; they used NQRs less than half as often as physicians. Nevertheless, the results indicate that linking registration of quality indicators to using them for QI activities increases their use and turn them into more meaningful tools for healthcare professionals in service of their patients. It is essential to adapt quality measurement efforts to the needs of end users so they can use indicators to develop and evaluate QI activities and thus contribute to better patient outcomes. ACKNOWLEDGEMENTS The authors would like to acknowledge all the researchers and clinicians who participated in the pilot testing of the survey, the registry directors and coordinators in supporting and organizing the administration of the survey as well as all respondents who completed the survey.
Competing Interests None declared.
REFERENCES
1.
Mamlin BW, Tierney WM. The Promise of Information and Communication Technology
in Healthcare: Extracting Value From the Chaos. The American journal of the medical
sciences. 2016;351:59-68.
2.
Pflueger D. Accounting for quality: on the relationship between accounting and quality
improvement in healthcare. Bmc Health Services Research. 2015;15.
3.
Friedman CP, Wong AK, Blumenthal D. Achieving a Nationwide Learning Health System.
Science Translational Medicine. 2010;2.
4.
IOM (Institute of Medicine). The Learning Healthcare System: Workshop Summary.
Washington, DC; 2007.
5.
Hoog E, Lysholm J, Garvare R, Weinehall L, Nystrom ME. Quality improvement in large
healthcare organizations Searching for system-wide and coherent monitoring and
follow-up strategies. Journal of Health Organization and Management. 2016;30:133-53.
6.
Mainz J, Kristensen S, Bartels P. Quality improvement and accountability in the Danish
health care system. International Journal for Quality in Health Care. 2015;27:523-27.
7.
Meyer GS, Nelson EC, Pryor DB, James B, Swensen SJ, Kaplan GS, et al. More quality
measures versus measuring what matters: a call for balance and parsimony. BMJ quality
& safety. 2012;21:964-68.
8.
Stelfox HT, Straus SE. Measuring quality of care: considering measurement frameworks
and needs assessment to guide quality indicator development. Journal of Clinical
Epidemiology. 2013;66:1320-27.
9.
U.S. National Library of Medicine. Medical subject headings. National Institutes of
Health. Available at http //
www.nlm.nih
.gov/cgi/mesh/2007/mb cgi. 2015 [
10. SALAR (Swedish Association of Local Authorities and Regions). Definition of National
Quality
Registries
in
Sweden.
Available
at
http://www.kvalitetsregister.se/englishpages/aboutqualityregistries.2422.html
2016 [
11. Adirim T, Meade K, Mistry K, Council Quality Improvement P, Comm Practice
Ambulatory M. A New Era in Quality Measurement: The Development and Application
of Quality Measures. Pediatrics. 2017;139.
12. Adami HO, Hernan MA. Learning how to improve healthcare delivery: the Swedish
Quality Registers. Journal of Internal Medicine. 2015;277:87-89.
13. Ludvigsson JF. Quality registries: exciting opportunities. Journal of internal medicine.
2016;279:130-1.
14. Emilsson L, Lindahl B, Koster M, Lambe M, Ludvigsson JF. Review of 103 Swedish
Healthcare Quality Registries. Journal of Internal Medicine. 2015;277:94-136.
15. Sheldon TA. The healthcare quality measurement industry: time to slow the juggernaut?
Quality & safety in health care. 2005;14:3-4.
16. Loeb JM. The current state of performance measurement in health care. International
Journal for Quality in Health Care. 2004;16:I5-I9.
17. Hoque DME, Kumari V, Hoque M, Ruseckaite R, Romero L, Evans SM. Impact of clinical
registries on quality of patient care and clinical outcomes: A systematic review. PloS one.
2017;12.
18. Casalino LP, Gans D, Weber R, Cea M, Tuchovsky A, Bishop TF, et al. US Physician
Practices Spend More Than $15.4 Billion Annually To Report Quality Measures. Health
Affairs. 2016;35:401-06.
19. Hashjin AA, Ravaghi H, Kringos DS, Ogbu UC, Fischer C, Azami SR, et al. Using Quality
Measures for Quality Improvement: The Perspective of Hospital Staff. PloS one. 2014;9.
20. Becher EC, Chassin MR. Taking health care back: The physician's role in quality
improvement. Academic Medicine. 2002;77:953-62.
21. Levay C. Policies to foster quality improvement registries: lessons from the Swedish
case. Journal of internal medicine. 2016;279:160-72.
22. Peterson A, Gudbjornsdottir S, Lofgren U-B, Schioler L, Bojestig M, Thor J, et al.
Collaboratively Improving Diabetes Care in Sweden Using a National Quality Register:
Successes and Challenges-A Case Study. Quality management in health care.
2015;24:212-21.
23. Tomas J. Swedeheart - Annual Report 2016. Uppsala: Karolinska University Hospital,
Huddinge, 141 86 Stockholm, UCR UCRC; 2017. Report No.: ISSN: 2000-1843.
24. Eldh AC, Wallin L, Fredriksson M, Vengberg S, Winblad U, Halford C, et al. Factors
facilitating a national quality registry to aid clinical quality improvement: findings of a
national survey. Bmj Open. 2016;6.
25. Swedish Agency for Health and Care Services Analysis. (Myndigheten för vård- och
omsorgsanalys). Patchwork with insufficient coverage. Final evaluation of temporary
investment in National Quality Registries. [In Swedish: Lapptäcke med otillräcklig
täckning. Slututvärdering av satsningen på nationella kvalitetsregister]. Stockholm;
2017.
26. Shea CM, Reiter KL, Weaver MA, Albritton J. Quality improvement teams, super-users,
and nurse champions: a recipe for meaningful use? Journal of the American Medical
Informatics Association. 2016;23:1195-98.
27. Siriwardena AN. Engaging clinicians in quality improvement initiatives: art or science?
Quality in primary care. 2009;17:303-5.
28. Golden AG, Tewary S, Dang S, Roos BA. Care Management's Challenges and
Opportunities to Reduce the Rapid Rehospitalization of Frail Community-Dwelling Older
Adults. Gerontologist. 2010;50:451-58.
29. Primdahl J, Ferreira RJO, Garcia-Diaz S, Ndosi M, Palmer D, van Eijk-Hustings Y. Nurses'
Role in Cardiovascular Risk Assessment and Management in People with Inflammatory
Arthritis: A European Perspective. Musculoskeletal Care. 2016;14:133-51.
30. Kitson AL, Athlin AM, Conroy T, Int Learning C. Anything but Basic: Nursing's Challenge
in Meeting Patients' Fundamental Care Needs. Journal of Nursing Scholarship.
2014;46:331-39.
31. Sinsky C, Colligan L, Li L, Prgomet M, Reynolds S, Goeders L, et al. Allocation of Physician
Time in Ambulatory Practice: A Time and Motion Study in 4 Specialties. Annals of
internal medicine. 2016;165:753-61.
32. DeLone WH, McLean ER. The DeLone and McLean Model of Information Systems
Success: A Ten-year Update. Journal of Management Information Systems 2007;19:9-30.
33. Strong DM, Lee YW, Wang RY. Data quality in context. Communications of the Acm.
1997;40:103-10.
Table 1: Overview of study participants’ characteristics stratified by profession and NQR.
Total
Profession
National Quality Registry (NQR)
(N=185)
Nurses
(n=129)
Physicians
(n=49)
SwedeHF
(n=64)
Swedeheart
(n=121)
n (%)
n (% within
profession)
n (% within
profession)
n (% within
NQR)
n (% within
NQR)
Gender
female
132 (71)
116 (90)
11 (22) **
51 (80)
81 (67)
male
53 (29)
13 (10)
38 (78) **
13 (20)
40 (33)
Professional work experience (number of years)
< 6
22 (12)
15 (12)
3 (6)
9 (14)
13 (11)
6 – 10
21 (11)
15 (12)
5 (10)
9 (14)
12 (10)
> 10
142 (77)
97 (76)
41 (84)
46 (72)
96 (79)
Received training or guidance
No training at all
65 (35)
41 (32)
22 (45)*
16 (25)
49 (41)
Enter data
117 (63)
89 (69)
23 (47)*
45 (70)
72 (60)
Extract data
67 (36)
47 (36)
16 (33)
19 (30)
48 (40)
Use data for QI
31 (17)
18 (14)
11 (22)
10 (16)
21 (17)
To what extent…(range 1-4, 1= low to 4= very large)
Median (25 perc., 75 perc.)
Median (25 perc., 75 perc.)
Are you motivated to use NQR?
3 (3, 4)
3 (2.5, 4)
3 (3, 4) †
3 (2, 4)
3 (3, 4) ††
Is the work with NQR meaningful?
3 (2.5, 4)
3 (2, 4)
3 (3, 4) †
3 (2, 3)
3 (3, 4) ††
Does the NQR contribute to your learning (professional and other, e.g.
about your processes)?
3 (2, 3)
2 (2, 3)
3 (2.5, 4) ††
2 (2, 3)
3 (2, 4) ††
Total use (sum of use across all nine applications),
number of times respondents used the NQRs/year
10 (3.25, 22.5) 7.5 (1.5, 17.75) 18.5 (10.25,36)†† 2.25 (0, 7.4) 14.5 (7.5, 29) ††NQR= National Quality Registry, SwedeHF= Swedish Heart Failure Registry; QI=Quality improvement;
** p < 0.000 (Chi-square test); † p < 0.05 (U-test), †† p<0.000 (U-test),
Figures
Figure 1. Study participants’ perception of their role in working with the National Quality Registry, stratified by profession and registry
(percentage).
QI= Quality improvement; *p<0.05 (Chi-square test), **p<0.000(Chi-square test)
0 10 20 30 40 50 60 70 80 90 100 Locally responsible** Enter data Extract data** Participate in analysis** Report results** Suggest QI** Participate QI** Lead QI*
Role within QR
SwedeHF Swedeheart 0 10 20 30 40 50 60 70 80 90 100 Locally responsible* Enter data** Extract data Participate in analysis** Report results* Suggest QI** Participate QI* Lead QI**Role within QR
Figure 2. Distribution of frequency of National Quality Registry use within each of the nine
possible applications, stratified by profession and by National Quality Registry. TOTAL is the
mean frequency across all nine applications.
QI= Quality improvement; SwedeHF=Swedish Registry of Heart Failure
0% 20% 40% 60% 80% 100%
Physicians
0% 20% 40% 60% 80% 100% Producing healthcare activity statistics Comparing results of similar departments Reporting results to colleagues Identifying areas for QI Surveillance of QI Implementing new treatment methods Research projects Educating and informing employees Educating and informing patients TOTALNurses
0% 20% 40% 60% 80% 100% Producing healthcare activity statistics Comparing results of similar departments Reporting results to colleagues Identifying areas for QI Surveillance of QI Implementing new treatment methods Research projects Educating and informing employees Educating and informing patients TOTALSwedeHF
0 time/year 1-2 times/year 3-4 times/year 5-9 times/year >10 times/year
0% 20% 40% 60% 80% 100%