Copyright © IEEE.
Citation for the published paper:
This material is posted here with permission of the IEEE. Such permission of the IEEE does
not in any way imply IEEE endorsement of any of BTH's products or services Internal or
personal use of this material is permitted. However, permission to reprint/republish this
material for advertising or promotional purposes or for creating new collective works for
resale or redistribution must be obtained from the IEEE by sending a blank email message to
pubs-permissions@ieee.org.
By choosing to view this document, you agree to all provisions of the copyright laws
protecting it.
2012
E-mail Classification using Social Network Information
Anton Borg, Niklas Lavesson
Seventh International Conference on Availability, Reliability and Security
E-mail Classification using Social Network
Information
Anton Borg, Niklas Lavesson
School of Computing
Blekinge Institute of Technology
Karlskrona, Sweden 371 79
Email:
{anton.borg, niklas.lavesson}@bth.se
Abstract—A majority of E-mail is suspected to be spam. Traditional spam detection fails to differentiate between user needs and evolving social relationships. Online Social Networks (OSNs) contain more and more social information, contributed by users. OSN information may be used to improve spam detection. This paper presents a method that can use several social networks for detecting spam and a set of metrics for representing OSN data. The paper investigates the impact of using social network data extracted from an E-mail corpus to improve spam detection. The social data model is compared to traditional spam data models by generating and evaluating classifiers from both model types. The results show that accurate spam detectors can be generated from the low-dimensional social data model alone, however, spam detectors generated from combinations of the traditional and social models were more accurate than the detectors generated from either model in isolation.
Keywords-Social Network, Spam classification, Machine Learn-ing
I. INTRODUCTION
The occurrence of spam has grown rapidly and it has been suggested that the majority of all E-mails are spam [1]. This development has resulted in the widespread use of spam filters, a use which can also be attributed to the inability of the current legislation to make an impact [2]. The legal inability has mainly been due to the differences in jurisdiction of various countries. Since most spammers only stay online for a limited amount of time it is considered hard to enforce the legislations, which increase the importance of automatic spam detection techniques [3].
This paper presents a method for E-mail spam detection that uses social information. This Online Social Network (OSN) supported spam detection method is compared with traditional spam detection. The paper also contributes with three metrics that have been adapted for social network data.
A. Aim and Scope
The aim is to investigate a method for spam classification using multiple OSN supported decision models. This paper implements a detection method based on using data from one OSN and compares it with a traditional spam detection method. The scope is limited to the study of social relation-ships mined from a public E-mail corpus.
B. Outline
Section IV presents a method for E-mail spam detection using social information. In Section III research done in behavioral spam detection and in extension, OSN supported spam detection, is discussed. Section V details the method used for OSN data extraction, as well as the OSN data metrics. Section VI outlines the experimental procedure. The results are presented in Section VII and discussed in Section VIII. Finally, conclusions and future work is presented in Section IX.
II. BACKGROUND
Internet users today use a number of media to share informa-tion. Communication media comprise SMS, MMS, OSNs, E-mail, and instant messaging services. These services contribute to information overload as a result of the amount of data presented to users via them. It has been stated that in 2010, around 250 billion E-mails were sent each day1. As much as
about 90% of the E-mails sent are suspected to be spam1. E-mail is used along with OSNs as the two main forms of communication today. Large OSNs can attract around 100 million users, with Facebook surpassing 900 million2. People
use OSNs to exchange messages, media and information concerning social activities.
E-mail and OSNs are rarely linked today. As such, the services are unable to use information from each other. An example is that a medium, e.g. E-mail, can use information provided by a second medium, e.g. OSNs, to combat the prob-lem of information overload. Some work is focused towards this area, but are still in the initial phase [15], [16].
E-mail overload can be considered a specific form of information overload, a user receives more E-mails than he can process. Woods et al [4] have found that people tend to characterize information overload in three different ways. These three ways are listed below, with descriptions of how they apply to the problem of E-mail overload.
Clutter is when there is too much information on the screen. A proposed solution is to remove data available, Woods et al argues that the removing agent still have to know
1How many emails are sent everyday, http://email.about.com/od/emailtrivia/
f/emails per day.htm, 2012-02-26
2Facebook Statistics, http://newsroom.fb.com/content/default.aspx?
which data to remove, stopping this solution from being ideal [4].
Workload Bottleneck occurs when a user is unable to prop-erly deal with all the messages available within a times-pan. Solutions are to have systems that summarize or prioritize the messages.
Significance of data concerns how to recognize which E-mails are important in a certain context. Some suggested solutions to this is, e.g. cognitive buoyancy, i.e. relevant information floating to the top, or message constellations, i.e. how a set of message relates to each other [5]. One attempt at addressing E-mail overload, is the improve-ment of spam detection.
III. RELATEDWORK
A number of reviews on the existing anti-spam techniques jointly conclude that automatic techniques are necessary to implement spam filtering [6] [7].
Some approaches based on the use of ontologies to classify E-mails based on content and previous messages, have aimed at generating personalized classifiers [8] [9]. Over time users will have gathered large amounts of E-mails. By constructing a profile based on E-mail habits, it is possible to detect outliers, i.e. spam [10]. Other research have investigated profiling a user’s E-mail sending behaviors using histograms to detect outliers [11] [12].
What can be inferred from previous work is a tendency towards using data from OSNs as a basis for anti-spam techniques. Researchers have previously investigated the use of OSN-based techniques for E-mail classification by using previous E-mail conversations to create a correspondence graph, and from that graph, creating a model for classifica-tion [13] [14]. Most of the research so far has focused on building social networks from data, e.g. graph analysis, instead of gathering data from OSNs.
Learning algorithms have been investigated for prioritizing messages by building OSN from previous E-mail conversa-tions [13]. The data represent messages submitted by vol-unteers. The results of the study show the feasibility of the approach. Two caveats with the study are that the data sets cannot be considered representative and the training of the model is irregular. The problem of representation occurs as the voluntarily submitted messages have been screen and selected by submitter. The second problem is that the training is done on the same amount of messages, regardless of the size of the data set. The amount used in the training set is the least common denominator for the data sets, i.e. a data set with a size greater than 1,000 instances will still use the same size of the training set as a data set with a size of 200. No practical reasons for this are mentioned.
Tran et al. have conducted research on providing a so-cial context to E-mail correspondence [15]. A system that calculates the trust of the social path and also visualizes the path, have been implemented. This system provides an trust estimate between the corresponding parties. The data are based on social relationships from OSNs, in this case Facebook. OSN-based techniques can be used to enable the
E-mail Spam Detection Engine LegitimateSpam /
Facebook Twitter E-mail Google+ Preprocessing &
Datafusing
Data sources
Fig. 1. The proposed method uses Social Network data sources in order to personalize and improve the classification of incoming messages.
creation of a personalized spam filter and also allows the prioritization of messages, something which have been initially investigated [16].
By using the methods used to mine E-mail-based OSN and instead use other OSN sources as the basis of the classification, it is possible to address the problem of having a large E-mail based history, thus enabling extended classification for new users as well, given that said information is available on other OSN. Using OSN data sources as a complement to mining OSN data from E-mail corpora, removes the requirement of users having a large E-mail corpus to mine from, to be able to create the graphs required. However, whether this approach is capable of detecting spam messages and which data is necessary needs to be investigated further.
IV. THEORETICALMODEL
Workload Bottleneck and Significance of data can be
con-sidered to be closely related. By solving Significance of data the likelihood of Workload Bottleneck can be reduced. By using automatic tools to determine cognitive buoyancy and message constellations, the E-mail overload can be reduced by classifying and prioritizing the messages. However, the question of which data to use as a basis for making these decisions is relevant. As users, in various contexts, use E-mails for different reasons, each user has to create personalized, context-aware classifiers. A classifier is an application that assigns labels to, in this problem domain, an E-mail, e.g. spam or ham.
The personalized and context-aware classifier uses, as a basis for its decision, several data sources that can be linked to the user. By using data available from different data sources, a classifier is able to interpret content and header information in a message and compare it with how a user communicates using the various data sources.
A. Data Sources
In this section a method is proposed that is capable of leveraging information from one medium of communication
against a message received on another medium. As such the method needs to be able to gather information from several different data sources. These sources can be various services that a user has been linked to, e.g. various OSNs or E-mail history. The use of multiple data sources forms a classification basis that can be considered more personalized. For example, the content of the E-mail could be matched against a user’s profile information or against the corresponding party’s profile information, as well as earlier messages exchanged via the OSN. E-mail header information could be used to check whether a connection exists to a certain company or person via OSNs.
B. Context-driven Classification
The purpose and nature of social networks may vary. Some are used as a way of communicating short messages, some as a way of keeping in touch with friends, some for professional relationships. As a result it is possible to use these social networks to distinguish between contexts. If context is taken into account, the importance can be estimated based on where the user is, what time it is and/or a specified user mode (e.g. work mode).
C. Knowledge-based Classification
Another aspect that can be taken into consideration is the level of knowledge of the contacts. By using OSN data, one can extrapolate, using e.g. work information or group memberships, a users knowledge area. Given such an ap-proach, messages could be tagged as more relevant or less relevant depending on the perceived knowledge held by the author. One field of application where this aspect is useful to consider would be E-mail conversations involving multiple correspondents where the user want the most interesting reply in the thread to be the first read, for example replies in an list discussion.
D. Automatic E-mail Classification
E-mail classification can be done automatically. Let I rep-resent a set of mails reprep-resented as feature vectors. Each E-mail can be transformed into a vector of word frequencies. Let C= {spam, ham} represent possible classifications. Given a set of examples, represented as pairs E = {< i, c >| i ∈ I, c ∈ C}, it is possible to generate an approximation, ˆf of f : I → C using a supervised learning algorithm that generalizes from E.
Let T be a similar example set, T ∩ E = ∅. It is now possible to estimate the performance on f by evaluating the performance on T .
V. METHOD
The method is based on the idea of using several data sources as input to an engine that classifies a message as either spam or ham. These data sources could comprise pieces of information from several social media. Given data from these data sources, the engine creates a graph of users and extracts the social information. This social information is then used as a
basis for the classification of incoming messages, regardless of which medium is used to transfer the message. The proposed method can be seen in Fig. 1.
This paper focuses on one particular data source. The pro-posed engine uses a supervised learning algorithm to generate spam detection models from both E-mail content, header data, and, social information. Using a model that is extended with OSN data that can help in determining the behavior of a user (for example, the relationship between the sender and receiver) can be regarded as an OSN-based model.
A. Social Data Generation
As no public E-mail corpora explicitly include social meta data, e.g., the explicit relationship between the sender and receiver, models are generated from existing E-mail headers. Thus, even if there is a lack of explicit OSN attributes in the data, it is possible to extrapolate certain social information from the data set.
The motivation for extracting OSN data from the E-mail corpus instead of using OSN data as a data source, is that previous research on OSN based classification has used private data sets which have been altered in undisclosed ways. A public data set that has been peer-reviewed has been chosen for use. As such, it is hard to link users in the data set to OSN profiles and extract OSN data, requiring the social information to be mined from the E-mail corpus.
B. Social Data Metrics
In order to add social information to the data set, data from the corpus is mined and social information is con-structed. This paper focuses on three social attributes; the number of messages exchanged between users, the number of common contacts, and the number of participants. These metrics have been adapted from available OSN metrics. The number of exchanged messages indicates whether two users can be considered friends. Equation 1 describes the process of calculating the message-exchange score (MES) for a set of users associated with a message.
MES(m) = Pn
i=1Ms,ti+ Mti,s
n . (1)
For a given message, m, which contains a sender (s) and a set of receiving users (t), the number of messages to and from each user (ti) and s is counted and an average for the number
of receiving users (n) is calculated. In Equation 1, M is a matrix containing the number of messages between users.
Common Contacts Score (CCS) groups users, see Equa-tion 2 It is calculated by counting the users that tx and ty
both have exchanged bidirectional messages with. CCS(tx) = Pn i=1|A T B| n . (2)
For a given user, tx, let set A contain the users that tx
have exchanged messages with, given that said exchange of messages is two-way. Let the same be true for set B for user ti. The cardinality of the intersection between A and B is used
ATTRIBUTES EXTRACTED FROM THETREC07CORPUS
Attribute Description Type
Category Classification: spam or ham Nominal
To Recipients String
From Sender String
MES Message-Exchange Score∗ Numeric
NP Number of participants∗ Numeric
CCS Common Contact Score∗ Numeric
Received from E-mail route description String Other headers The remaining headers String Content E-mail body, including any attachments String
∗Attributes only available in the Social and the Combined Data set.
the score and divide it by the number of participants (n) to get a mean.
The number of participants is equivalent to n+ 1, as it includes the sender as well. These three attributes are added as separate attributes to the combined data set.
VI. EXPERIMENTS
The aim is to evaluate the classification performance impact of social data in comparison to traditional content-based spam detection, i.e. a multi-source model to a traditional. For this purpose, a public E-mail corpus is used to generate a social, combined and traditional data set. The social data set contains only the social information extracted from the E-mail corpus. The social extended set contains the message body, the available E-mail headers as well as the social information. The traditional data set contains only the headers and the message body, and uses no social data. The Weka machine learning workbench version 3.7.0 is used as the software platform for conducting the experiment [17].
A. Data Collection
The selected corpus is the TREC 2007 Public Cor-pus(Trec07)3. The Trec07 corpus was selected on the basis
of the size as well as the feature set. Compared to other public domain corpora, such as the Enron Spam Corpus4,
Trec07 contains header data in addition to the content data. The Trec07 was collected in 2007 and the corpus consists of 25,220 ham and 50,199 spam.
B. Data Preprocessing
On a conceptual level, the data extracted from Trec07 can be divided into the list of attributes displayed in Table I. However, few supervised learning algorithms can process strings. Thus, the string attributes must be transformed to a suitable representation. A common data model for this purpose, which has proven to be at least as effective as more complex solutions, is the bag-of-words model. In this model, strings are tokenized to words and represented by word vectors. In the first step, all special characters are removed, i.e., only the plus and minus signs, comma symbol, colon symbol,
3TREC 2007 Public Corpus, http://plg1.cs.uwaterloo.ca/cgi-bin/cgiwrap/
gvcormac/foo07, 2012-02-26
4Enron Spam Corpus, http://www.aueb.gr/users/ion/data/enron-spam/,
2012-02-26
full stop symbol, the white space characters, alphabetical and numeric characters, as well as the @ sign are kept. The special characters preserved, are required to tokenize the E-mail header data and the whitespace is used to tokenize text strings into words.
In Weka, this transformation is carried out with the
String-ToWordVectorfilter, which is applied to the To, From, Received
from, Other headers and Content attributes. The following
filter configuration is employed: a maximum of2, 000 words are stored per category, term frequency-inverse document frequency (TF-IDF) is used for word frequency calculation, and the Iterated Lovins stemmer is used to reduce the number of words by keeping only the stems of words.
Artifacts in the data set among the attributes have been identified and removed. The X-headers are not included in the data set as X-headers can be considered artifact attributes. The artifact attributes have been added by software and have low predictive power.
A stratified sample of10% of the original instances is then generated, which leaves 7,541 instances. This is a size chosen to ensure a representative and large enough sample size, while maintaining a reasonable trade-off between computational effort and generalizability of the results.
C. Feature Selection
Categorical proportional difference (CPD), has been shown to outperform traditional feature selection methods, such as χ2,
information gain, and odds ratio on several text categorization corpora [18]. Thus, CPD seems to be a suitable feature selection technique for the task at hand. The search for a suitable cutoff point for CPD is computationally expensive due to the possible non-linearity of the function of the number of kept words and the resulting performance [18]. A keep ratio interval is therefore defined and selected with a reasonable step size. In the presented study, a keep ratio interval of1.0 to 0.5 together with a step size of 0.1 is used. This configuration yields 5 iterations for each data set, which lets the possible performance gain for each data set be determined, by keeping from50% to 100% of the attributes.
D. Algorithm Selection
The main objective is to compare different data models available for detecting spam, hence the comparison of multiple learning algorithms to determine the optimal algorithm is out of scope. The Support Vector Machine (SVM) is a reasonable candidate, since it has been shown to work well with similar data models [19].
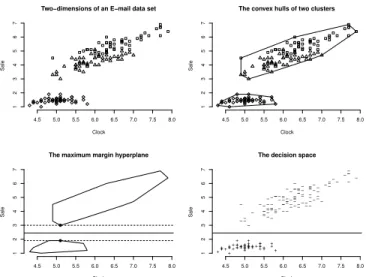
Given a set of examples, E, a SVM model, ˆf , is generated by mapping each example, e∈ E, as a point on a plane [20]. The SVM model uses a kernel function for mapping the examples, enabling the instances to be separated per class by a hyperplane. The hyperplane with the largest margin between the points of the classes is often chosen. Class prediction, P , for instances in T are a result of which side of the hyperplane they are mapped to. These steps can be seen in Fig. 2. SVM’s predicted class is either 0 or 1 and as such, prediction probabilities are distorted. For this paper SVM,
4.5 5.0 5.5 6.0 6.5 7.0 7.5 8.0 1 2 3 4 5 6 7
Two−dimensions of an E−mail data set
Clock Sale 4.5 5.0 5.5 6.0 6.5 7.0 7.5 8.0 1 2 3 4 5 6 7
The convex hulls of two clusters
Clock Sale 4.5 5.0 5.5 6.0 6.5 7.0 7.5 8.0 1 2 3 4 5 6 7
The maximum margin hyperplane
Clock Sale + + + + + + + + + +++ + + +++ ++ +++ + + + + + ++ + ++ +++ + + + ++ ++ + + + + + + + + − − − − − − − − − − − −− − − − − − − − − − − − − − − − − − − − − − − − − − − − − − − − − −− − − − − − − −− − − − − − − − − − − − − − − − − − − − − − − − − −− − − − − − − − − − − − − − − − −− − − 4.5 5.0 5.5 6.0 6.5 7.0 7.5 8.0 1 2 3 4 5 6 7
The decision space
Clock
Sale
Fig. 2. Example of SVM training process.
as implemented in the SMO algorithm available in Weka, is chosen with the default values used. To produce proper predictions, i.e. prediction probabilities between 0 and 1, buildLogisticM odels is set to true.
E. Performance Evaluation
The true positive rate (TPR) and false positive rate (FPR) is defined as follows. False Positive (FP), True Positive (TP), False Negative (FN) and True Negative (TN) is used in the definitions.
T P R= T P
T P+ F N . (3)
F P R= F P
F P + T N . (4)
Given a binary classifier, the Receiver Operating Charac-teristic (ROC) is the plot of the T P R versus the F P R, on the y-axis and x-axis respectively, for a set of instances, T . In the domain of machine learning, given T and a corresponding set of predictions, each prediction is plotted with a one step distance relative to the previous point [20]. If p∈ P is equal to c the instance is plotted along the y-axis, otherwise along the x-axis.
The area under the ROC curve (AUC) single point measure is used for evaluating the classifier performance, consisting of the portion beneath the ROC curve of the plot area. The larger portion of the plot area, i.e. higher AUC, denotes a higher performance. The AUC does not depend on an equal class distribution and misclassification cost [21]. In this paper, the weighted AUC (the average AUC of the classes) is used as a single point measure.
VII. RESULTS
Table III shows that, even though the number of attributes are lower, the classifier is still capable of producing good results. Compared to the traditional model, the results in Table III show a lower FPR for the combined model.
Table II shows a comparison between the different data models, with the advantage of showing OSN metrics as a
0.0 0.2 0.4 0.6 0.8 1.0 0.5 0.6 0.7 0.8 0.9 1.0 FPR TPR Social Socially Augmented Traditional
Fig. 3. AUC for the Social, Combined and Traditional model. The y-axis is limited to show the differences between the Traditionally and Combined set.
TABLE II DATA MODEL COMPARISON
Model TPR (STD) FPR (STD) AUC (STD) Social 0.953 (0.010) 0.380 (0.032) 0.926 (0.011) Combined 0.992 (0.004) 0.000 (0.001) 0.999 (0.001) Traditional 0.990 (0.004) 0.002 (0.003) 0.999 (0.001) The results of the performance of SMO on the different models.
individual data model. While the social data model produces a weighted AUC of0.926, it has still got quite a high FPR of 0.380.
The performance of the different models are shown in Fig. 3, depicting the weighted AUC. The performance of the social model shows the feasibility of using the metrics and method suggested. To improve the model, the FPR need to be decreased. While the traditional and Combined model have high AUCs, this is most likely due to the time span that the messages were collected. A longer collection time should result in a lower score, as similarities between messages are fewer.
Nevertheless, the FPR of the combined model is lower than the traditional model. To determine the statistical significance for the differences between models, a larger amount of data is needed.
VIII. DISCUSSION
Many of the OSN based techniques can be used in conjunc-tion with tradiconjunc-tional spam filtering techniques, to reduce the number of E-mails that need to be analyzed by the traditional technique. As such, even though a user cannot be linked to OSN, message can still be classified by traditional means.
A point that can be made is that a traditional, e.g. a Naive Bayes-based, spam classifier on a single users computer, given time and feedback, will have evolved into a personalized spam classifier. However, OSN-based classifiers do not require the same time span in order to become personalized since OSN-based classifiers use OSN data to bootstrap the feedback.
FEATURESELECTION IMPACT
Model (CPD∗) TPR (STD) FPR (STD) FNR (STD) AUC (STD) Nr. Attributes
Combined (0.5) 0.998 (0.003) 0.026 (0.016) 0.002 (0.003) 0.995 (0.004) 1445 Traditional (0.5) 0.989 (0.011) 0.007 (0.005) 0.011 (0.011) 0.999 (0.002) 1442 Combined (0.6) 0.993 (0.012) 0.015 (0.017) 0.007 (0.012) 0.996 (0.003) 1734 Traditional (0.6) 0.981 (0.016) 0.004 (0.003) 0.019 (0.016) 0.997 (0.003) 1730 Combined (0.7) 0.968 (0.010) 0.000 (0.001) 0.032 (0.010) 0.998 (0.001) 2023 Traditional (0.7) 0.969 (0.010) 0.003 (0.003) 0.031 (0.010) 0.998 (0.001) 2018 Combined (0.8) 0.990 (0.005) 0.001 (0.002) 0.010 (0.005) 0.999 (0.001) 2311 Traditional (0.8) 0.988 (0.005) 0.003 (0.003) 0.012 (0.005) 0.999 (0.001) 2307 Combined (0.9) 0.992 (0.004) 0.001 (0.001) 0.008 (0.004) 0.999 (0.001) 2600 Traditional (0.9) 0.990 (0.004) 0.002 (0.003) 0.010 (0.004) 0.999 (0.001) 2595 Combined (1.0) 0.992 (0.004) 0.000 (0.001) 0.008 (0.004) 0.999 (0.001) 2888 Traditional (1.0) 0.990 (0.004) 0.002 (0.003) 0.010 (0.004) 0.999 (0.001) 2882
∗The cut off point for the feature selection algorithm.
A. Social Network Information
The methods for socially aware classifications are promis-ing, but most of the research has been done by creating Social Networks from the E-mail corpus. While the method has been successful and shows feasibility, it requires a large E-mail corpus. For Social Network data to be extracted and built from the E-mail corpus requires a large E-mail corpus for there to be enough data available.
Social information could be extended using OSN data. For example, given that a user is active on an OSN, extracting and incorporating social information, similar to data that was used in the experiments, can be done. The information available on such networks has the potential to be of significantly larger quantities. Given that an E-mail classifier gain access to a users OSN data, that data could help to classify E-mails with none or only a few E-mail messages to aid in the classification process. Social Information-based classification could be used to prioritize messages, addressing the clutter and Significance
of datacharacteristics of information overload.
A consequence of this type of anti-spam filter, would be that bypassing the filter would require the spammers to personalize their spam to an infeasible extent.
IX. CONCLUSION ANDFUTUREWORK
This paper investigates the impact of spam classification based on social network data. The results suggest that accurate spam detectors can be generated from the low-dimensional social data model alone, however, spam detectors generated from combinations of the traditional and social models were more accurate than the detectors generated from either model in isolation. A theoretical model using several social network sources is presented. The social network metrics presented and used are adaptions meant to provide a normalized value for data extracted from various social networks. The performance of the social model suggests that the theoretical method presented merits further investigation.
For future work, a data set consisting of a larger number of messages that can be linked to various OSN needs to be cre-ated. Given such a data set, investigating the use of OSN data sources may yield more reliable results. The generalizability of the approach in this paper should be investigated on other data sets to verify the results found.
REFERENCES
[1] S. Hedley, “A brief history of spam,” Information & Communications
Technology Law, vol. 15, no. 3, pp. 223–238, 2006.
[2] G. Grimes, M. Hough, and M. Signorella, “Email end users and spam: relations of gender and age group to attitudes and actions,” Computers
in Human Behavior, vol. 23, no. 1, pp. 318–332, 2007.
[3] Z. Duan, K. Gopalan, and X. Yuan;, “Behavioral characteristics of spammers and their network reachability properties,” IEEE International
Conference on Communications, pp. 164 – 171, 2007.
[4] D. Woods, E. S. Patterson, and E. M. Roth, “Can we ever escape from data overload? A cognitive systems diagnosis,” Cognition, Technology
& Work, vol. 4, pp. 22–36, Jan. 2002.
[5] S. Weil, D. Tinapple, and D. Woods, “New Approaches to Overcoming E-mail Overload,” Human Factors and Ergonomics Society Annual
Meeting, Jan. 2004.
[6] T. Guzella and W. Caminhas, “A review of machine learning approaches to spam filtering,” Expert Systems With Applications, 2009.
[7] E. Blanzieri and A. Bryl, “A survey of learning-based techniques of email spam filtering,” Artificial Intelligence Review, vol. 29, no. 1, pp. 63–92, 2008.
[8] S. Youn and D. McLeod, “Efficient Spam Email Filtering using Adaptive Ontology,” ITNG ’07. Fourth International Conference on Information
Technology, pp. 249–254, Mar. 2007.
[9] ——, “Spam Email Classification using an Adaptive Ontology,” Journal
of Software, vol. 2, no. 3, pp. 43–55, Sep. 2007.
[10] W. Li, S. Hershkop, and S. Stolfo, “Email archive analysis through graphical visualization,” Proceedings of the 2004 ACM workshop on
Visualization and data mining for computer security, 2004.
[11] M. Wang, Z. Li, L. Xiao, and Y. Zhang, “Research on behavior statistic based spam filter,” Education Technology and Computer Science, 2009.
ETCS ’09. First International Workshop on, vol. 2, pp. 687 – 691, 2009. [12] R. Nussbaum, A. Esfahanian, and P.-N. Tan;, “History-based email prioritization,” ASONAM ’09: Social Network Analysis and Mining,
2009., pp. 364 – 365, 2009.
[13] S. Yoo, Y. Yang, F. Lin, and I.-C. Moon, “Mining social networks for personalized email prioritization,” 15th ACM SIGKDD international
conference on Knowledge discovery and data mining, Jan. 2009. [14] P. O. Boykin and V. P. Roychowdhury, “Leveraging social networks to
fight spam,” Computer, vol. 38, no. 4, pp. 61–68, Jan. 2005.
[15] T. Tran, J. Rowe, and S. Wu, “Social email: a framework and appli-cation for more socially-aware communiappli-cations,” Second International
Conference on Social Informatics, pp. 203–215, 2010.
[16] S. Rezaee, N. Lavesson, and H. Johnsson, “E-mail prioritization using online social network profile distance,” Computer Science &
Applica-tions, TMRF, Jan. 2011.
[17] M. Hall, E. Frank, G. Holmes, and B. Pfahringer, “The Weka data mining software: An update,” ACM SIGKDD Explorations Newsletter, vol. 11, no. 1, pp. 10–18, 2009.
[18] M. Simeon and R. Hilderman, “Categorical proportional difference: A feature selection method for text categorization,” Seventh Australasian
Data Mining Conference, pp. 201–208, 2008.
[19] F. Sebastiani, “Classification of text, automatic,” The Encyclopedia of
Language and Linguistics, pp. 457–462, Jan. 2006.
[20] I. Witten and E. Frank, “Data Mining: Practical machine learning tools and techniques,” Jan. 2005.
[21] T. Fawcett, ROC graphs: Notes and practical considerations for data