ContentslistsavailableatScienceDirect
Acta
Biomaterialia
journalhomepage:www.elsevier.com/locate/actbio
Full
length
article
Analysis
of
the
bone
ultrastructure
around
biodegradable
Mg–x
Gd
implants
using
small
angle
X-ray
scattering
and
X-ray
diffraction
Berit
Zeller-Plumhoff
a ,∗,
Carina
Malich
a,
Diana
Krüger
a,
Graeme
Campbell
a,
Björn
Wiese
a,
Silvia
Galli
b,
Ann
Wennerberg
c,
Regine
Willumeit-Römer
a ,∗,
D.C.
Florian
Wieland
aa Division of Metallic Biomaterials, Helmholtz Zentrum Geesthacht, Institute for Materials Research, Max-Planck-Straße 1, 21502 Geesthacht, Germany b Department of Prosthodontics, University of Malmö, Faculty of Odontology, Carl Gustafs väg 34, Klerken, 20506 Malmö, Sweden
c Department of Odontology, University of Gothenburg, Medicinaregatan 12 f, 41390 Göteborg, Sweden
a
r
t
i
c
l
e
i
n
f
o
Article history: Received 26 July 2019 Revised 11 November 2019 Accepted 12 November 2019 Available online xxx Keywords:Biodegradable magnesium implants Bone ultrastructure
Bone-implant interface
a
b
s
t
r
a
c
t
Magnesiumalloysareincreasinglyresearchedastemporarybiodegradablemetalimplantsinbone appli-cationsduetotheirmechanical propertieswhicharemore similartobonethanconventionalimplant metalsand the factthat Magnesiumoccursnaturallywithinthe body.However,the degradation pro-cesses invivo and inparticular the interaction ofthe bone withthe degrading materialneed to be furtherinvestigated.Inthisstudy wearepresentingthefirstquantitativecomparison ofthebone ul-trastructureformedattheinterfaceofbiodegradableMg–5GdandMg–10Gdimplantsandtitaniumand PEEKimplantsafter4,8and12weekshealingtimeusingtwo-dimensionalsmallangleX-rayscattering andX-raydiffraction.Differencesinmineralization,orientationandthicknessofthehydroxyapatiteare assessed.Wefindstatisticallysignificant(p<0.05)differencesforthelatticespacingofthe(310)-reflex ofhydroxyapatitebetweentitaniumandMg–xGdmaterials,aswellasforthe(310)crystalsizebetween titaniumandMg–5Gd,indicatingapossibledepositionofMgwithinthebonematrix.The(310)lattice spacingandcrystallitesizefurtherdiffersignificantlybetweenimplantdegradationlayerand surround-ingbone(p<0.001forMg–10Gd),suggestingapatiteformationwithsignificantamountsofGdandMg withinthedegradationlayer.
Statementofsignificance
BiodegradableMagnesium-basedalloysareemergingasaviablealternativefortemporaryboneimplant applications.However,inordertounderstandifthedegradationoftheimplantmaterialinfluencesthe boneultrastructure,itisnecessarytostudythebonestructureusinghigh-resolutiontechniques.Wehave thereforeemployed2DsmallangleX-rayscatteringandX-raydiffractiontostudytheboneultrastructure surroundingMagnesium–GadoliniumalloysaswellasTitaniumandPEEKalloysatthreedifferenthealing times.Thisisthefirsttime,thattheboneultrastructurearoundthesematerialsisdirectlycomparedand thatastatisticalevaluationis performed.We founddifferencesindicatingapossible depositionofMg withinthebonematrixaswellasalocaldepositionofMgand/orGdattheimplantsite.
Dataavailabilitystatement
Theraw/processeddatarequiredtoreproducethesefindingscannotbesharedatthistimeasthedata alsoformspartofanongoingstudy.
© 2019PublishedbyElsevierLtdonbehalfofActaMaterialiaInc.
Abbreviations: SAXS, small angle X-ray scattering; XRD, X-ray diffraction; HAP, hydroxyapatite; Mg, magnesium, Gd, gadolinium.
∗ Corresponding authors.
E-mail addresses: berit.zeller-plumhoff@hzg.de (B. Zeller-Plumhoff), regine.willumeit@hzg.de (R. Willumeit-Römer).
https://doi.org/10.1016/j.actbio.2019.11.030
1742-7061/© 2019 Published by Elsevier Ltd on behalf of Acta Materialia Inc.
2 B. Zeller-Plumhoff, C. Malich and D. Krüger et al. / Acta Biomaterialia xxx (xxxx) xxx
ARTICLE
IN
PRESS
JID:ACTBIO [m5G;November22,2019;9:35]
1. Introduction
Biodegradableimplantsareemerging asa viablealternativeto thewidely usedtitaniumimplantsin caseswherethe implant is notintended for permanentuse inthe body andthus requiresa secondsurgicalinterventionforremoval.Inthecaseof biodegrad-able bone implants, the implant is degrading within the body, whilst new bone tissue is formed around it. Magnesium (Mg) in particular is a promising candidate for biodegradable metal implantsduetoitsmechanicalpropertieswhicharemoresimilar to bone than conventional implant metals and the fact that Mg occurs naturally within the body [1] . The degradation rate of magnesium alloyscanbe tailored,dependingfor exampleonthe choice of alloying elements, the material microstructure, surface geometriesandtreatments[2–4] .
Manystudieshavelookedattheinvitrodegradationof differ-entMgalloys,withandwithoutcells[4–9] ,somehavealsotaken theinvivodegradationintoaccount[4 ,8 ,9] .Thedegradationlayer of Mgand its alloys in vivo and in vitro in cell media contains both Calcium and Phosphate, which indicates apatite formation [6 ,9] . However, up to date few studies have looked at the bone formation around the biodegradable implant, both on a micro-scopic and ultrastructural level. Bone is a hierarchical material, whose ultrastructural building blocks are fibrils,which make up the osteon lamellae [10] . The fibrils have a composite structure formed by type I collagen and hydroxyapatite crystal platelets (HAP) [10–12] . The platelets measure around 3 × 25 × 50 nm [11 ,13 ,14] ,butvary withcertain conditions such asage[15] . The HAPcrystalisofhexagonallatticestructurewith a ==b ==9.4 ˚A and c =6.8 ˚A[16] .Withinthebone,theHAPc-axisalignsparallel tothelongaxisthecollagenfibers[17 ,18] .Theboneultrastructure can be studied withvarious techniques [19] ,namely small angle X-rayscattering(SAXS) andX-raydiffraction(XRD), whichreveal plateletorientationandthicknessandcrystalsizeandlattice spac-ingfor particularcrystal reflexes,respectively [19] .These arethe parameters that determine the bone quality andthe mechanical propertiesof the bone matrix. In osteogenesis imperfecta where bonestrengthisimpairedithasforexamplebeenshownthatHAP plateletsaredistinctlysmallerandofdifferentcomposition[20] .
Grünewald etal.in particularhaveused high-resolution SAXS andXRDandmicroX-rayfluorescence(μXRF)toinvestigatethe ul-trastructureandchemicalmake-upofthebonesurroundingMg al-loysZX50andWZ21,suggestingthecoincidingofMgaccumulation aroundbloodvesselsandosteocytelacunaewithHAPlattice con-tractions[21] .Using lowerresolutionSAXS Grünewaldetal.have further shown a temporary decrease in plateletthickness in the newly forming bone around WZ21 alloy, which normalizes with increasing healing time [22] . However, the studies presented by Grünewaldet al.lacked comparisonto widely used implant ma-terials, such as titanium and polyether ether ketone (PEEK) and consistedofaqualitativeratherthanquantitativecomparison.The ultrastructureofbonesurroundingtitaniumimplantswas investi-gatedbyHoerthetal.[23] andBüngeretal.[24] ,however,dueto thepermanentnatureoftheimplants,thetime-dependencyofthe boneultrastructurewasnottakenintoaccount.
In this study we are presenting the first quantitative com-parison of the ultrastructure development of bone surrounding non-degradableimplantmaterials alreadyusedinthe clinic (tita-nium,PEEK) andbiodegradable implantsmadefrom Magnesium-Gadolinium alloys (Mg–xGd, where x denotes the Gd weight percentage)forhealingtimesof 4,8and12 weeks.The Mg–xGd alloyswere chosen in particular,as Gdenhances the mechanical properties of Mg [3] and results in slower degradation rates in vitrountila weightpercentageof10isreached[3 ,8 ,9] .Mg–10Gd implantshavefurtherbeenfoundtoresultinrelativelyhigh bone-to-implantcontact,thusindicatinggoodosseointegration[25] .
2. Materialsandmethods
2.1. Material processing
Slotted grub screws were manufactured from extruded Mag-nesium alloys with two different weight percentages (wt%) of Gadolinium, i.e., 5 wt% and 10 wt%, denoted Mg–5Gd and Mg– 10Gd, aspreviously published[26] .The screws were 4mm long, 2 mm in diameter, and had an M2 thread. PEEK and Titanium screwspurchasedfromPromimicAB(Mölndal,Sweden)wereused asreferencematerials.
2.2. Animal experiments
The animal experiment was conducted after ethical approval by the ethical committee at the Malmö/Lund regional board for animalresearch, Swedish Board ofAgriculture,with theapproval number DNR M 188-15. 30 Sprague Dawley adult male rats were used for this study. The animals were anesthetized with an intraperitonealdoseofFentanyl300μg/kg+Dexmedetomidin 150 μg/kg and then the legs were shaved and disinfected with chlorhexidine ethanol solution 0.5 mg/ml (Klorhexidinsprit; Fre-senius Kabi, Uppsala Sweden). The area of the tibiae was infil-tratedwith1mloflocalanaestheticandthenafullthicknessflap was elevated to expose the tibia metaphysis. An osteotomywas created in the area of the tibial metaphysisof each tibiawith a rounddrillof1.4mmdiameterandthenenlargedwitha cylindri-cal burof1.6mmdiameter,underconstantirrigationwithsterile saline. Thereafter, the osteotomieswere tapped andscrews were implantedwithamanual screwdriver.Eachrat received2screws, one in the left and one in the right tibia. The rats received ei-ther two Mg-based screws (one Mg–10Gd and one Mg–5Gd) or two non-Mg screws (PEEK and Ti), and the allocation was ran-dom. The flapwasthen sutured with a resorbableVycril 4.0 su-tureinthemuscular layerandasilk sutureinthe skin.An anal-gesic dose ofBuprenorfin of 0.01–0.05mg/kg (Temgesic, Indivior EuropeLimited,Dublin, Irleand)wasgiven. Theratswere housed incagesingroupsof2or3animalseach.Theywerefedadlibitum andanti-inflammatorymedicationswere administeredtheday af-terthesurgery.Overall,18ratswereimplantedpermaterialgroup andtimepoint,i.e.108animalsoverall.
2.3. Sample processing for imaging
After 4,8or12weeksofhealingtheratswere euthanizedby alethaldoseofanaesthetic.Aftertheratsweresacrificed,thelegs were dissected to extract the tibia and then cylindrical or box-shaped explantswith a diameter/width of 5 mm were cut from the rat’s femur withrotating burs under irrigation. The samples were dehydratedin increasing concentration ofethanoland then theywerecriticalpointdriedforhigh-resolutioncomputed tomog-raphy experiments. The bone-implants blocks were subsequently rehydrated and embedded in methylmetacrylate by LLS Rowiak LaserLabSolutionsGmbH (Hanover,Germany).Forthepresent ex-periment,explantsoriginatingfrom30ratswererandomlychosen. Namely,9ratssacrificedat4weeks,with3Mg–10Gd,3Mg–5Gd, 3Tiand0Peek;10ratssacrificedat8weeks,2Mg–10Gd,3Mg– 5Gd,3Peek,2Ti;and11ratssacrificedat12weeks,3Mg–10Gd,3 Mg–5Gd,3Peek,2Ti.Theembeddedexplantswerecutintohalves along the implant long axis using a 0.2 mm diamond band saw (Exakt Saw 300 CL, Exakt Technologies, Inc. OK, USA). Subse-quently,onehalfwasprocessedbyLLSRowiakforX-rayscattering experimentsbylaser cutting.Threetofivethinsectionsof10μm thickness were cut using laser cutting and mounted on kapton tape.
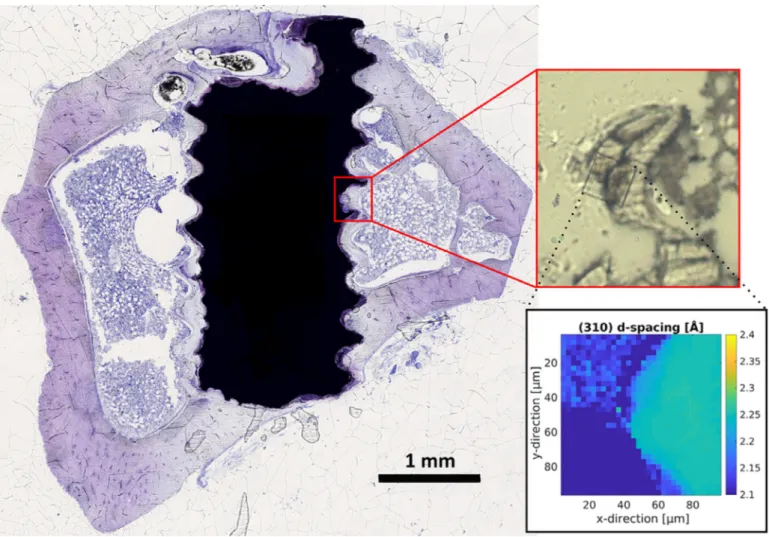
Fig. 1. Exemplary histological thin section of a Mg–5Gd implant after 12 weeks of healing time stained with toluidine blue. The red-boxed subfigure shows a zoom into the scanned region of 90 μm × 90 μm in the corresponding thin section of the sample mounted on kapton tape. The rectangular scanned region is clearly discernible due to the damage the focused X-ray beam causes within the kapton tape. An exemplary map of the computed (310) lattice spacing for this region is displayed within the black box. A difference in lattice spacing between the degradation layer of the screw (upper left corner) and the bone (right hand side) is visible. (For interpretation of the references to color in this figure legend, the reader is referred to the web version of this article.)
2.4. Small angle X-ray scattering and X-ray diffraction experiments Experiments were performed in two separate beam times at the P03 nano-focus end station [27 ,28] at the PETRA III storage ring, Deutsches Elektronen-Synchrotron (DESY). The X-rayenergy was set to 12.8 keV and 13.7 keV, respectively. A Pilatus 1 M detector(DECTRISLtd.,Baden-Daettwil,Switzerland)atadistance ofapproximately 2.24m behindaflight tubewasused toobtain theSAXSsignalandaLAMBDA750kdetector(X-SpectrumGmbH, Hamburg, Germany) was placed at an angle next to the flight tube at a distanceof approximately 18–19cm to the focal point to record the XRD signal. Calibration of the XRD detector was performedusinglanthanum hexaboride, whilst theSAXSdetector wascalibrated usingsilverbehenate. Regionsof90 μm× 90μm were scanned witha step size of 2.88μm. Exposuretimes were set to 5(at 13.7 keV) and10 (at12.8 keV) seconds,respectively. Using a custom-build frame, 7 samples on kapton tape were mountedsimultaneously. Fig. 1 displaysan exemplaryhistological thinsectionofaMg–5Gdimplantafter12weeksofhealingtime. Thered-boxedsubfigureshowsazoomintothescannedregionin thecorresponding thinsectionofthe samplemounted onkapton tape. As the laser cannot penetrate the metal, only degradation layer and bone are cut and transferred onto the kapton tape. The rectangular scanned region is clearly discernible using light microscopy due to the damage the focused X-ray beam causes
Table 1
Number of regions at implant interface scanned per material and healing time. Healing time
Implant material 4 weeks 8 weeks 12 weeks Total
Mg–10Gd 4 4 6 14
Mg–5Gd 4 4 4 12
PEEK – 6 3 9
Titanium 7 9 6 22
Total number of scanned interface regions: 57
withinthekaptontape.Anexemplarymapofthecomputed(310) latticespacingforthisregionisdisplayedwithintheblackbox.It can be excluded that theradiation damage hadanyinfluence on theresultsasmultipleexposures atone spotonthe samplesdid notshowanychangeinthescatteringpattern.Furthermore,using microscopyitcanbe shownthatbonestructureandthedamaged areasaresituatedindifferentfocalplanes.
Table 1 showsthenumberofregionsfromthebone-implant in-terfacethatwereimagedpermaterialandtimepoint,with57 re-gionsbeingscannedoverall.Theregionstobescannedwere iden-tifiedusing an in-line microscope. Theywere selected tocontain thebone-implantinterface,whichcouldbeidentifiedbasedonthe threadmorphologyofthein-grownbone(seeredboxFig. 1 ),but placed randomly within the whole of the interfacial region. Ad-Please citethisarticleas:B. Zeller-Plumhoff,C. MalichandD. Krüger etal.,Analysis ofthebone ultrastructure aroundbiodegradable
4 B. Zeller-Plumhoff, C. Malich and D. Krüger et al. / Acta Biomaterialia xxx (xxxx) xxx
ARTICLE
IN
PRESS
JID:ACTBIO [m5G;November22,2019;9:35]
ditionally, one region of cortical and trabecular bone each were scanned as comparison for each material (two cortical regions fortitanium).Due to delaysin sampleprocessing, no samples of PEEKatthe4weektimepointwere processedforSAXSandXRD measurements.
2.5. Data processing
Data processing prior to and including azimuthal integration wasperformedusingDAWNScience(DiamondLightSource)[29] . Inparticular,deadpixelswereremovedfromtheSAXSdatausing ageometric mask, theq-range wascalibratedusingthe obtained calibration data. In the case of the XRD data hot pixels were removedusingathresholdsettoanintensityof1000a.u.andthe q-rangewascalibrated with the respectivecalibration data. Both data sets were then integrated azimuthally and stored into text filesfor furtherprocessing withMatlab R2017b (The MathWorks Inc., USA). The platelet thickness was computed from the SAXS datausingthestackofcardsmodel[30] .TheHAPorientationcan be computed from the SAXS signal as HAP c-axis and collagen fibersarealignedinparallel,thusresultinginananisotropicSAXS signal.Therefore,asinewavewasfittedtotheSAXSsignalinitially andrefinedusinga Gaussiancurve toestimatetheexact position andtheareaofthepeak.Thedegreeoforientationwascomputed bytheratiooftheintegratedsignalintensityoftheGaussiansum ofthe totalarea incl.the background[31] . Thisfactor thus gives the fraction of the oriented material and ranges between 0 (no preferential orientation) and 1 (fully ordered), i.e.a value of 0.2 indicates that 20%of thematerial in theprobed area is oriented inthe samedirection. The lattice constant forthe(310) reflex of hydroxyapatite was computed from the XRD data via the peak position of a Gaussian fit and the crystal width was computed usingtheScherrerequation[32] .Wedecidedtofocusonthe(310) reflectionasthis wasstrongest one inour detectable XRD range asthesetupwasoptimizedforSAXS.SeeFig. 2 foraschematicof thecomputedparameters.
For thesubsequent analysis, the scanned regions were identi-fiedwithin thethin section mounted on kapton tapeusing light microscopy.UsingAvizo9.4(FEISAS,ThermoScientificTM,France)
theregionsweresegmentedintobone,degradationlayerand back-groundviavisualcomparisonwiththeopticalimage.Fig. 3 shows thesegmentedimageforthescannedregiondepictedinFig. 1 .The averageofeachcomputedparameterwasthendeterminedforthe pixelsidentifiedasboneforeachregion.Forcomparison,mean lat-ticespacingandcrystalwidthwerealsodeterminedfortheregion area definedasdegradation layer. The divergence ofthe orienta-tion foreach scanned region was computedusing Matlab to as-sessthesimilarityof orientationsbetweendifferentpixels within thisregion.Thelowerthedivergence,themoresimilarthe orien-tations.ThegradientfunctioninMatlabwasusedtodeterminethe surfaceorientationofthebone.ItwasthencomparedtotheHAP orientation using Matlab. Subsequently, Matlabwas also used to performthe final analysis(means andstandard deviations) ofall determinedparameters.
3. Statisticalmethods
Fromeachscannedregion,themeanofeachcomputed param-eterwasdetermined.Fortheregionsofthecorrespondingmaterial and time point, the overall mean value and standard deviation ofthese means were then computed. These are displayed inthe graphsto follow.Aone-wayanalysisof variance(ANOVA)witha Bonferronicorrectionwasconductedtodeterminestatistically sig-nificantdifferences between the parameters at the bone-implant interface forthe different implant materials overall (p all) andfor
each healing time (p 4, p 8, p 12). I.e., for p 4 the values for a
pa-rameterofthe4 weekinterface regions werecompared, whereas for p all the valuesofall time pointsoftheinterface regions were
takeninto account. Additionally,foreach material, thecomputed parameters ateachtime pointwere comparedagainst eachother andagainst trabecular and corticalregions, respectively. The cor-respondingp-valuesaredenoted e.g.,by p Ti-4,8 whenthe4and8 week time pointsin titanium are compared, or p 5Gd-12,trab when
12 week time point and trabecular region of bone surrounding Mg–5Gd implants are compared. For legibility, any determined significancewasnothighlightedinfiguresbutonlywithinthetext.
4. Results
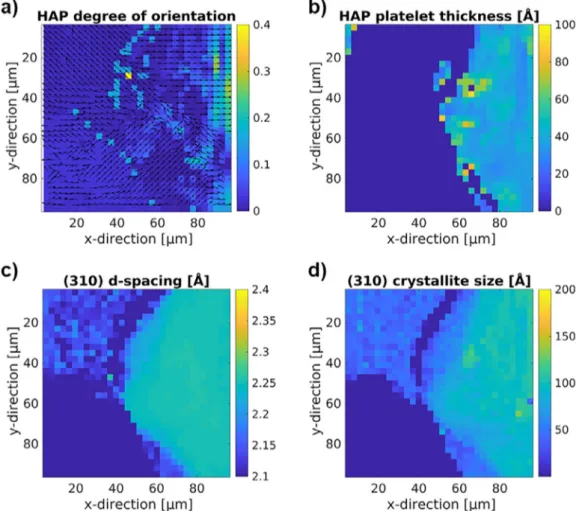
Fig. 4 showsmaps ofthe different computed parameters, i.e., HAPorientation anddegreeoforientation(Fig. 4 (a)),HAPplatelet thickness(Fig. 4 (b)),(310)latticespacing(Fig. 4 (c))andcrystallite size(Fig. 4 (d))fortheexemplaryregionhighlightedinFig. 1 .
Differences in the parameters can be seen between the up-per left corner, in whicha part ofthe implant degradation layer is visible and the right hand side of the region, which contains bone. Furthermore,the bone appears inhomogeneous,in particu-larwithrespecttoorientation.Thefitofthestackofcardsmodel designedtodeterminetheplateletthicknessbecomes untrustwor-thy within the degradation layer and near the implant interface andhasthereforebeenexcludedfromthefigureandtheanalysis intheseinstances.
Inthefollowing,weare presentingthequantitativeevaluation of all 57 scanned interface regions and8 trabecular and cortical references.
4.1. Hydroxyapatite platelet orientation
Fig. 5 (a)showsthedegreeoforientationinthebone surround-ing titanium,PEEK, Mg–5GdandMg–10Gd implantsfor 4,8and 12weekshealingtimesandinreferenceregionsintrabecularand cortical bone averaged over the respective regions. To determine how similarlythe plateletswere aligned, the meandivergenceof theorientation map wascomputedfor eachregion, seeFig. 5 (b). Furthermore, the difference between bone interface orientation and HAP orientation at the interface was computed (Fig. 5 (c)). Thereisnosignificantdifferenceindegreeoforientationbetween thematerials andhealingtimes.However, thereisa trend show-ing that the degree of orientation in bone surrounding titanium implantsis higher(0.11–0.19) than that around PEEK (0.05–0.13), Mg–5Gd(0.04–0.07)andMg–10Gdimplants(0.04–0.13).The diver-gence oforientation is significantly differentover all time points only between titanium and Mg–5Gd (p all < 0.001). The general magnitudeofthedivergencebetween0.1and0.4suggestsafairly well ordered orientation map. However, a difference of 15°–50° was found when comparing the bone surface orientation at the implant interface to the HAP orientation at the interface, thus indicating no preferential orientation of the HAP at the implant surface. No significant differences were found for the evolution ofdegreeoforientation, divergenceoforientationordifferencein surface to HAP orientation over time or between the trabecular andcorticalregionsandinterfaceregions.
4.2. Hydroxyapatite platelet thickness
TheHAPplateletthicknesswascomputedfromtheSAXSsignal and isdisplayed in Fig. 6 .Overall, the mean platelet thicknesses foreachmaterial andtimepoint areinrangesbetween23–46 ˚A. Therewerehowevernostatisticallysignificantdifferencesbetween materials,exceptbetweenPEEKandMg–10Gdatthe8weektime point (PEEK vs. Mg–10Gd p8 < 0.05). Furthermore,no significant
Fig. 2. Explanatory schematic of the computed parameters. The degree of orientation and thickness of the hydroxyapatite platelets are shown as well as the crystal lattice spacing and crystal size.
Fig. 3. Segmentation example of scanned region displayed in Fig. 1 (Mg–5Gd im- plant with 12 week healing time).
differenceswerefoundfortheevolutionofplateletthicknessover time orbetweenthetrabecularandcorticalregions andinterface regions.
4.3. Lattice spacing
The latticespacingforthe(310) reflectionoftheHAPinbone wascomputedfromtheXRDdata,seeFig. 7 (a).Similarly,the spac-ing was computed within the degradation layer of the Mg–5Gd andMg–10Gdimplantandcomparedtothebonesignal,asshown in Fig. 7 (b). The computed lattice spacing ofthe (310) reflection issignificantlyhigheraroundatitaniumimplantthanforMg–xGd implants(Tivs.Mg–10Gd p all <0.001,Tivs.Mg–5Gd p all < 0.05).
The (310)reflectioninbonesurroundingPEEKimplants,however, differs neither significantly from bone surrounding Mg–xGd nor titaniumimplants(Tivs. PEEK p all = =0.087).The lattice spacing
withinthedegradationlayerasdisplayedinFig. 7 bfurtherdiffers significantly from that in bone for Mg–10Gd (p all < 0.001). No
significant differences were found for the evolution of lattice spacingover time orbetweenthe trabecular andcorticalregions andinterfaceregionsinthesamematerial.
4.4. Crystal size
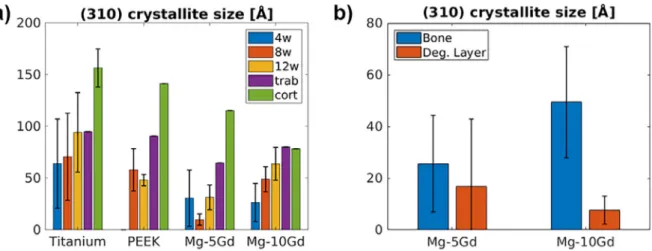
ThecrystalsizewascomputedfromtheXRDsignalofthe(310) reflectionandisshowninFig. 8 (a)fordifferentimplantmaterials andhealingtimes.Fig. 8 (b)showsthedifferenceincrystallitesize betweenbone and degradation layer for Mg–5Gd and Mg–10Gd. AsignificantdifferenceisapparentbetweenMg–5Gdandtitanium surroundingbone(p all <0.01, p 12 <0.05),aswellasbetweenbone
anddegradationlayer forMg–10Gd (p all < 0.001).Whilstno
sig-nificantdifferenceswerefoundforthetemporalevolutionof crys-talsize,bone surroundingPEEKshowedasignificantdifferencein crystalsizebetween8and12week time pointsandthescanned corticalregion(p Pe-8,cort <0.05, p Pe-12,cort <0.05).
5. Discussion
5.1. Hydroxyapatite platelet orientation
Themean degree oforientation of bonesurrounding titanium implantsin thisstudy is generallylower than that found previ-ously for bone forming around intramedullary nails (0.22–0.25) [23] .BonesurroundingMg-basedalloyswasfoundtobeina sim-ilarrange,though slightlylowerinnewlyformedbone inthe im-plantregionafter15monthshealingtime[22] .However,previous resultslackedstatisticalpowerandtheresultsshowninthisstudy showa largedeviationeven amongthesamematerial.Overall, it Please citethisarticleas:B. Zeller-Plumhoff,C. MalichandD. Krüger etal.,Analysis ofthebone ultrastructure aroundbiodegradable
6 B. Zeller-Plumhoff, C. Malich and D. Krüger et al. / Acta Biomaterialia xxx (xxxx) xxx
ARTICLE
IN
PRESS
JID:ACTBIO [m5G;November22,2019;9:35]
Fig. 4. Computed ultrastructural parameters for exemplary region from Fig. 1 (Mg–5Gd implant with 12 week healing time). (a) HAP platelet orientation (arrows) and degree of orientation (color scale), (b) HAP platelet thickness, (c) (310) lattice spacing and d) (310) crystallite size.
appearsthat themineralizationofHAParound titaniumimplants takesplaceinamoreorientedwayasthedegreeoforientation is higheranddivergencelower.Thestandarddeviationsarehowever verylargesuchthatnostatisticalsignificancecanbederived. 5.2. Hydroxyapatite platelet thickness
The computed mean platelet thicknesses for titanium of 32– 36 ˚Aare higherthan thosefound inthe literature,which ranged between20and25 ˚A[23 ,24] ,thismaybeduetoauseofdifferent animals,implantation sitesandhealingtimes(intramedullary nail inratsafter8weeks[23] andintervertebraldiskspaceinpigs af-ter6months[24] ).Ontheotherhand,theaveragethickness
com-putedforMg–5Gd(27–36 ˚A)andMg–10Gd(25–32 ˚A)issimilarly higherthanthatreportedforotherMg-basedalloys(19–23 ˚A)[22] , whichthereforeshowsasystemicbutcomparabledifference.
5.3. Lattice spacing
Thecomputedlatticespacingforthebonesurrounding degrad-able implants and PEEK (2.257–2.263 ˚A for Mg–10Gd, 2.263– 2.272 ˚A for Mg–5Gd, 2.264–2.275 ˚A for PEEK) is closer to that recordedforHAP(2.26–2.27 ˚A)[16 ,33 ,34] ,thanthelatticespacing measuredinbonesurroundingtitaniumimplants(2.281–2.292 ˚A). A comparison of the (310) signal between bone at the implant
Fig. 5. (a) Degree of orientation, (b) divergence of orientation and (c) difference in surface and hydroxyapatite orientation at the surface surrounding titanium, PEEK, Mg–5Gd and Mg–10Gd implants for 4, 8 and 12 weeks healing times and reference regions in trabecular and cortical bone. Results are shown as mean ± standard deviation.
Fig. 6. Hydroxyapatite platelet thickness in bone surrounding titanium, PEEK, Mg– 5Gd and Mg–10Gd implants for 4, 8 and 12 weeks healing times and reference regions in trabecular and cortical bone. Results are shown as mean ± standard deviation.
interfaceandregionsofdegradationlayerofMg–xGdshowsa sig-nificantshifttoasmallerlatticespacinginthedegradedimplant, see also Figs. 1 and 3 , which may be indicative of the formed apatiteincludingsignificantamountsofmagnesiumorgadolinium insteadofcalciumwithinthedegradationlayer,incontrasttothe surrounding bone [21 ,35] . We note that the incorporation of Mg orGdisonlydeducedbytheshiftofthediffractionpeakposition. As these changes are more pronounced in regions characterized as degradation layer, this is the most reasonable explanation which has also been observed by other authors [21] . This is in agreement with previous in vivo studies that have shown that whilstthedegradationlayerofMgalloysdoescontaincalciumand phosphorus, Mg is also still visible within [9] . The difference in latticespacingbetweentitanium,PEEKandMg–xGdimplantsmay bearesultofthedifferentmechanicalproperties,inparticularthe Young’s modulus, of the differentimplant materials. The Young’s modulus of Mg–xGd alloys and PEEK (approx. 45 GPa [36] and 4 GPa [37] , respectively) is more similar to that of bone [21 ,22] and much lower than that of titanium (105–118 GPa [38] ), thus presumablyresultinginadifferentfluidflowandthusmechanical stimulusexperiencedbythesurroundingosteocytes,whichinturn influencesthemineralizationofthenewbone.
5.4. Crystal size
Thecrystalsize ofMg–10Gd isin asimilar rangeto that pre-viously found forother biodegradable Mgalloys [21] .Changes in the (310) crystal size of the HAP have been shown to correlate witha deposit ofMgin the bone matrix,i.e. wherenormal lev-elsofMgare foundthe crystalsize rangesbetween55and70 ˚A andinregions whereanincrease ofMgwasseenthecrystalsize droppedto40–50 ˚A[21] .Similarly,thecrystalsizehasbeenshown to decreasewith increasing levels of Mgin synthesizedMg sub-stitutedHAP[39 ,40] .WhilstthecrystallitesizeofMg–5GdandTi aresignificantly different,thereisno such differencein compari-sontoPEEK,thusnot yieldingconclusiveevidencethat MgorGd aredepositedwithinthebonematrix.However,theHAP-like crys-talstructureofthedegradationlayerofMg–xGdscrewsis display-ingashifttolower(310)crystallitesizesandmoresoforahigher Gdcontent,which isthoughtto be indicativeofincorporation of Gdintothecorrosionproduct.
6. Conclusion
Inthe first study presentinga quantitative comparisonof the bone ultrastructure around biodegradable Mg-based alloys and PEEK and titanium implants, we have shown that most of the ultrastructuralparameters, in particularthe degree oforientation and other orientation parameters, as well as the hydroxyapatite plateletthickness,don’tdiffersignificantlybetweenmaterials.The (310)latticespacingandcrystalsizehoweverareimpactedand dif-fersignificantlybetweenbonesurroundingtitaniumandMg-based alloys.Thismayindicatethepossibledeposition ofMgwithinthe bonematrix.Furthermore,analysisofthedegradationlayerofMg– x Gdimplantsshowsthatwhilstapatiteformationcanbeobserved, itslattice spacingandcrystalsize differsignificantlyfromthat in thesurroundingbone.ThismaybeduetotheincorporationofGd into the apatite, which requires further investigation of the ele-mentalcompositionofthedifferentregions.Thisisparticularly rel-evant,asGdremainscontroversialintermsofitsunknownhealth impact [41 ,42] , and a local deposition of Gd at the implant site maybebeneficial.
To determine whether the presented two-dimensional in-vestigation of the ultrastructure is missing information, future studiesmayemploy three-dimensionaltechniquesof imagingthe ultrastructure[43–45] .Additionally,methodsdeterminingelement compositionneedtobeemployedtosupportthehypothesisonMg andGdincorporation resulting fromthis study.Furthermore, the
Fig. 7. Lattice spacing of the (a) (310) hydroxyapatite reflection in bone surrounding titanium, PEEK, Mg–5Gd and Mg–10Gd implants for 4, 8 and 12 weeks healing times and reference regions in trabecular and cortical bone. (b) Comparison of the mean lattice spacing over all time points within implant degradation layer and bone of the (310) reflection. Results are shown as mean ± standard deviation.
8 B. Zeller-Plumhoff, C. Malich and D. Krüger et al. / Acta Biomaterialia xxx (xxxx) xxx
ARTICLE
IN
PRESS
JID:ACTBIO [m5G;November22,2019;9:35]
Fig. 8. (a) (310) crystallite size in bone surrounding titanium, PEEK, Mg–5Gd and Mg–10Gd implants for 4, 8 and 12 weeks healing times and reference regions in trabecular and cortical bone. (b) Difference in (310) crystallite size for bone and degradation layer around Mg–5Gd and Mg–10Gd implants. Results are shown as mean ± standard deviation.
influenceoftheimplantmechanicalpropertiesontheboneshould be investigated inmore detail and compared to osseointegration indicatorsonthemicro-tomillimeterscale(e.g.,bone-to-implant contact).
DeclarationofCompetingInterest
Theauthorsdeclarethattheyhavenoknowncompeting finan-cialinterestsorpersonalrelationshipsthatcouldhaveappearedto influencetheworkreportedinthispaper.
CRediTauthorshipcontributionstatement
Berit Zeller-Plumhoff: Conceptualization, Project administra-tion,Formal analysis, Writing - review & editing.Carina Malich:
Formal analysis. Diana Krüger: Project administration. Graeme Campbell: Project administration. Björn Wiese: Resources.Silvia Galli: Resources. Ann Wennerberg: Conceptualization. Regine Willumeit-Römer: Conceptualization. D.C.Florian Wieland: For-malanalysis,Conceptualization,Projectadministration.
Fundingsources
Funding was provided by the Röntgen-˚Angström Cluster in projectSynchroLoad(05K16CGA),Swedish ResearchCouncil 2015-06109, and by the German Bundesministerium für Bildung und ForschunginprojectMgBone(05K16CGB).
Acknowledgment
TheauthorsthankAnton Davydokforsupportatthebeamline, HeikoRichterfromLLSRowiakLaserLab Solutionsforprocessing of samples for X-ray analysis andThomas Dose for construction ofthesampleholderframe.WealsothankDESYforgrantingP03 beamtimes11003686and11005218.
Supplementarymaterials
Supplementary material associated with this article can be found,intheonlineversion,atdoi:10.1016/j.actbio.2019.11.030 .
References
[1] F. Witte , N. Hort , C. Vogt , S. Cohen , K. Kainer , R. Willumeit , F. Feyerabend , Degradable biomaterials based on magnesium corrosion, Curr. Opin. Solid State Mater. Sci. 12 (5–6) (2008) 63–72 .
[2] F. Feyerabend , J. Fischer , J. Holtz , F. Witte , R. Willumeit , H. Drucker , C. Vogt , N. Hort , Evaluation of short-term effects of rare earth and other elements
used in magnesium alloys on primary cells and cell lines, Acta Biomater. 6 (5) (2010) 1834–1842 .
[3] N. Hort , Y. Huang , D. Fechner , M. Stormer , C. Blawert , F. Witte , C. Vogt , H. Drucker , R. Willumeit , K. Kainer , F. Feyerabend , Magnesium alloys as im- plant materials - Principles of property design for Mg–Re alloys, Acta Biomater. 6 (5) (2010) 1714–1725 .
[4] A. Sanchez , B. Luthringer , F. Feyerabend , R. Willumeit , Mg and Mg alloys: how comparable are in vitro and in vivo corrosion rates? A review, Acta Biomater. 13 (2015) 16–31 .
[5] F. Cecchinato , N. Agha , A. Martinez-Sanchez , B. Luthringer , F. Feyerabend , R. Jimbo , R. Willumeit-Romer , A. Wennerberg , Influence of magnesium alloy degradation on undifferentiated human cells, PLoS ONE 10 (11) (2015) 1–18 .
[6] N. Agha , F. Feyerabend , B. Mihailova , S. Heidrich , U. Bismayer , R. Willumeit-Romer , Magnesium degradation influenced by buffering salts in concentrations typical of in vitro and in vivo models, Mater. Sci. Eng. C Mater. Biol. Appl. 58 (2016) 817–825 .
[7] N. Agha , R. Willumeit-Romer , D. Laipple , B. Luthringer , F. Feyerabend , The degradation interface of magnesium based alloys in direct contact with human primary osteoblast cells, PLoS ONE 11 (6) (2016) 1–20 .
[8] A. Myrissa , N. Agha , Y. Lu , E. Martinelli , J. Eichler , G. Szakacs , C. Kleinhans , R. Willumeit-Romer , U. Schafer , A. Weinberg , In vitro and in vivo comparison of binary mg alloys and pure Mg, Mater. Sci. Eng. C Mater. Biol. Appl. 61 (2016) 865–874 .
[9] I. Marco , A .A . Myrissa , E. Martinelli , F. Feyerabend , R. Willumeit-Römer , A. Weinberg , O. Van der Biest , In vivo and in vitro degradation comparison of pure Mg, Mg–10Gd and Mg–2Ag: a short term study, eCells Mater. J. (2017) 90–104 .
[10] S. Weiner , H.D. Wagner , THE material BONE: structure-Mechanical function re- lations, Ann. Rev. Mater. Sci. 28 (1) (1998) 271–298 .
[11] D.S. Bocciarelli , Morphology of crystallites in bone, Calcif. Tissue Res. 5 (3) (1970) 261–269 .
[12] E. Beniash , Biominerals-hierarchical nanocomposites: the example of bone, Wi- ley Interdiscip. Rev. Nanomed. Nanobiotechnol. 3 (1) (2011) 47–69 .
[13] R.A. Robinson , An electron-microscopic study of the crystalline inorganic com- ponent of bone and its relationship to the organic matrix, J. Bone Joint Surg. Am. 34-A (2) (1952) 389–435 passim .
[14] S. Weiner , W. Traub , Bone structure: from angstroms to microns, FASEB J 6 (3) (1992) 879–885 .
[15] P. Fratzl , S. Schreiber , K. Klaushofer , Bone mineralization as studied by small- -angle X-Ray scattering, Connect. Tissue Res. 34 (4) (1996) 247–254 . [16] A .S. Posner , A . Perloff, A .F. Diorio , Refinement of the hydroxyapatite structure,
Acta Crystallogr. 11 (4) (1958) 308–309 .
[17] S. Rinnerthaler , P. Roschger , H.F. Jakob , A. Nader , K. Klaushofer , P. Fratzl , Scan- ning small angle X-ray scattering analysis of human bone sections, Calcif. Tis- sue Int. 64 (5) (1999) 422–429 .
[18] T. Nakano , K. Kaibara , Y. Tabata , N. Nagata , S. Enomoto , E. Marukawa , Y. Umakoshi , Unique alignment and texture of biological apatite crystallites in typical calcified tissues analyzed by microbeam X-ray diffractometer system, Bone 31 (4) (2002) 479–487 .
[19] M. Georgiadis , R. Muller , P. Schneider , Techniques to assess bone ultrastructure organization: orientation and arrangement of mineralized collagen fibrils, J. R. Soc. Interface 13 (119) (2016) .
[20] N.P. Camacho , L. Hou , T.R. Toledano , W.A. Ilg , C.F. Brayton , C.L. Raggio , L. Root , A.L. Boskey , The material basis for reduced mechanical properties in oim mice bones, J. Bone Miner Res. 14 (2) (1999) 264–272 .
[21] T. Grunewald , H. Rennhofer , B. Hesse , M. Burghammer , S. Stanzl-Tschegg , M. Cotte , J. Loffler , A. Weinberg , H. Lichtenegger , Magnesium from biore- sorbable implants: distribution and impact on the nano- and mineral structure of bone, Biomaterials 76 (2016) 250–260 .
[22] T.A . Grünewald , A . Ogier , J. Akbarzadeh , M. Meischel , H. Peterlik , S. Stan- zl-Tschegg , J.F. Löffler , A.M. Weinberg , H.C. Lichtenegger , Reaction of bone nanostructure to a biodegrading magnesium WZ21 implant – a scanning smal- l-angle X-ray scattering time study, Acta Biomater. 31 (2016) 448–457 . [23] R.M. Hoerth , M.R. Katunar , A. Gomez Sanchez , J.C. Orellano , S.M. Ceré, W. Wa-
germaier , J. Ballarre , A comparative study of zirconium and titanium implants in rat: osseointegration and bone material quality, J. Mater. Sci. Mater. Med. 25 (2) (2014) 411–422 .
[24] M.H. Bünger , M. Foss , K. Erlacher , H. Li , X. Zou , B.L. Langdahl , C. Bünger , H. Birkedal , F. Besenbacher , J.S. Pedersen , Bone nanostructure near titanium and porous tantalum implants studied by scanning small angle x-ray scatter- ing, Eur. Cell Mater. 12 (2006) 81–91 .
[25] S. Galli , On Magnesium-containing Implants for Bone Applications, Faculty of Odontology, Malmö University, 2016 .
[26] J. Moosmann , B. Zeller-Plumhoff, D.C.F. Wieland , S. Galli , D. Krüger , T. Dose , H. Burmester , F. Wilde , M. Bech , N. Peruzzi , B. Wiese , A. Hipp , F. Beckmann , J. Hammel , R.W. llumeit-Römer , Biodegradable magnesium-based implants in bone studied by synchrotron radiation microtomography, in: Proceedings of the SPIE 10391, Developments in X-Ray Tomography XI, 103910O, 2017 . [27] A . Buffet , A . Rothkirch , R. Döhrmann , V. Körstgens , M.M. Abul Kashem , J. Per-
lich , G. Herzog , M. Schwartzkopf , R. Gehrke , P. Müller-Buschbaum , S.V. Roth , P03, the microfocus and nanofocus X-ray scattering (MiNaXS) beamline of the Petra III storage ring: the microfocus endstation, J. Synchrotron. Radiat. 19 (Pt 4) (2012) 647–653 .
[28] C. Krywka , H. Neubauer , M. Priebe , T. Salditt , J. Keckes , A. Buffet , S.V. Roth , R. Doehrmann , M. Mueller , A two-dimensional waveguide beam for X-ray nan- odiffraction, J. Appl. Crystallogr. 45 (1) (2012) 85–92 .
[29] J. Filik , A.W. Ashton , P.C.Y. Chang , P.A. Chater , S.J. Day , M. Drakopoulos , M.W. Gerring , M.L. Hart , O.V. Magdysyuk , S. Michalik , A. Smith , C.C. Tang , N.J. Terrill , M.T. Wharmby , H. Wilhelm , Processing two-dimensional X-ray diffraction and small-angle scattering data in, J. Appl. Crystallogr. 50 (Pt 3) (2017) 959–966 .
[30] A. Gourrier , C. Li , S. Siegel , O. Paris , P. Roschger , K. Klaushofer , P. Fratzl , Scan- ning small-angle X-ray scattering analysis of the size and organization of the mineral nanoparticles in fluorotic bone using a stack of cards model, J. Appl. Crystallogr. 43 (6) (2010) 1385–1392 .
[31] S. Pabisch , W. Wagermaier , T. Zander , C. Li , P. Fratzl , Imaging the nanostructure of bone and dentin through small- and wide-angle X-ray scattering, Methods Enzymol. 532 (2013) 391–413 .
[32] P. Scherrer , Bestimmung der größe und der inneren struktur von kol- loidteilchen mittels röntgenstrahlen, nachrichten von der gesellschaft der wis- senschaften, göttingen, Math. Phys. Klasse 2 (1918) 98–100 .
[33] R.M. Wilson , J.C. Elliott , S.E.P. Dowker , Rietveld refinement of the crystallo- graphic structure of human dental enamel apatites, Am. Mineralog. (1999) 1406 .
[34] J.M. Hughes , M. Cameron , K.D. Crowley , Structural variations in natural F, OH, and Cl apatites, Am. Mineralog. 74 (7–8) (1989) 870–876 .
[35] Y. Li , C.P. Ooi , C. Philip Hong Ning , K. Aik Khor , Synthesis and characterization of neodymium(iii) and gadolinium(iii)-substituted hydroxyapatite as biomate- rials, Int. J. Appl. Ceram. Technol. 6 (4) (2009) 501–512 .
[36] Y. Xu , J. Li , Z. Zhong , K. Kainer , N. Hort , Effects of Gadolinium and Neodymium Addition on Young’s Modulus of Magnesium-Based Binary Alloys, Magnesium Technology 2017, Springer International Publishing, 2017 .
[37] J. Sandler , P. Werner , M.S.P. Shaffer , V. Demchuk , V. Altstädt , A.H. Windle , Car- bon-nanofibre-reinforced poly(ether ether ketone) composites, Compos. Part A Appl. Sci. Manufact. 33 (8) (2002) 1033–1039 .
[38] W.D. Callister , Materials Science and Engineering: An Introduction, John Wiley & Sons, Inc, New York, 2007 .
[39] E. Bertoni , A. Bigi , G. Cojazzi , M. Gandolfi, S. Panzavolta , N. Roveri , Nanocrystals of magnesium and fluoride substituted hydroxyapatite, J. Inorg. Biochem. 72 (1–2) (1998) 29–35 .
[40] A. Bigi , G. Falini , E. Foresti , A. Ripamonti , M. Gazzano , N. Roveri , Magnesium influence on hydroxyapatite crystallization, J. Inorg. Biochem. 49 (1) (1993) 69–78 .
[41] A. Myrissa , S. Braeuer , E. Martinelli , R. Willumeit-Römer , W. Goessler , A.M. Weinberg , Gadolinium accumulation in organs of Sprague-Dawley® rats after implantation of a biodegradable magnesium-gadolinium alloy, Acta Bio- mater. 48 (2017) 521–529 .
[42] J. Ramalho , R.C. Semelka , M. Ramalho , R.H. Nunes , M. AlObaidy , M. Castillo , Gadolinium-based contrast agent accumulation and toxicity: an update, AJNR Am. J. Neuroradiol. 37 (7) (2016) 1192–1198 .
[43] M. Georgiadis, Guizar-Sicarios M., Zwahlen A., Trüssel A.J., Bunk O., Müller R., Schneider P., 3D scanning SAXS: a novel method for the assessment of bone ultrastructure orientation, 71 (2015) 42–52.
[44] M. Liebi , M. Georgiadis , A. Menzel , P. Schneider , J. Kohlbrecher , O. Bunk , M. Guizar-Sicairos , Nanostructure surveys of macroscopic specimens by small- -angle scattering tensor tomography, Nature 527 (7578) (2015) 349 . [45] F. Schaff, M. Bech , P. Zaslansky , C. Jud , M. Liebi , M. Guizar-Sicairos , F. Pfeiffer ,
Six-dimensional real and reciprocal space small-angle X-ray scattering tomog- raphy, Nature 527 (7578) (2015) 353 .