IN
DEGREE PROJECT INDUSTRIAL ENGINEERING AND MANAGEMENT,
SECOND CYCLE, 30 CREDITS ,
STOCKHOLM SWEDEN 2017
Are hedge funds of benefit for
institutional investors in a low
interest-rate environment?
ADNAN AL-KHALAF
INOM
EXAMENSARBETE INDUSTRIELL EKONOMI,
AVANCERAD NIVÅ, 30 HP , STOCKHOLM SVERIGE 2017
Är hedgefonder förmånliga för
institutionella investerare i en
lågräntemiljö?
ADNAN AL-KHALAF
Are hedge funds of benefit for institutional
investors in a low interest-rate environment?
by
Adnan Al-Khalaf
Oskar Gustafsson
Master of Science Thesis INDEK 2017:162
KTH Industrial Engineering and Management
Industrial Management
SE-100 44 STOCKHOLM
Är hedgefonder förmånliga för institutionella
investerare i en lågräntemiljö?
av
Adnan Al-Khalaf
Oskar Gustafsson
Examensarbete INDEK 2017:162
KTH Industriell teknik och management
Industriell ekonomi och organisation
SE-100 44 STOCKHOLM
Abstract
In this study, we have first investigated how Swedish corporate pension funds have
responded to the prolonged low-interest rate environment by analyzing the annual
reports of the 20 largest Swedish corporate pension funds. Of these 20, only 10 were
used in this study. We were able to extract how these pension funds have allocated
towards different asset classes since 2006. Our results suggest that Swedish corporate
pension fund managers have increased allocation towards alternative investments and
reduced allocation towards fixed income assets. Allocation towards equity assets is
unchanged throughout the period. These findings suggest that Swedish corporate
pension fund managers have managed to incorporate predictive information in their
asset allocation based on the US pension fund market.
Secondly, we have constructed a replicating portfolio which represents the average
allocation strategy of a Swedish pension fund. We investigated the impact of increasing
allocation towards hedge funds. Our findings suggest that an optimal portfolio that
maximizes the risk-adjusted return should invest 29% of its wealth towards hedge fund
assets while increasing allocation towards fixed income assets and excluding equity
assets from the portfolio.
Key-words
Pension fund, Hedge fund, Optimal portfolio, Strategic asset allocation
Master of Science Thesis INDEK 2017:162
Are hedge funds of benefit for institutional investors
in a low interest-rate environment?
Adnan Al-Khalaf
Oskar Gustafsson
Approved Examiner Cali Nuur SupervisorTomas Sörensson
CommissionerOE Capital
Contact personMagnus Oscarsson
Examensarbete INDEK 2017:162
Är hedgefonder förmånliga för institutionella
investerare i en lågräntemiljö?
Adnan Al-Khalaf
Oskar Gustafsson
Godkänt ExaminatorCali Nuur
HandledareTomas Sörensson
UppdragsgivareOE Capital
KontaktpersonMagnus Oscarsson
Sammanfattning
I denna studie har vi först undersökt hur svenska pensionsstiftelser har reagerat på den
långvariga lågräntemiljön genom att analysera årsredovisningarna för de 20 största
pensionsstiftelserna. Av dessa 20 användes hälften i denna studie. Från årsredovisningar
kunde vi avläsa hur pensionsstiftelserna valt att fördela sin allokering i olika
tillgångslagar sedan 2006 fram till 2015. Våra resultat tyder på att svenska
pensionsstiftelser ökat sin allokering i alternativa investeringar samt minskat sin
allokering i räntebärande tillgångslagar. Allokeringen i aktiemarknaden har varit
oförändrad under den studerade perioden. Dessa resultat tyder på att svenska förvaltare
lyckats inkorporera ”predictive information” i sin allokeringsstrategi som är baserad på
den amerikanska pensionsfondsmarknaden.
Vidare har vi byggt en replikerande portfölj som representerar en svensk
pensionsstiftelses genomsnittliga allokeringsstrategi. Vi undersökte effekten av att öka
allokeringen mot hedgefonder. Våra resultat tyder på att en optimal portfölj som
maximerar den riskjusterade avkastningen bör allokera 29% av sin förmögenhet mot
hedgefonder och samtidigt öka sin allokering mot räntebärande tillgångsslag och helt
utesluta aktierelaterade investeringar.
Nyckelord
Acknowledgements
We would give a special thanks to Magnus Oscarsson and Tom Engman at OE Cap-ital who have provided us with insight and inspiration when we most needed. We would also like to thank Christer Wanngård and Per Olofsson at Sjunde AP-fonden for taking the time to talk to us and providing us with valuable insight. Moreover, we want to dedicate a special thanks to Sadaf Nykiar at BNP Paribas for providing us with financial data.
Lastly, we would like to thank Tomas Sörensson who have helped us in our mission to earn a Master of Science degree.
Contents
List of Tables x List of Figures xi 1 Introduction 1 1.1 Background . . . 1 1.2 Problematization . . . 3 1.3 Purpose . . . 3 1.4 Research Questions . . . 3 1.5 Expected Contribution . . . 41.6 Assumptions and Delimitations . . . 4
1.7 Subsequent Chapters . . . 4 2 Methodology 6 2.1 Research Process . . . 6 2.2 Literature Review . . . 7 2.3 Data Collection . . . 7 2.3.1 Sample Time . . . 7
2.3.2 Pension Fund’s Annual Reports . . . 7
2.3.3 Historical Prices . . . 8 2.4 Quantitative analysis . . . 10 2.4.1 Statistical tools . . . 11 2.5 Source Criticism . . . 12 2.6 Reliability . . . 12 2.7 Validity . . . 12
3 Literature & Theoretical Framework 13 3.1 What is a Hedge Fund . . . 13
3.2 What is a Pension Fund . . . 15
3.3 Previous Research . . . 17
3.3.1 Allocation towards Hedge Funds . . . 17
3.3.2 Responses to Low Interest-Rate Environment . . . 18
3.4 Portfolio Theory . . . 19
3.4.1 Strategic Asset Allocation with Mean-Variance Optimization . 19 3.4.2 The Assumptions of Mean-Variance Optimization . . . 23
4 Results 26
4.1 Studied Pension Funds . . . 26
4.2 Pension Fund’s Asset Allocation . . . 27
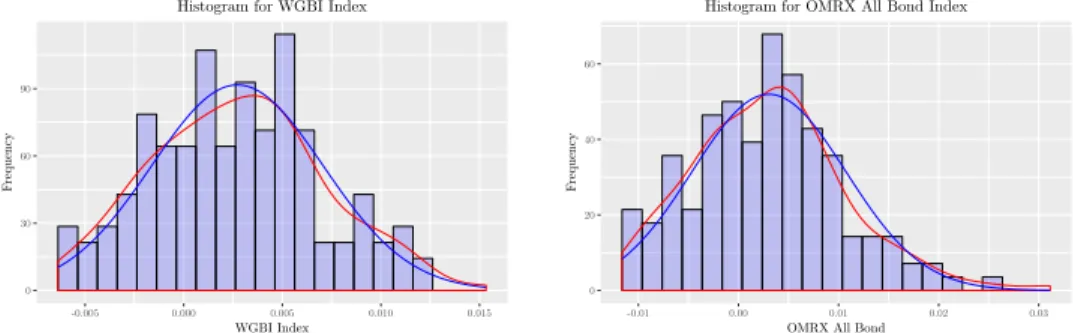
4.3 Distribution of Asset Returns . . . 29
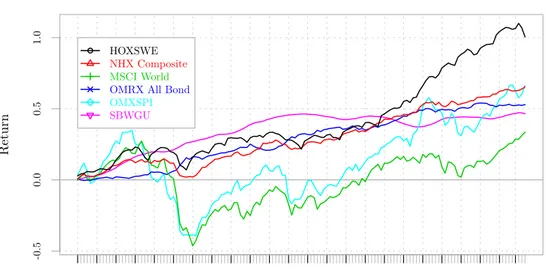
4.4 Cumulative Return of Indices . . . 31
4.5 Efficient Frontier . . . 32
4.6 Cumulative Portfolio Return . . . 34
4.7 Drawdown . . . 36
5 Discussion 38 5.1 Pension Funds Asset Allocation During the Period . . . 38
5.1.1 Comparison to Previous Research and Theory . . . 39
5.1.2 Analysis of Method . . . 40
5.2 Optimal Allocation Policy . . . 41
5.2.1 Comparison to Previous Research . . . 43
5.2.2 Analysis of Method . . . 44
6 Conclusion, Implication and Future Research 46 6.1 Answering the Research Questions . . . 46
6.2 Implications . . . 47
6.3 Future Research . . . 48
References 49
List of Tables
4.1 20 largest pension funds based on market capitalization . . . 26
4.2 Pension funds included in the analysis . . . 27
4.3 Portfolio allocations . . . 27
4.4 Portfolio allocations year-by-year . . . 28
4.5 Portfolio allocations domestic/foreign . . . 28
4.6 Skewness/Kurtosis test . . . 30
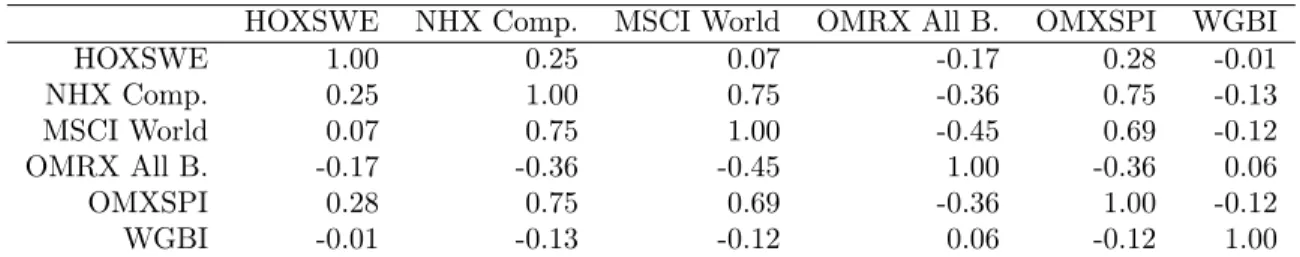
4.7 Indices summary . . . 32
4.8 Correlation matrix . . . 32
4.9 Default portfolio asset constraints. . . 33
4.10 Return to CVaR ratios for each constraints. . . 34
4.11 Portfolio weights for each scenario optimal portfolio. . . 35
List of Figures
1.1 Historical interest rate levels . . . 1
2.1 Illustration of the research process. . . 6
3.1 Illustration of an efficient frontier . . . 22
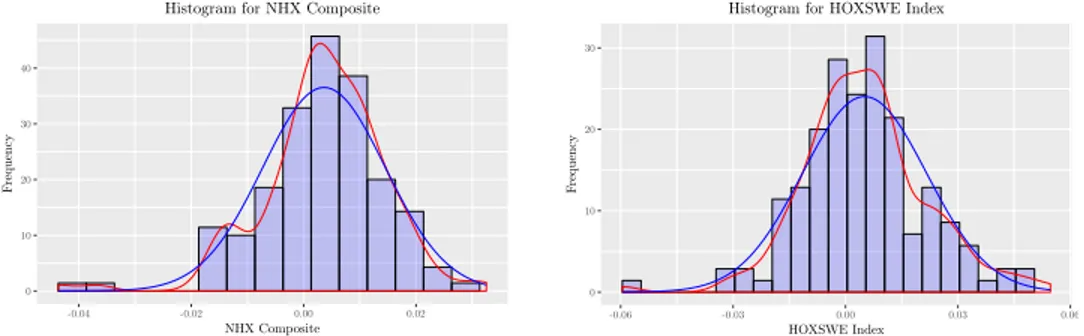
4.1 Histogram of NHX and HOX returns . . . 29
4.2 Histogram of MSCI and OMXSPI returns . . . 29
4.3 Histogram of WGBI and OMRX all Bond Index returns . . . 30
4.4 Cumulative returns for studied indicies . . . 31
4.5 Efficient frontiers with different HF constraints. . . 34
4.6 Portfolio weights for each scenario optimal portfolio. . . 35
4.7 Cumulative returns for each scenario optimal portfolio . . . 36
4.8 Drawdown for the different hedge fund allocation policies . . . 37
A.1 SEB-stiftelsen allocations . . . 53
A.2 Svenska Handelsbankens Penssionsstiftelse allocations . . . 53
A.3 Ericsson Pensionsstiftelse (A) allocations . . . 54
A.4 ABB-Koncernens Pensionsstiftelse allocations . . . 54
A.5 Postens Pensionsstiftelse allocations . . . 55
A.6 Praktikertjänst AB:s Pensionsstiftelse allocations . . . 55
A.7 Electrolux-koncernens Pensionsstiftelse allocations . . . 56
A.8 Danske Bank, Sverige Filias Pensionsstiftelse allocations . . . 56
A.9 Stora Ensos Svenska Gemensamma Pensionsstiftelse allocations . . . . 57
1
Introduction
In this chapter we will give a background of the existing problem followed by the purpose, research question, assumptions and delimitations, and lastly the expected contribution of this study.
1.1
Background
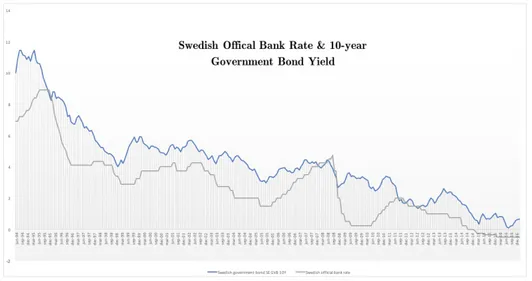
The current market condition with its low interest rate environment presents chal-lenges for investors, in particular for institutional investors. Both short-term and long-term interest rates have been at historic lows for several years in Sweden as well as for other parts of the globe. In July 1995, the official Swedish bank rate was offered at 8.91% compared to today’s record low -0.50%. During the same period we also see a similar downward trend in the Swedish 10-year government bond yield, exhibiting a decline from a 10.01% rate to today’s 0.66% (Svenska Riksbanken, 2017).
Figure 1.1: In blue: Swedish 10-year Government Bond Yield. In gray: Swedish official bank rate. From June 1994 to February 2017 in percent (%).
The prolonged decline in interest rates have led to a substantial and lasting change in investment opportunities in financial markets. This unfamiliar new position for investors are acknowledged by Bams et al. (2016), who argues that the new climate presents new challenges for pension funds and institutional investors. One conse-quence for pension funds have been a considerable increase in the present value of liabilities for Defined Benefit (DB) plans. At the same time, due to lower expected returns, fixed-income as an asset class has become less attractive which has implica-tion for Defined Contribuimplica-tion (DC) as well as for DB funds. According to literature on return predictability (Fama and French, 1989; Ang and Bekaert, 2007) there are
expected responses from investors for these types of changes in investment opportu-nities, and also that long-term investors can benefit by incorporating this information into their asset allocation (Campbell et al., 2003; Hoevenaars et al., 2008). However, Bams et al. (2016) show that there seems to exist some discrepancy within the pen-sion fund market. They find that penpen-sion funds overall have reduced their allocation to equity and increased their allocation to fixed-income and alternative asset classes during a transition into a low-interest environment, which is inconsistent with the financial literature. They come to the conclusion that pension funds are unable to incorporate this predictive information in an optimal way.
Bouvatier and Rigot (2013) investigated how US and Canadian pension funds be-haved during a lasting decline in long-term interest rates and where these pensions funds had to look for other sources of higher return. They describe how management is reorganized in order to improve their strategic asset allocation. An important aspect in this reorganization are the composition of a “satellite component” in the asset allocation. This satellite component looks for higher performance and better diversification (i.e., higher alpha and improved beta) and almost exclusively focus on alternative investments. They argue that the hedge fund industry, with its high and allegedly uncorrelated returns, seems therefore particularly attractive for this com-ponent.
Originally, investing in hedge funds has exclusively been investments for wealthy in-dividuals and families. First in early 2000’s did we begin to see increasing use of hedge funds from institutional investors as they started to improve their diversifi-cation and start to allocate more wealth to alternative investments (Bouvatier and Rigot, 2013; Preqin, 2016). Studies suggest that institutional investors seek to invest in hedge funds in order to achieve; reduced volatility, diversification effect, and abso-lute return. In short, hedge funds are attractive to investors because they believe that hedge funds offer the potential to increase expected return at the expense of little or no change in portfolio risk. In 2016, there are over 5000 institutions tracked that are invested in hedge funds, with this number growing on a daily basis (Preqin, 2016). While many would agree that hedge funds are attractive because of their potential to enhance risk-adjusted performance, they would also agree that allocations to hedge funds are difficult to analyze. Their light regulation and specific governance raise issues that exceeds those of traditional investments. Issues that include risks and challenges in terms of: valuation, liquidity, and operational risk. Mainly it is the lack of transparency and limited information on the valuation of and the assets underlying the investments that give rise to the uncertainties for the investors (Bouvatier and Rigot, 2013). These are factors that can be viewed as underlying reasons of some
notable investors - including CalPERS1and Railpen2- withdrawing their hedge fund
allocation from their portfolio recent years.
1.2
Problematization
The prevailing low-interest environment that we are experiencing are presenting new challenges for institutional investors that traditionally and primarily are invested in fixed income. Decline in interest rates consequently translates into decline in in per-formance and investors have to seek for other sources of return. Hedge funds have long exhibit features of uncorrelated and absolute returns. These characteristics are attractive for investors and we are learning that the hedge fund industry is at its peak level. Portfolio managers sees the asset class as an option in their aim to cope with declining performances. However, the hedge fund industry has previously had negative connotations in terms of security and transparency and has been criticized by traditional investors. The discrepancy is becoming increasingly apparent as the growing criticism has led to notable institutions withdrawing their hedge fund al-locations. These uncertainties that the hedge fund industry demonstrates makes it difficult for institutional investors to mandate more allocation towards the asset class. As managers sees the potential benefits of making hedge funds a more significant as-set class in their portfolio, they also recognize that there are uncertain implications that it will bring and this makes it difficult to justify increased allocations.
1.3
Purpose
Firstly, the purpose of this paper is to analyze the pension fund industry and to assess how it have responded to the prolonged low-interest rate environment. Secondly, the aim is to investigate implications of allocating pension fund assets to the hedge fund industry. To evaluate the potential benefits of hedge fund investments with respect to risk-adjusted returns.
1.4
Research Questions
Given this purpose we will investigate and answer the following; Research Question 1 (RQ1)
"How has pension funds responded to the recent year’s low-interest levels?"
Research Question 2 (RQ2)
1The California Public Employees’ Retirement System decided to divest its entire $4 billion from
hedge funds(Marois, 2014).
2Britain’s railway pension scheme decrease their hedge fund allocation significantly (Cohn and
"What hedge fund allocation policy contribute to the highest risk-adjusted return for pension funds?"
1.5
Expected Contribution
Due to the discrepancies brought up in Section 1.2 we aim to investigate the pension and hedge fund industry in order to contribute to a more sound investment climate. Previous research have shown conflicting results regarding the performance of hedge funds. This knowledge could be important for institutional investors as it could affect future investment decisions.
1.6
Assumptions and Delimitations
In this study, we have made a number of assumptions and delimitations which we will describe below.
• In this paper we have conducted the study in the context of the Swedish market. An assumption made is therefore that behaviour and results that are derived from the Swedish pension fund industry is a reflection of the general industry. • We have assumed that Swedish corporate pension funds choose to invest in
hedge funds in the Swedish and Nordic market with the motivation that home-bias is reasonable to assume. Also, we have delimited the study from the al-ternative to invest in hedge funds with certain strategies for pension funds. Therefore the NHX Composite index is regarded as a acceptable general repre-sentation for hedge funds investments for Swedish corporate pension funds. • We have assumed that Swedish corporate pension fund’s real-estate investments
consist of direct ownership. This assumption motivates the use of Valuegards Nasdaq OMX Valueguard-KTH Housing Index (HOX).
• The cost of investing in different asset classes is something that this study has not accounted for and chosen to delimit.
• We have chosen to delimit this study to only regard risk as the movements of the prices/returns (variance) of the underlying assets.
1.7
Subsequent Chapters
The remainder of the paper is organized as follows:
• Section 2 clarifies the methodological approach of the paper.
• Section 3 will present background literature, review previous research, and present theories connected to the subject.
• Section 4 presents the results of the empirical study.
2
Methodology
In this chapter, we will present the method that will be utilized in order to realize the purpose of the study and to answer the research questions.
2.1
Research Process
Figure 2.1: Illustration of the research process.
Figure 2.1 demonstrates the research process that has and will be used in this pa-per. Firstly, we identified a problem which led to a problem formulation according to Chapter 1.2. This was followed by stating our research questions. Onwards, we will conduct a literature review and an empirical study including analysis of finan-cial data. Once the results from the empirical study are extracted, the results will be analyzed. The results and our analysis of the results will form the basis of our conclusions and recommendations that we will conduct as a last step.
Given the purpose of this paper, we will conduct a literature review including pre-vious research within the field. This will be performed in order to clarify various phenomenon’s in the right context and give us a deeper understanding of the studied area which in turn will help us answer our defined research questions. Once this is done, we will acquire relevant theory that will help us to perform the research in an academically correct manner. An empirical study will be conducted through the gathering and calculations of financial data that will be described in the following sections. Lastly, we will perform an analysis and discussion on the obtained results from the empirical data, based on the empirical study and the literature review – according to the illustrated research process in Figure 2.1.
This study will be performed in a deductive manner and findings from the quantitative study will be compared to theory and literature. This approach will help us answer our research question as general results can be found with such a research design. By being aware that a deductive research design might lead us to be less critical, we will work more critically throughout the study (Collis and Hussey, 2013).
2.2
Literature Review
The literature that will be used in this study will be collected throughout the research process, however primarily at the beginning. Firstly, a general search on topics regard-ing pension funds, hedge funds and low interest rate environment will be performed and will be narrowed down and become more specific as we identify relevant topics. These searches will be performed in search engines including KTH Primo, Google Scholar, Diva portal and SSRN. Furthermore, articles and journals will also be part of our literature review. To increase validity of the study we will perform the searches in both Swedish and English in order to capture what research that have been con-ducted in the Swedish financial market as well as the foreign, in particular American market. We are aware that there are differences in the Swedish and foreign markets as size and regulations differ and will therefore account for those differences in our study. The following search words will be used in this study:
Pension funds, Hedge fund, Hedge fund allocation, Pension fund allocation in low interest rate environment, Hedge funds and low interest rate environment, Hedge funds and macro-economic variables, Optimal hedge fund allocation, Optimal portfolio theory, Efficient frontier, Mean-variance framework, Expected Shortfall and Efficient frontier
2.3
Data Collection
An important part of this study will be based on historical data. The data that will be required for this study are: information on asset allocation from pension fund’s annual reports for the studied period, historical; hedge fund-, bond-, real estate- and stock- prices.
2.3.1 Sample Time
To increase the validity of the study we will select historical data with a time horizon of 10-years in order to capture different macro-economical states, including periods of: a prolonged decline of interest-rates, generally rising stock-prices, and generally de-clining stock-prices – starting from 2006. This selection is due to the impact all these states have on overall performance for investors and their strategic asset allocation. 2.3.2 Pension Fund’s Annual Reports
To get information on pension funds strategic allocation and how these have changed during the time period, the collection of their annual reports and the interpretations of these are to be conducted. This will help us answer research question 1. Swedish pension funds are obligated by Swedish regulations to provide an annual report to Länsstyrelsen and these reports are public and can be acquired from Länsstyrelsen. This fact supports the reliability of the study since the data gathering are fully
replicable. Stockholms Länsstyrelse only store annual reports dated five years back in time and the rest is stored in Stadsarkivet. This means that Stockholm based pension fund’s annual reports will need to be acquired from Stadsarkivet. Since Länstyrelsen have a database of all Swedish pension funds, we will request a list of all pension funds with market capitalization information. We will then sort the list and collect the twenty largest – in terms of market capitalization – pension funds. Once the list is obtained we will contact Länsstyrelsen and Stadsarkivet and request the annual reports for each pension fund in our obtained list. From the annual reports we will be able to extract important information about allocation for each pension fund. We have chosen a time frame of 10 years, between 2006 and 2015, in order to recognize if the allocation policy have changed over time. The pension funds that will be studied can be observed in the table below.
2.3.3 Historical Prices
In order to answer our second research question; “what hedge fund allocation policy contribute to the highest risk-adjusted return for pension funds?", we will need to replicate a pension fund portfolio which typically consists of the asset classes: fixed income, real estate, stocks and hedge funds. Through the analysis of the annual reports we will be able to get information on the asset class allocation structure for pension funds. Index data will be used as a proxy for each asset class. This implies that our study will be based on secondary data (Collis and Hussey, 2013) meaning that we will need to use reliable databases. Since we will use index data for our study, we will need to ensure that their way of collecting data can be trusted and we will need to assure that we use indices that represent Swedish pension fund’s allocation strategies by using the correct markets. This is an important aspect to consider since we want to make a comparable study. Furthermore, monthly data will be used for each asset class.
Stocks & Equity Funds
When replicating a pension fund’s portfolio we will group stocks and equity funds together. We will however differentiate between domestic and foreign stocks and eq-uity funds.
Swedish stocks and equity funds will be represented by OMX Stockholm PI In-dex. This is an all-share index that represents the publicly traded stocks on the Stockholm Stock Exchange with the aim to represent the overall development of the market (NASDAQ, 2017).
Since Swedish pension funds allocate heavily towards Swedish stocks and equity funds we will choose to separate Swedish and foreign stocks and have two different indices. Foreign stocks and equity funds will be represented by MSCI World Index . This
index captures large and mid cap companies across 23 developed markets, including Sweden. With that said, we are aware that our replicating portfolio will be somewhat over-weighted towards Swedish stocks investments since MSCI World Index include Sweden, and this is something the reader should be aware of. We will not try to iden-tify the exact weighting towards each instrument that will give the best risk-adjusted return, we are rather looking to find the best allocation strategy.
The reason we will pick developed markets is because pension funds are risk averse and emerging markets could be regarded as high risk. Picking emerging markets would not represent a Swedish pension fund’s asset allocation in a correct manner. Bonds
Domestic bond investments will be represented by OMRX All Bond Index. The OMRX index represents the value growth for liquid interest-bearing Swedish bonds. The composite is based on bonds issued by the Swedish National Debt Office and Swedish mortgage institutions (NASDAQ, 2010)
Foreign bond investments will be represented by Citibank’s World Government Bond Index(WGBI). This index measures the performance of fixed-rate, local cur-rency, investment grade sovereign bonds. It is a widely used benchmark that currently comprises sovereign debt from over 20 countries, denominated in a variety of curren-cies. The WGBI provides a broad benchmark for the global sovereign fixed income market (Citi, 2017).
Real Estate
Real estate investments will be represented by NASDAQ OMX Valueguard-KTH Housing INDEX (HOX). This index is based on hedonistic price model that is updated monthly. HOX collects that data from Mäklarstatistik AB and is based on actual transactions. However, HOX collects data only on residential real estate that are sold as single family homes.
Hedge Funds
Hedge Fund investments will be represented by Nordic Hedge Index Composite (NHX). NHX tracks Nordic hedge fund manager’s performance on a monthly basis. It is important to highlight that NHX is representative for the industry and not of an investment hedge fund strategy in particular. In this study, we have delimited the use of particular hedge fund strategies and used NHX as overall representation of the asset class. The index is an equally weighted index towards the following hedge fund strategies:
• Equity focused funds - funds trading equity and equity derivatives3.
• Fixed Income funds - funds trading fixed income and derivatives3.
• Multi-strategy funds - funds are classified as multi-strategy if less than 80% of the fund’s activities comes from one particular classification category3.
• Managed Futures/CTAs - funds trading listed financial and commodity futures and foreign exchange, usually employing a systematic, model-driven approach3.
• Fund of hedge funds - funds investing in other hedge funds, regardless of fee structure3.
2.4
Quantitative analysis
The collected data from the annual reports will give us information about pension funds allocation policies, i.e. weightening towards each asset class. In order to get un-derstanding and inference about the risk-return structure for pension funds allocation policies, this information will be used together with portfolio theory (as explained in Section 3.4). And together with the collected historical data from the indices we will be able to calculate efficient frontiers, which are an integral aspect in portfolio theory for the risk-return analysis.
By analyzing the efficient frontier we will be able to analyze what type of hedge fund allocation policy that contribute to the highest risk-adjusted return for corpo-rate pension funds. One can state that portfolio A outperforms portfolio B if the expected return of portfolio A is greater than the expected return of portfolio B while the risk of portfolio A is lower or equal to portfolio B. It is therefore of interest to investigate the shape of the efficient frontier for the purpose of this study. By definition, no rational mean-variance investor would choose to hold any portfolio that is not located on the efficient frontier. The efficient frontier can be defined as the locus of all non-dominated portfolios in the mean-variance space (Danthine and Donaldson, 2005).
Using historical data to predict future outcomes is a common approach but still an assumption that needs to be highlighted. We will use historical data as a proxy for future outcomes, meaning that we will assume that historical information is a good indication of future outcomes. Furthermore, we wish to highlight that these results will be an approximation as there are other risks that needs to be accounted for such as currency risk, illiquidity risk, and market risk.
3 Hedge fund information gathered from Hedge Nordic’s website: http://nhx.hedgenordic.com
The calculations for the quantitative analysis are to be conducted in MatLab. The built in PortfolioCVaR() function are used to create a PortfolioCVaR object for con-ditional value-at-risk portfolio optimization and analysis. The PortfolioCVaR object workflow for creating and modeling a CVaR portfolio is:
- first create the object using function PortfolioCVaR(),
- define the asset returns and scenarios using function setScenarios(),
- specify the CVaR portfolio constraints and bounds using functions setDefault-Constraints() and setBounds(),
- specify probability level which the conditional value-at-risk is to be minimized using function setProbabilityLevel(),
- and estimating the efficient portfolios and frontiers using function estimateFron-tier().
2.4.1 Statistical tools
In the quantitative study there are certain statistical assumptions that has to be investigated. To assure that the inference from the quantitative analysis are valid following statistical tools will be used in the calculations.
Skewness
Skewness is a statistical measure used to describe the asymmetry of a distribution around the mean. A negative skew indicates that the tail on the left side of the probability density function is longer or fatter than the right side. Conversely, positive skew indicates that the tail on the right side is longer or fatter than the left side. Skewness measure does not distinguish between the shape of the distribution, i.e. long or fat. As a consequence, skewness does not obey a simple rule. For instance, a skewness value of zero means that the tails on both sides even out overall implying a symmetric distribution. However, this could also mean that one tail is long but thin and the other being short but fat.
Kurtosis
Kurtosis is another statistical measure used to describe the shape of a given distri-bution. This measure is related to the tails of a distribution and a higher kurtosis number is the result of infrequent extreme deviations (or outliers), as opposed to frequent modestly sized deviations.
Drawdown
Drawdown is a common risk measure that measures any time the cumulative returns dips below the maximum cumulative return. Drawdowns are measured as a percent-age of the maximum cumulative return, in effect, measured from peak (top) to the subsequent trough (bottom).
2.5
Source Criticism
One way to ensure the use of high quality sources is by finding three separate sources of information that leads to the same conclusion. This method will be used to the highest degree possible throughout this study. In the case where three sources are difficult to find, we will at least use two different sources that leads to the same conclusion. A single source that cannot be confirmed by another will thus not be used. We will use published books and articles as our primarily sources.
2.6
Reliability
According to Collis and Hussey (2013) results are considered to be reliable if a re-peat study obtains the same results as the original study. For an empirical study of quantitative nature it is therefore important to clearly describe the research design. The first part of this study is based on annual reports that can be obtained from Länsstyrelsen and Stadsarkivet as they are open to the public. This means that any-one would be able to obtain the same results given that the same pension funds are analyzed. However, some minor deviations might happen since interpretations and assumptions on what investment category an investment should represent will need to be made when none or limited information is available about a specific investment. The second part of the study would also fulfill the reliability requirement as we have specified each index that will be used to represent each investment category. We have also specified the studied period and the research design, i.e. maximizing the risk adjusted return based on an appropriate risk measure. Although some deviations regarding the exact weighting towards each asset class might take place, the same conclusions will be obtained. This means that this study is reliable and repeatability can be achieved.
2.7
Validity
Validity refers to the quality of a test and if it measures what is purported to measure (Collis and Hussey, 2013). In a quantitative study an important part is the use of a suitable method. In this study, we will investigate the assumptions of the mean-variance framework and based on the results choose appropriate risk-measure that account for the nature of the distributions of the returns for the studied asset classes.
3
Literature & Theoretical Framework
In this section we will present background information about Hedge funds and Pension funds, review previous research on low-interest environments and on asset allocation to hedge funds during such conditions, and lastly present relevant theory connected to the subject to be studied.
3.1
What is a Hedge Fund
Hedge funds are a part of the investment category that are seen as ‘alternative’ when compared to traditional asset class investments, e.g. mutual funds, equity and fixed income. Generally, alternative investments has more unregulated investment policies (AIFM - Directive 2011/61/EU). Hedge funds began as investment partnerships that could take long and short positions. Since then they have evolved into multifaceted organizational structures that are difficult to put into simple definitions. However, a number of features that characterizes hedge funds includes flexible investment strate-gies, relatively sophisticated investors, substantial managerial investments, and strong managerial incentives (Ackermann et al., 1999).
Ackermann et al. (1999) continues explaining that, due to a limited number of in-vestors, hedge funds typically are largely unregulated. This allows them to be ex-tremely flexible in their investment options allowing them to use short selling, lever-age, derivatives, and highly concentrated investment positions, in order to enhance returns or reduce systematic risk. They also have the option to move quickly across diverse asset classes in an attempt to time the market.
These structural aspects of hedge funds are in sharp contrast to the organizational structure of the more common investment option in mutual funds. Mutual funds are often regulated by the the financial supervisory authority4 and have prospectus
disclosure requirements, in order to keep their investors informed about their invest-ments and also limit potentially risky activities. These regulations and disclosure requirements generally limits mutual funds of using derivatives, short selling, and concentrate investments.
A downside for this flexibility that hedge funds are favoured by, can be that they are faced with advertising restrictions together with general capital inflow difficulties. Mutual funds and other traditional investment institutions can gather a lot of fund investors by promoting simple understandable strategies. Mass selling of hedge fund strategies tend to be more difficult to promote since these strategies usually are too complex for the typical investor to comprehend (Stulz, 2007). Hedge funds
fore typically attract mainly institutions and wealthy individual investors. These are investors who agrees to conditions which include higher minimum investment limits and liquidity lock-up periods.
Hedge funds are also characterized by strong performance incentives. Lan et al. (2013) studies the economics of hedge funds and in particular the management com-pensation. In their paper they explain that the typical management compensation for hedge funds features both management fee and performance-based incentive fees. The management fee is charged as a fraction of the Asset Under Management (AUM), e.g., 2%. However, what often differentiates hedge funds from mutual funds is the incentive fee. This fee is calculated as a fraction of the fund profit, e.g., 20%. The “two-twenty” compensation is often viewed as a industry norm.
Fung and Hsieh (1997) investigates the characteristics of the dynamic trading strate-gies of hedge funds, where they also discuss compensation structures as an underlying factor of the fund performance. For mutual funds, most managers have investment mandates with relative return targets. As they are typically limited to low or no leverage and also constrained to hold assets in a well-defined number of asset classes, their mandates are to meet or exceed the returns on these asset classes, e.g., a stock market benchmark index (Fung and Hsieh, 1997; Al-Sharkas, 2005). Knowing that the fund inflows have been going to the top-rated funds, rated according to their re-spective benchmark, and that mutual fund managers are compensated based on the amount of AUM. Thus, managers have an incentive to outperform their benchmark in order to increase their AUM and ultimately their compensation. This implies that they are likely to generate returns that tend to be highly correlated to the return of these benchmarks.
Hedge fund managers on the other hand derive a great deal of their compensation from incentive fees, paid only when the manager makes positive return. Also, a com-mon addition in their incentive contracts is the “high-water-mark” (HWM) feature, which keeps track of the maximum value of the invested capital and requires them to make up all previous losses before an incentive fee is paid (Fung and Hsieh, 1997). These conditions typically gives hedge fund managers investment mandates with ab-solute return targets, regardless of the market environment. To achieve abab-solute return they utilize their more flexible investment options that allows them to choose among more asset classes and to employ dynamic trading strategies that frequently involve leverage, short sales, and derivatives. This implies that these managers are more likely to generate absolute returns, contrary to mutual funds more relative re-turn.
Since hedge funds have a greater flexibility in their investment options it allows man-agers to employ various investment strategies. In order to compare performance,
risk and other characteristics, it is helpful to categorize hedge funds by investment strategies. A common way to classify hedge funds was described by Fung and Hsieh (1997) as a distinction of the “style” and “location” of the fund. Here, “style” refers to the type of position the fund manager is taking, such as taking long and/or short security positions e.g., betting on particular type of corporate events, or maintaining market neutrality. The concept of style is not relevant with mutual funds since im-plicitly this categorization has buy-and-hold, long-only style. A standard style here would then be something like; small cap value stock or large cap growth stocks. The stylistic differences for mutual funds involve only the location variable. With “loca-tion” it is referred to which assets and asset classes the strategy is applied to, such as equity, fixed income, currencies, commodity, as well as the geographical location. Another related approach is to separate hedge funds according to whether they are directional or market neutral (Connor and Woo, 2004). Directional funds take bets on market movements and consequently have a return strongly correlated with the market. Market neutral funds on the contrary keep a low correlation with the overall market return by applying derivatives and short positions. Hedge fund strategies are continually changing, limiting the attempts of establishing any formal classification for hedge funds. Hedge Fund Research (HFR), one of the main hedge fund databases, has however constructed a ‘Strategy Classification System’ for all investment man-agers present in their HFR Database, grouping them under five broad themes: equity hedge, event driven, relative driven, macro, and fund of hedge funds.
3.2
What is a Pension Fund
Institutional investors are defined as the professional management of assets on behalf of the majority of individuals. Under this definition pension funds are categorized as institutional investors (Basile, 2016). The characteristics of a pension fund can be described as a pool of assets that is formed with contributions to a pension plan for the purpose of financing pension plan benefits. The fund members have some claim against the assets of the pension fund. A pension fund can take on two different forms, either a special purpose entity with legal personality or a legally separated fund without legal personality managed by a financial institution on behalf of the fund members (Basile, 2016). Pension funds are subject to different regulatory framework compared to other institutional investors.
Swedish Regulations & Policies
A pension fund is an independent legal entity with its own board according to Swedish law. Being a legal entity, a Swedish pension fund must comply with the rules set by Act (1967:531) also called "Tryggandelagen" (Länsstyrelsen, 2017), which in the re-mainder of the paper will be referred to as the "assurance act". The assurance act consists of regulations regarding general provisions, accounting and supervision to
mention a few (Sveriges Riksdag). The purpose of a Swedish pension fund can only be to secure the promise of the employer’s pension obligations (Finansinspektionen, 2017). For pension funds allocating pension to at least 100 employees additional spe-cial provisions apply, e.g. regarding allocation. These provisions are supervised by the Swedish Financial Supervisor Agency (FSA), also known as Finansinspektionen (FI) (Länsstyrelsen, 2017).
A corporation that form a ’pension fund’ manages the occupational pension in the ’pension fund’ and it is seen as an alternative to hiring an insurance company (Palm, 2014). In March 2017 there are in Sweden 1657 registered and active pension funds, the pension fund with the greatest asset value being "Konsumentkooperationens pen-sionsstiftelse" with 22’938’769’000 SEK to manage5.
The assurance act has been in order since 1968 and in the act it is stated that the employer is indefinitely responsible for its pension commitments and that a pension fund cannot promise the pension. In other words, a pension fund is not entitled to pay out pension. Instead, the assets in the pension fund functions as security and the em-ployer is entitled to claim compensation for the pension costs that arise (Palm, 2014). Each and every business is entitled to form a pension fund with the purpose of secur-ing their employees occupational pension. Once the employer sets up a pension fund, it is up to the employer to make the necessary depositions. There are no restrictions or provisions regarding the magnitude of the first deposition (Palm, 2014). The em-ployer is also to provide an objective description where it should be stated whom are covered by the pension fund’s insurance. The provided objective description are installed as the pension fund’s statues/bylaws where it should also be stated the number of members the pension fund’s board is to have. According to the assurance act the employer and the beneficiaries must nominate as many members of the board each, with the aim that no single party solely determine the future of the pension fund (Palm, 2014). The board of the pension fund are entirely responsible for the management of the funds so as to best serve the pension fund’s defined objectives. The board are entitled to employ external managers, however the board can never neglect the responsibility for the management of the funds (Palm, 2014)
In the assurance act it is stated that the allocation of capital should be satisfactory without any further description regarding what satisfactory allocation implies. How-ever, according to Domstolsverket (1979) satisfactory allocation should be interpreted such that risk outweighs potential returns. Further guidelines are presented by the Swedish government proposition 2004/05:165 where it is stated that the prudent per-son rule should be the fundamental principle when allocating capital in a pension
fund (2004/05:165, 2005). The prudent person rule is aimed towards the decision process rather than the result of the allocated capital. This implies that a risky allo-cation could be regarded to follow the prudent person rule if the alloallo-cation decision is based on a well defined strategy. Conversely, a low risk allocation could breach the prudent rule principle (2004/05:165, 2005). Moreover, the members of the board are responsible for establishing an allocation policy and an impact analysis. The alloca-tion policy is the board’s main regulatory document and should be the basis of all allocations. The impact analysis is a report aimed to account for the financial con-sequences of the pension fund’s allocation policy/strategy (Finansinspektionen, 2005). Another restriction a Swedish pension fund must comply with regarding allocation is the fact that they are not allowed to hold any stocks in the pension fund’s company without the consent of the supervisory authority, i.e. Finansinspektionen (Palm, 2014). However, a pension fund is allowed to give a loan to the company which is something that favours both parties. The pension fund earns interest returns and the company is allowed to reduce its pension costs by the fact that the interest costs that normally would be payed to a bank is now in fact payed to the pension fund. Such loan can only take place if there exists a reassuring security. Furthermore, the pension fund is allowed to give compensations to the company that is equivalent to the company’s pension costs. This is possible if the net worth is higher than the value of the pension commitments. The pension fund is also allowed to give compensations from the year’s returns even though the net worth is lower than the value of the pen-sion commitments as the penpen-sion funds assets are not depleted if the compensation is from the year’s returns (Palm, 2014).
Moreover, pension funds should draw up annual reports independent of the com-pany according to the assurance act. The annual report should include an income statement, a balance sheet, notes and a management report. It is also mandatory for a pension fund to present the capital value of the pension commitments in the management report. A pension fund is obligated to have an accountant (Palm, 2014).
3.3
Previous Research
3.3.1 Allocation towards Hedge Funds
Hoevenaars et al. (2008) considers strategic asset allocation of long-term investors who face risky liabilities in the US in their paper and asks the question; is there more in the investment universe than stocks and bonds? In order to do this and study the risk characteristics of assets – other than just stocks and bonds – they extend the term structure of the risk-return trade-off6 for assets like commodities, credits,
real estates and hedge funds. To answer the question they derive the optimal asset
allocation and compare it with a suboptimal portfolio that is restricted to stocks, T-bills and bonds only. They show that the costs from investment constraints excluding hedge funds and credits are high for the long-term investor. The high sharpe ratio they derive implies that hedge funds are very attractive from a return enhancement perspective as well as liability hedge perspective.
Favre and Galeano (2002) recognizes the problems of non-normal distributed returns from hedge funds in their empirical study of a Swiss pension fund investing part of its wealth in hedge funds. They show that the traditional mean-variance framework as a performance measure is not optimal for hedge funds due to survivorship bias, liquidity risk, limited information on the valuation of the assets underlying the investments, etc. (Bouvatier and Rigot, 2013; Ackermann et al., 1999). Favre and Galeano (2002) develops a method based on a modified Value-at-Risk model to take into account the non-normality of asset returns. They show that even if you apply a Value-at-Risk modification and correcting for the non-normality, it is still beneficial – albeit not as high as predicted taking biases and liquidity risk into account – to invest in a well diversified hedge fund portfolio for an institutional investor.
3.3.2 Responses to Low Interest-Rate Environment
How should pension funds and institutional investors respond to a prolonged low interest rate environment according to the models of strategic asset allocation? Re-sults from the literature implies that they should increase allocations to equity and reduce allocations to bonds. Past empirical research has identified various economic variables as predictors for expected returns. Some of these variables are: short-term interest rate (Campbell, 1987; Ang and Bekaert, 2007); the yield spread between long-term and short-term interest rates (Shiller et al., 1983; Fama and French, 1989; Cochrane and Piazzesi, 2005); the dividend-price ratio (Campbell and Shiller, 1988; Fama and French, 1988). Bams et al. (2016) show how these predictive macroeco-nomic variables can be used when deriving optimal portfolios for long-term investors like pension funds. Using an approximate solution method for the optimal portfolio7
they show that for investors who faces time-varying investment opportunity (i.e. a lasting change in investment opportunities), portfolio allocation to stocks is; neg-atively related to short-term interest rates, negneg-atively related to yield spread and positively related to dividend-price ratio8. This indicates that when the short-term
interest rates decline, the allocations to stocks should increase in a portfolio. More-over, Ang and Bekaert (2007) shows that when short-term rates are low, the returns on equity tend to be high. In conjunction with these findings, Bams et al. (2016) exploits the observation using the time switching market-timing model for asset al-location9. The results again show that allocation to equity should be high when the
7Developed by Campbell et al. (2003). 8Opposite sign for excess bond returns. 9Developed in Ang and Bekaert (2002)
interest rates are low.
These findings imply that in low interest rate environments pension funds and insti-tutional investors should increase allocations to equity class and decrease allocation to fixed income if they were to follow the finance literature. However, Bams et al. (2016) have analyzed the fundamental changes in portfolios of pension funds in North America and identifies some discrepancy given these expected responses. Overall they find that pension funds have reduced their allocation to the equity asset class and increased their allocation to fixed income and alternative assets. This is inconsistent with the literature on return predictability from a market timing perspective. They suggest that pension funds are unable to incorporate these predictive information (e.g. that low-interest rates levels signals increase to equity and decrease to fixed income) in their strategic asset allocation.
When there is a decline in long-term interest rates, institutional investors and pension funds will have to look for other sources to achieve higher and sometimes required returns. Consequently, they tend to steadily reorganize their management in order to improve their strategic asset allocation. They employ a ‘core-satellite’ organization structure (Bouvatier and Rigot, 2013). It consists of defining a strategic asset alloca-tion where the assets are divided into two components: core and satellite. The core component’s (75%-90%) objective is to avoid risks related to the variability of the assets and aims to match liabilities of the pension funds. The assets can be manged either in an active or passive way, as well as internally or externally. Generally, these assets are invested in traditional asset classes in liquid markets, e.g., bonds and large cap equity. The satellite component (10%-25%) aims to achieve higher performance (by generating positive alpha returns) and for a better diversification (by improving beta). The satellite is exclusively managed externally since these investments requires specific expertise that pension funds usually do not have in-house. Consequently, the hedge fund industry seems particularly attractive for the satellite component, given their objective of high and allegedly uncorrelated returns.
3.4
Portfolio Theory
3.4.1 Strategic Asset Allocation with Mean-Variance Optimization A key step towards a quantitative and disciplined approach to strategic asset al-location was taken by Harry Markowitz, in his seminal article “Portfolio Selection” (Markowitz, 1952). The ideas expressed in that work constitutes the basis of what has to come to be known as Modern Portfolio Theory, Mean-Variance Optimization and Mean-Variance analysis. Further achievements acknowledged to Markowitz; the def-inition in technical and formal terms of the concept of diversification, and the notion
of the investor as a decision-maker in a two dimensional space, are worth mentioning and are integral to the theory (Basile, 2016).
Markowitz’s Mean-Variance Framework
The concept of diversification is quantified with reference to the statistical notion of covariance/correlation between asset classes. The portfolio variance are thereby defined not only in terms of the stand-alone risk of the asset classes, but also in terms of how one asset class interacts with another.
Regarding the investor as a decision-maker Markowitz (1952) rejected, unlike most previous authors, an investor profile aimed exclusively on maximizing expected re-turns. Instead he preferred an investor profile that considers expected return as ‘something desirable’ and variance in returns as ‘something undesirable’. The de-cision criterion known as the mean-variance principle derives from this notion of investor preference (Basile, 2016). The decision-criterion stipulates that for two port-folios, A and B, with expected return µA and µB and expected risk, σA and σB, A
can be said to dominate (be certainly preferable to) B if: µA> µBand σA≤ σB
with at least one verified strong inequality. Standard deviation of the return is the traditional statistical measure of the risk and corresponds to the dispersion of the returns around the mean.
Before introducing the portfolio optimization model, we first introduce some of the terminology that will be used10. The composition of a portfolio of N risky asset classes
(with N ≥ 3) is given by the vector w of size N × 1, where wi is the percentage of
asset class i in the portfolio:
w = w1 w2 ... wi ... wN where PN
i=1wi= 1or, equivalently, w’e = 1 with e’ = [1,1,...,1].
10Most of the theory and concepts regarding portfolio theory as reported in this section are taken
The properties of expected return and risk of the single asset classes can be repre-sented in the vectors µ and σ, respectively, both of dimension N × 1:
µ = µ1 µ2 ... µi ... µN , σ = σ1 σ2 ... σi ... σN .
The correlation matrix, C, and the covariance matric, Σ, both of dimension N × N, show information on the interaction (i.e. the relationship) between possible pairs of asset classes. This can be represented with the symbol ρij for correlation and the
symbol σij for covariance.
C= ρ11 ρ12 . . . ρ1i . . . ρ1N ρ21 ρ22 . . . ρ2i . . . ρ2N ... ... ... ... ... ... ρi1 ρi2 . . . ρii . . . ρiN ... ... ... ... ... ... ρN 1 ρN 2 . . . ρN i . . . ρN N , Σ = σ11 σ12 . . . σ1i . . . σ1N σ21 σ22 . . . σ2i . . . σ2N ... ... ... ... ... ... σi1 σi2 . . . σii . . . σiN ... ... ... ... ... ... σN 1 σN 2 . . . σN i . . . σN N
The terms ρii and σii on the main diagonal of the matrices C and Σ respectively
denote correlation and covariance of an asset class with itself, correpsonding to the values 1 and σ2
i. The terms σij (i.e. not on the main diagonal of the matrix Σ) is
equivalent to the expression ρijσiσj.
Using the stated parameters and notations, the expected portfolio return µP can be
calculated by either (3.1a) or (3.1b): µP = N X i=1 wiµi (3.1a) µP = w’µ. (3.1b)
Conversely, portfolio risk is expressed as the variance σ2
either (3.2a) or (3.2b): σP2 = N X i=1 N X j=1 wiwjσij or N X i=1 N X j=1 wiwjσiσjρij or N X i=1 wi2σi2+ N X i=1 N X j=1 j6=i wiwjσij (3.2a) σP2 = w’Σw. (3.2b) Efficient Frontier
As of the approach to the strategic asset allocation, consider a rational investor who acts in a single period investment horizon with the aim of maximizing expected utility, i.e. behaving myopic. For each level of expected return an investor would choose – in the feasible set – the portfolio with the minimum variance. The portfolios corresponding to this description can be called mean-variance efficient portfolios. Within the risk-return space, the set of mean-variance efficient portfolios are identified as the efficient frontier. Essentially, the efficient frontier provides the portfolios with the best trade-off between expected return and risk, for each level of expected return or for each level of risk. The portfolios below the efficient frontier are called either dominated or inefficient portfolios – those above the frontier are not among the feasible portfolios. The portfolio with the smallest possible variance, on the efficient frontier, is often referred as the global minimum-variance portfolio (GMVP).
The mean-variance efficient frontier are derived by the application of an algorithm formulated by Markowitz to address the so-called Mean-Variance Optimization prob-lem.
In general terms, an optimization problem/algorithm has three basic components: • An objective function, that is, a mathematical expression of what we want to
optimize (i.e. minimize or maximize)
• A set of decision variables (initially unknown, by definition) on which the value of the mathematical expression to be optimized depends on
• A set of restriction, by the form of equality and/or inequality constraints, that are to be applied to some or all of the set of decision variables.
The Mean-Variance Optimization (MVO) seeks to establish what weight to assign the asset classes in order minimize portfolio risk (standard deviation or variance) for a targeted expected portfolio return (µ∗
P), while ensuring the sum of the weights is
equal to 1 (i.e. 100% investment) and that each weight is non-negative. In algebraic terms, the Mean-Variance Optimization can be expressed as:
min w N X i=1 N X j=1 wiwjσij subject to N X i=1 wiµi= µ∗P N X i=1 wi= 1 wi≥ 0 or min w w’Σw subject to w’µ = µ∗P w’e = 1 [w] ≥ 0. (3.3)
This formulation of the Mean-Variance Optimization has: the equality constraint corresponding to the total portfolio weights must equal 1 (the budget constraint), the inequality constraint corresponding to that short selling of any asset class is not permitted (the long only or non-negativity constraint).
3.4.2 The Assumptions of Mean-Variance Optimization
To build strategic (policy) portfolios with the Mean-Variance Optimization as a tech-nique and criterion implies that you are aware of the underlying assumptions which it is based upon. The assumptions concerns the investors’ preferences (i.e. the decision-making process) and the behaviour of the series of asset class returns. More specifi-cally, the Mean-Variance Optimization assumes that:
• The returns of the asset classes are normally distributed (Gaussian distribution), i.e., that they conform to the classic "bell-curve". More specifically, that they follow a multivariate normal distribution
• Investors present a quadratic utility function.
The first hypothesis concerns the myopic, single-period nature of the model. To il-lustrate the importance of this element the words of Mossin (1968) gives a accurate interpretation: "By a single-period model is meant a theory of the following structure: the investor makes his portfolio decision at the beginning of a period and then waits until the end of the period when the rate of return on his portfolio materializes. He cannot make any intermediate changes in the composition of his portfolio. The in-vestor makes his decision with the objective of maximizing expected utility of wealth at the end of the period (final wealth).” By having this framework you characterize the return environment as a stationary asset class return distribution. This implies constant relative risk aversion, no intermediate flows on the part of the investor (i.e. portfolio return can be considered path-independent), and the absence of transactions cost and serial auto-correlation.
The assumption of normal distribution of asset class returns makes it possible for the extensive description of the return behaviour to be digested into the estimated first two statistical moments, i.e., expected return and variance. It allows for the easy aggregation of risks across assets and over time.
The third hypothesis of the model considers the "rule" that investors assign a value to their level of satisfaction that depends on the possible choices that different portfolios offers. The rule corresponds to quadratic utility function, as it allows individual investors’ expected utility to depend exclusively on mean and variance.
3.5
Conditional Value-at-Risk
When making investment decision, an investor has to balance between risk and re-turns. Markowitz (1952) established a framework for investment decision where the investor maximizes the expected return of the portfolio and minimizes the risk, mea-sured by the variance of the portfolio. To use portfolio variance as the risk measure has its limitations. Variance is a measure of the volatility of returns and is a sym-metrical measure that does not take into consideration the direction of the movement of the volatility. An asset experiencing better than expected return are considered as risky as an asset suffering from lower than expected return. Other approaches are available to measure the portfolio risk, the most traditional being Value-at-Risk (VaR). Some of the most agreed on advantages for the use of VaR as a risk measure is:
• It is recognized by practitioners,
• Many academic studies have been done on the subject,
• It measures the downside risk (contrary to a symmetrical measure), • It is easy to understand and implement.
In short, VaR answers the question: what is the maximum loss with a specified confidence level? In this study, however, we will be using Conditional Value-at-Risk (CVaR) as risk measure. CVaR is also known as mean shortfall, mean excess loss, or tail VaR. Although VaR is a very popular measure of risk, it has some undesirable mathematical characteristics, and it assumes joint normal (or log-normal) distribution of the underlying market parameters (Uryasev, 2000). CVaR on the other hand is a more consistent measure mainly since it has sub-additive and convex properties. Also, since CVaR always is greater or equal to VaR, the minimization of CVaR also leads to near optimal solutions in VaR terms. Moreover, these two measures are equivalent when the return-loss distribution is normal (Rockafellar and Uryasev, 2000). Another advantage for the use of CVaR is that it can be optimized using linear programming (LP) and nonsmooth optimization algorithms, which allow handling portfolios with very large numbers of instruments and scenarios. A description of the implementation and in-depth approach for minimization of CVaR and optimization problems with CVaR constraints can be found in Uryasev (2000) review paper.
4
Results
In this section we will presents the results from the empirical study and the quantita-tive approach, which will later be used to answer our research questions.
4.1
Studied Pension Funds
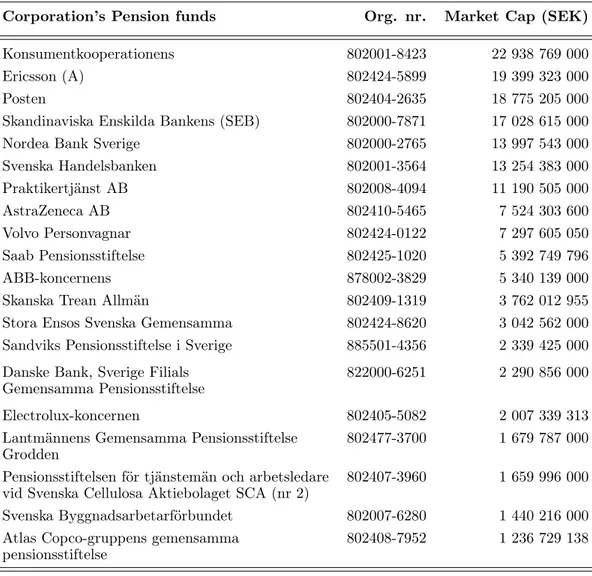
From the list obtained from Länsstyrelsen, the following pension funds were chosen to be analyzed further. These were chosen by market capitalization (20 largest pension funds).
Corporation’s Pension funds Org. nr. Market Cap (SEK)
Konsumentkooperationens 802001-8423 22 938 769 000 Ericsson (A) 802424-5899 19 399 323 000
Posten 802404-2635 18 775 205 000
Skandinaviska Enskilda Bankens (SEB) 802000-7871 17 028 615 000 Nordea Bank Sverige 802000-2765 13 997 543 000 Svenska Handelsbanken 802001-3564 13 254 383 000 Praktikertjänst AB 802008-4094 11 190 505 000 AstraZeneca AB 802410-5465 7 524 303 600 Volvo Personvagnar 802424-0122 7 297 605 050 Saab Pensionsstiftelse 802425-1020 5 392 749 796 ABB-koncernens 878002-3829 5 340 139 000 Skanska Trean Allmän 802409-1319 3 762 012 955 Stora Ensos Svenska Gemensamma 802424-8620 3 042 562 000 Sandviks Pensionsstiftelse i Sverige 885501-4356 2 339 425 000 Danske Bank, Sverige Filials 822000-6251 2 290 856 000 Gemensamma Pensionsstiftelse
Electrolux-koncernen 802405-5082 2 007 339 313 Lantmännens Gemensamma Pensionsstiftelse 802477-3700 1 679 787 000 Grodden
Pensionsstiftelsen för tjänstemän och arbetsledare 802407-3960 1 659 996 000 vid Svenska Cellulosa Aktiebolaget SCA (nr 2)
Svenska Byggnadsarbetarförbundet 802007-6280 1 440 216 000 Atlas Copco-gruppens gemensamma 802408-7952 1 236 729 138 pensionsstiftelse
Table 4.1: 20 largest pension funds based on market capitalization
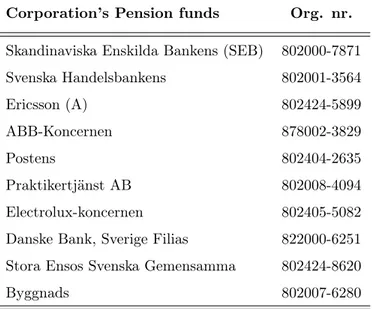
sample were included in this study and the other half were excluded due to limited information in the annual reports. The pension funds included in the analysis of this study can be studied in the table below.
Corporation’s Pension funds Org. nr.
Skandinaviska Enskilda Bankens (SEB) 802000-7871 Svenska Handelsbankens 802001-3564 Ericsson (A) 802424-5899 ABB-Koncernen 878002-3829 Postens 802404-2635 Praktikertjänst AB 802008-4094 Electrolux-koncernen 802405-5082 Danske Bank, Sverige Filias 822000-6251 Stora Ensos Svenska Gemensamma 802424-8620
Byggnads 802007-6280
Table 4.2: Pension funds included in the analysis
4.2
Pension Fund’s Asset Allocation
In this section, we present general descriptive statistics concerning pension funds’ allocations from the data. In Table 4.3 the average weighting for each asset class is presented. Fixed income and equity are the primary assets, accounting a total of 89.32% of the total portfolio. Both asset classes constitutes approximately the same proportion of the portfolio and account for 46.65% and 42.67% respectively. The remainder of the portfolio is allocated towards alternative investments (approximately 11%) and comprises mainly of hedge funds (5.87%) and real estate (3.28%).
Fixed Alternative Hedge Real
(% of total assets) Equity Income Investments funds Estate Other
Mean 42.67 46.65 10.97 5.87 3.28 1.13
St. Deviation 2.94 3.62 5.00 1.61 1.99 0.84 Min / Max 36.79/48.0 41.88/54.0 3.28/19.0 2.91/8.00 0.00/6.00 0.13/2.00
Table 4.3: Average portfolio allocation (2005-2015).
Table 4.4 gives a breakdown of pension funds’ average allocation year by year. Equity allocation does not exhibit a clear trend over the years and stays overall close to its mean at 42.24% throughout the period. From 2005 to 2008 allocation to fixed
income has a steady rise from 43.27% to 54.37%. After this period the allocation exhibits a decline and decreases 2008-2015 to 43.80%. Allocation towards alternative investments exhibit a clear increase from 3.28% to 18.57% throughout the period. In conjunction with this increase, also hedge funds’ and real estate assets exhibits an overall increase in allocation. From 2005 to 2015, allocation to hedge funds exhibits an increased from 2.91% to 7.68% and real estate an increase from 0% to 5.40%.
(average % Fixed Alternative Hedge Real
of total assets) Equity Income Investments funds Estate Other
Full sample 2005 47.45 48.07 3.28 2.91 0.00 1.92 2006 47.70 46.74 4.12 3.27 0.55 2.26 2007 44.12 49.73 5.33 4.18 1.48 1.88 2008 37.63 54.37 9.04 6.17 2.50 0.77 2009 42.75 48.19 8.37 5.92 1.94 2.36 2010 43.67 46.28 12.23 6.32 3.69 0.27 2011 36.79 42.55 14.73 6.41 5.16 0.39 2012 40.56 48.42 13.32 6.59 4.19 0.36 2013 43.96 43.17 15.50 7.23 5.53 0.47 2014 43.53 41.88 16.14 7.85 5.67 1.68 2015 41.22 43.80 18.57 7.68 5.40 0.13
Table 4.4: Breakdown of pension funds allocation by year.
If we break down pension funds’ average allocation further by looking at domestic and foreign distribution we can see in Table 4.5, that in terms of equity, pension funds allocate about equal proportions in domestic as in foreign. Both accounting for approximately 22%. In fixed income however, we observe that allocations are clearly skewed towards domestic fixed income securities, with an average of 43.5% of total assets as opposed to foreign with an average 8.57%.
average % Standard
of total assets) Mean Deviation Min Max Domestic Equity 21.76 2.75 17.91 28.0 Foreign Equity 22.19 2.08 18.17 26.0 Domestic Fixed Income 43.5 5.29 35.77 54.0 Foreign Fixed Income 8.57 2.02 4.90 12.0 Hedge Funds 5.87 1.61 2.91 8.00 Real Estate 3.28 1.99 0.00 6.00 Other 1.13 0.84 0.13 2.00