System dynamics analysis of energy usage: Case studies in automotive
manufacturing
Tigist F. Adane 1, Mariam Nafisi 1, Farazee M. A. Asif1, Daniel T. Semere1, Mihai Nicolescu1 1
Royal Institute of Technology, Department of Production Engineering, Division of Machine and Process Technology, Stockholm, Sweden
tigist@kth.se
ABSTRACT
Our life is strongly linked with the usage of natural resources. Energy is a necessity in everyday life and is often generated using non-renewable natural resources which are finite. Energy consumption in manufacturing industry is increasing and the way it is consumed is not sustainable. There is great concern about minimizing consumption of energy in manufacturing industry to sustain the natural carrying capacity of the ecosystem. This is one of the challenges in today’s industrial world.
In this paper two case studies have been carried out in crankshaft machining and cylinder head casting processes. The outcome of this research enables the company to identify potential avenues to optimize energy usage and offers a decision support tool.
Keywords: System dynamics, sustainable manufacturing, energy efficient manufacturing, energy consumption, crank shaft, cylinder head
1. INTRODUCTION
Our life is strongly linked with the usage of natural resources. The growth of manufacturing industry is boosting the extraction and use of natural resources in order to generate the energy that is needed. Energy is of great importance for societies since it is necessary for development and economic growth. However, the vital resources of our planet are limited.
Consequently, there is great concern about minimizing consumption of energy in different parts of societies and sustaining the natural carrying capacity of the ecosystem as well. This is one of the important challenges in today’s industrial world.
Due to growing public awareness about environmental and sustainability matters, industries are increasingly under pressure to focus on sustainability. According to Brundtland report (1987) sustainability is “development that meets the needs of the present without compromising the ability of future generations to meet their own needs” [1].
As defined by the US Department of Commerce sustainable manufacturing is “the creation of manufactured products that use processes that minimize negative environmental impacts, conserve energy and natural resources, are safe for employees, communities, and consumers and are economically sound” [2]. Hence, sustainability is a multidimensional concept and includes environmental, financial and social aspects.
In manufacturing industry, energy consumption and losses, material waste and polluting emissions are the most prominent concerns which are also linked to each other. For instance, emissions of CO2 and other greenhouse gases are closely associated with energy. To control emissions it is crucial to find solutions which are efficient especially in energy production and consumption.
Energy consumed by industrial sector is also a concern since it constitutes a large part of total energy consumption in any country. According to European Union Statistics in 2007 in Europe, 27.9% of energy consumption by sector was used by industry, out of which 12.8% was consumed by Sweden’s Industry. According to same statistics, in 2007 in Sweden 38% of energy consumption by sector was used by industrial sector [3].
To see the possibility to minimize energy losses in manufacturing industry, in this research two case studies in two different manufacturing plants have been conducted. The focus is on processes that have the highest energy consumption in the production system. System dynamics modeling and simulation technique have been used to model selected processes to understand their behavior that is linked with energy consumption and emission. In case two waste of material and cutting are also taken into consideration in modeling.
The ultimate objective is to identify potential areas in the processes where energy can be saved and provide decision support tool to optimize energy consumption.
2. PREVIOUS RESEARCH
Many companies use simulation as an aid in their decision-making process. According to a classic definition of simulation, “simulation involves designing a model of a system and carrying out experiments on it as it progresses through time. It is possible to see in a model how a real-world activity will perform under different conditions and test various hypotheses at a fraction of the cost of performing the actual activity” [4]. A crucial point in this regard for companies is to decide which simulation approach fits their system best.
Simulation approaches are divided to two basic categories: discrete event and continuous state [5]. Özgün and Barlas (2009) point out that discrete event simulation (DES) is suitable for problems in which variables change in discrete times and by discrete steps. On the other hand, continuous simulation is suitable for systems in which the variables can change continuously[6]. System dynamics (SD) is an approach suitable for continuous type of simulation.
Kibira et al. (2009) state that typically DES is done to address a particular set of problems, and it does some “what if” analyses. It focuses on streamlining and validating processes, reducing costs, and meeting schedules; not the identification and evaluation of environmentally friendly alternatives [7]. Therefore, it seldom addresses sustainability issues in manufacturing.
Unlike DES, SD is often used for strategic and policy related applications. This is because of the high abstraction level of the models and the longer simulation time horizon used to reveal the dynamic behaviour [8, 9, 10].
In their research, Kibira et al. (2009) proposed system dynamics methodology for modeling and analysis of sustainable manufacturing. Their proposed framework organizes factors influencing sustainable manufacturing into four interacting complex domains: manufacturing, environmental, financial and social. They aim at making the framework into a platform that can be used by different industries.
Commonality between the mentioned researches is that these models are developed at system level. That is to say that they take a holistic view into account and consider different domains in manufacturing.
Despite evidence that SD is suitable for industrial modelling in the literature survey done, there were not many applications of SD in manufacturing at process level. This motivated the current research work and directed it towards modelling of casting and machining operations as a system at process level.
3. SYSTEM DYNAMICS MODELLING
3.1. System dynamics
System dynamics (SD) is a powerful methodology and computer simulation modeling technique for framing, understanding, and discussing complex issues and problems. It was originally developed in the mid-1950s by Professor Jay W. Forrester at the Massachusetts Institute of Technology to help corporate managers improve their understanding of industrial processes. SD is a method for studying the world around us. It is used to study objects as a whole to understand how they interact with each other as part of a system, instead of studying each object separately. In complex systems like manufacturing, objects often create feedback loops, where a change in one variable affects other variables dynamically, which feedbacks to the
original object, and so on. The interplays among objects determine the different states the system can assume in the course of time, which is known as the dynamic behaviour of the system (Tesfemariam and Lindberg, 2005) [11].
A SD model is useful in illustrating how the real system behaves and to check what will happen if some parameter in the model is changed over a period of time.
In SD varying the value of a parameter does not mean considering only one factor at a time as is the case in one-factor-at-a-time method (or OFAT), neither it means changing one parameter and freezing others as is the case in design of experiments (DoE). Since a change in one, results in change in others as parameters are already linked and interrelated.
Some commercial software is available to study the interaction of the process. The most widely used (SD modelling and simulation software) are STELLA/iThink, Vensim and Powersim. The model presented in this paper has been created using STELLA/iThink.
There are numerous and varied applications of system dynamics. It can be applied to any dynamics system with no restriction in time and space. SD has also been applied to a wide range of industries and policy making issues like environmental and energy management.
3.2. Terminology of SD modelling
Following are the four building blocks used in modelling process along with their definition. They can be presented in a stock and flow diagram as seen in Figure 1
Figure 1: Stock and flow diagram Building
Block
Definition of the term
Stock something that accumulates
Flow activity that changes magnitude of stock by adding to it (inflow) or subtracting from it (outflow)
Converter stores equation or constant; does not accumulate
3.3. SD simulation model
System Dynamics models involve a set of coupled, non-linear differential equations of the form
) ) Where
) - is a vector of levels (stocks or state variables) - is a set of parameters
- is a nonlinear vector valued function
The SD simulation of the system can be easily accomplished by dividing the simulation time discretely into dt with steeping of an interval dt. Sequentially, not to bring visible effect on the dynamic behaviour pattern shown on the model, the computational interval dt should be as small as possible. The state variable x(t) at each step is calculated from the earlier value x(t-dt) and from its net rate of change x’(t); that is x(t)= x(t-dt) + dt * x’(t-dt) [9, 12].
4. CASE STUDIES
Two cases have been carried out in two automotive factories in Sweden. The first one is casting of a cylinder head and the second is machining of a crankshaft. The objective of these case studies is to model these processes, to understand energy consumption and to identify potential ways that improve energy efficiency of the process. However, this research does not consider all manufacturing steps of cylinder head and crankshaft. Instead it considers the most energy intensive steps in casting a cylinder head and most frequently used machining operations in crankshaft manufacturing.
4.1. Case study one
4.1.1. Casting of cylinder head
The overview of the ‘sand mould casting’ process for cylinder head production studied in this case is shown below Figure 2:
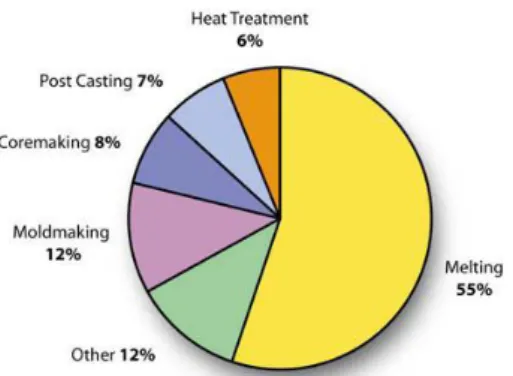
Casting is one of the most energy intensive processes and it is also an area where energy waste is quite high. Melting, holding and pouring are the most prominent energy intensive steps in cylinder head casting among these melting and pouring accounts about 70% of the total
energy consumption in casting process, in which melting process accounting for about 55% of the energy as shown below Figure 3 [13, 14].
Figure 3: Process energy in metal casting
The energy efficiency of any foundry largely drives on the efficiency of the melting process. Although the energy consumption in the melting process has been a significant concern in foundry operations, the industry continues to use melting technologies with low energy efficiencies [13].
4.1.2. Identified critical steps and influential parameter
The parameters that influence the energy consumption in melting, holding and pouring processes have been identified. These parameters are:
furnace opening time factor of radiation black body radiation
area of opening in the furnace enclosure emissivity of material
amount of charge material in the furnace wall thickness and door width
operating temperature average surface temperature area of hearth, ceiling, and wall melting time
holding time of ladle
conduction heat transfer through refractory lining (refractory thickness, area of ladle, temperature of hot and cold surfaces) emissivity of radiating body and thermal conductivity of material,
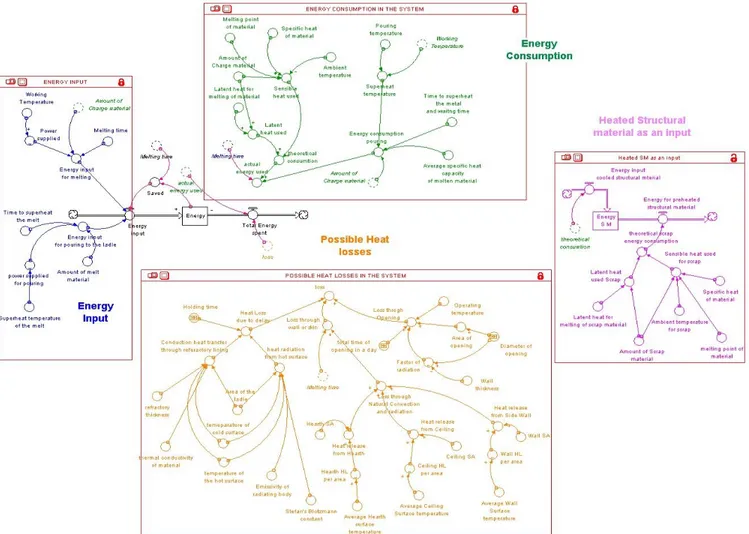
4.1.3. Energy input, consumption and losses in melting, holding and pouring
Every process consists of basic elements of input and output. The inputs to the process (melting furnace) are: energy - derives its heat from natural gas,
fuel, electricity, and coke air
fluxes & alloy elements base metals
Ideally, all heat added to the furnaces is used to heat up the load or stock [14, 15]. In practice, however, during melting a lot of heat is lost via conduction, convection and radiation as shown in Figure 4. The outputs from the system are molten metal, dross or slag, fuel gas. In modelling, the total heat required in the process is estimated as the sum of the energy for melting, pouring and holding.
Figure 4: Process input, output and losses
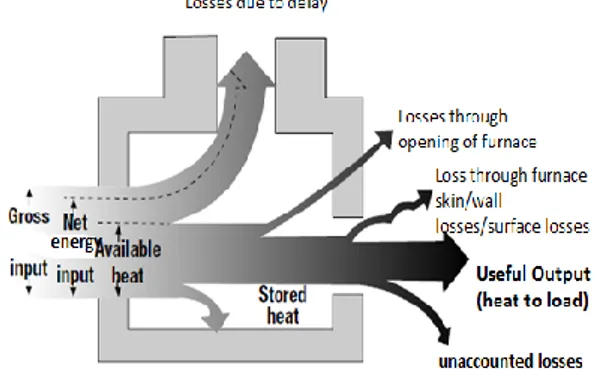
4.1.4. Possible heat losses
The Sankey diagram below shows the possible ways of energy losses in the process. From the total energy input i.e. gross input only small percentage of heat is used to melt the material i.e. useful output (called heat to load).
Figure 5: Sankey diagram- possible heat losses in industrial heating processes
4.1.5. Heated structural material as input
When the cast solidifies, the mould is knocked out before cooling. Then the feeder and gating system (inlet) of the casting is trimmed by some mechanism. These hot scrap materials are reused as an input in the sand casting process, and hence the scrap for the next cycle can be considered as preheated or heated scrap.
This concept is included in the model as ‘’heated scrap material as an input’’ and possibly to recover energy in the system.
The parameters include:
latent heat for melting of scrap material amount of scrap material
ambient temperature/temperature of preheated scrap
melting point of material specific heat of material time
The key parameters that influence these processes and their relationships for energy consumption and dissipation have been mentioned and explained earlier in section 4.1.2. Using SD and modelling, the parameter relationships and interactions in the system are modelled.
The model that has been developed comprises energy input, energy consumption, possible heat losses and heated structural material as an input. It is shown in Figure 9 at the end of this paper.
4.2. Case study two
In this case study machining process for crankshaft production is investigated in a different automotive manufacturer.
4.2.1. Machining process for crankshaft production
In terms of annual money spent, machining is the most important of manufacturing processes due to the high volume of machining that is done in industry [16]. As a result, sustainable machining can bring economic and environmental benefits. In the case of the crankshaft, there are different machining processes involved. Since turning, milling and drilling constituted a relatively large percentage of the operations (and therefore a large part of energy consumption) they were chosen for modelling.
4.2.2. Process input, output and losses
In the case of crankshaft machining, the system can be represented by the following diagram and parameters.
Figure 6: Schematic representation of system input and output
The inputs to the process are: work piece material
cutting fluids that are used in machining energy needed to perform the machining.
The output of the system is: the final work piece
the chip that is produced - a part of it is recycled and the rest is a waste
the fluids that are wasted – a part of the fluid which was used is recycled but part of it cannot be recycled and there is some evaporation as well
the energy which was wasted - it can also be called non-value adding energy
4.2.3. Possible energy losses
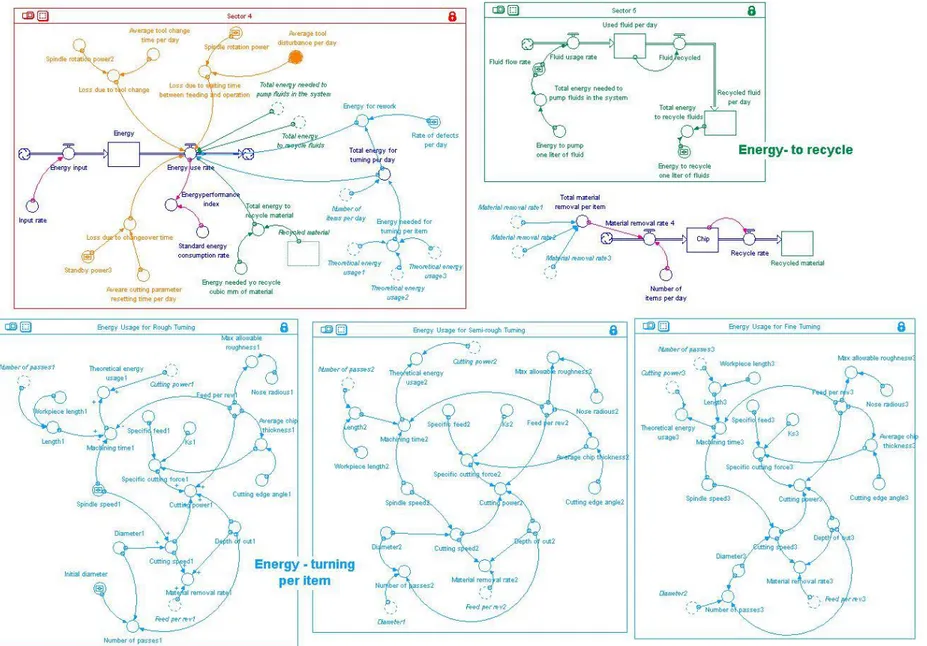
The models that have been developed contain sections dealing with chip generation, cutting fluid usage and recycling and total energy consumption. In these models total energy comprises of:
energy consumed in machining operation energy consumed to recycle fluids material
energy consumed for rework and
energy wasted due to non-value adding activities
As a matter of fact, in reality only the non-value adding activities can be eliminated, or minimised, since to perform machining it is necessary to have other types of energy consumption. It is necessary to identify parameters that have a role on energy consumption to form the model
4.2.4. Identified critical steps and influential parameters
Non-value adding activities in a machining process are those activities that are carried out but actually do not contribute to the cutting process directly. Machine downtime, traverse time, tool disturbances, parameter resetting time, tool change time are relevant non-value adding parameters. These parameters contribute to the so called energy loss.
The following parameters determine how much energy is going to be consumed in the machining process:
work piece length
Spindle speed feed per revolution specific cutting force work piece diameter depth of cut
In this paper, these parameters are referred to as process level parameters.
Pumping fluids to the process and recycling fluids and material from the process also consume energy and therefore are taken into account. Some of the relevant parameters are chip recycling rate, fluid flow rate, energy to recycle one liter of fluid and energy to pump one liter of fluid. They are referred to as system level [17].
It is assumed that the energy supplied to the system is unlimited, in the sense that it is supplied at a constant input rate and is never less than the total energy consumption of the system.
Parameters that are influential in energy consumption are identified. A scenario analysis verifies their selection. The overall model that is developed using SD captures these parameters and their relationships. The complete model is depicted in Figure 10 at the end of this paper.
5. RESULTS
Results are obtained after by running the simulation with the given data.
Case one - cylinder head
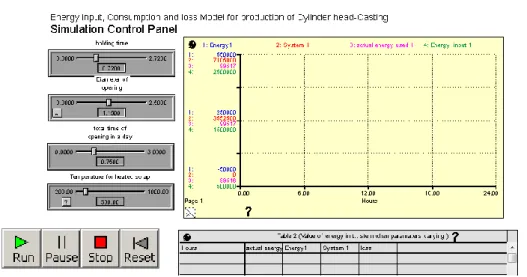
Parameters that have the highest impact in energy consumption have been identified. Among them holding time (delay), area of opening, time of opening and scrap temperature account for highest energy consumption. In the simulation control panel shown below in Figure 7, there is a slider that makes it easy to conduct simulation experiment. This is done by varying the value of parameters which impact energy consumption in the system most. Results are displayed in the graph and the exact value is shown in the table.
1. Holding time: Reducing the holding time of the melt in the ladle by 25% from the given measured value, will reduce the energy loss in the system by 40% from the average loss. Similarly, if the time delay is decreased by 40%, the energy loss will be reduced by 80%. This is one potential area for reducing energy losses in the system.
2. Area and time of opening: The simulation result shows, increasing or decreasing the opening time of the furnace by 30% will increase or decrease the energy loss by 30% from the average opening time energy loss. For example through melting, if the furnace opening time is 0.75hr, minimizing it by 33% (0.65hr) reduces the energy loss by 33%. If the area of opening of the furnace is either decreased or increased by 21.7% in diameter, the energy loss due to opening is decreased by 38.7% and increased by 48.2% from the normal opening area of energy loss respectively.
3. Scrap temperature: the higher scrap temperature, the greater possibility to reduce energy consumption in the process.
Holding time (time delay) and temperature of the scrap material (structure of the mould after casted part is separated) has the highest impact on improving energy consumption. Almost 1/3 of the energy losses in the melting process are caused by the delay. For example, it is possible to save about 1321200 KJ of energy if the delay is reduced (current average delay is about 40 minutes) by 10 minutes.
In cylinder head production, 60% of the volume of a mould accounts for the cylinder head and remaining 40 % is structure of the mould (gates, runners, risers, etc.). Currently the mould is cooled down to the ambient temperature and mould structure is separated from the cylinder head and then recharged (after primary treatment and pre-heating) in the furnace for re-melting. If the mould structure is separated from the cylinder head at higher temperature (not waiting until it reaches to ambient temperature) substantial amount of energy could be saved. For instance, simulation result suggest that with the current capacity of the melting process for each 10 °C of recovered heat can save up to 460800KJ energy.
Though cost is not considered as a modeling parameter, it can be easily estimated that an increase in energy consumption will increase the cost and if energy is reduced cost will also be reduced.
Case two - crankshaft
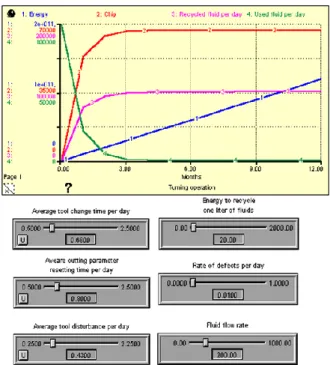
Obtained diagrams are indicators of system’s behaviour. As shown in Figure 8, stocks are represented by graphs which clearly exhibit the trend that stocks take over simulation length. Energy consumption, fluid consumption and chip generation are the stocks which are investigated.
Figure 8: Simulation run and result - machining
Through modelling and simulation results are studied and show the dynamic behaviour of the model. Energy consumption, fluid consumption and chip generation are taken into account.
During simulation, some scenarios are developed to check the result of changing parameters on energy consumption. As a result it becomes clear that not all factors considered in modeling have an influence on energy consumption. Process level parameters turn out not to be influential while system level parameters appear to be quite influential.
To improve these processes energy-wise, one can suggest non value adding activities to be as small as possible. In this case, average tool change time, average cutting parameters resetting time and average tool disturbance time can be minimized. Speaking of the system level, turning to new methods to treat chip and fluid, using new technologies and cutting tools to allow minimum quantity lubrication and improving item quality can significantly reduce energy consumption.
6. CONCLUSION
In general, using system dynamics approach, the interaction between parameters in the overall process for each case is analyzed in regard to energy consumption. By varying (changing) values of the parameters that have the highest impact in the process, the breakthrough opportunities that might dramatically reduce energy consumption during melting, holding and turning are explored, and potential energy-saving areas are also identified.
The result from this research work are intended to aid companies in systematically evaluating current working system and to designate potential avenues to optimize
energy usage in the production and hence become sustainable manufacturing.
7. FUTURE WORK
Each process in manufacturing has its own contribution to the end product as well as to the energy consumption. Therefore, to complete this research, future work will focus on analysis and modelling of energy consumption for all processing steps from raw material to the end product including the life cycle of the product.
Additionally, rather than analysing only the influential ones, all parameters that influence energy consumption in each processing step need to be analysed.
Needless to say that future work should be more holistic and extensive. It should also include cost factor since it plays an important role in decision making which can limit alternatives.
8. ACKNOWLEDGMENT
The case studies presented in this article is part of the project called FFI - Miljövänliga och energieffektiva fabriker. The authors would like to express their gratitude to VINNOVA, Sweden for granting to make this research work possible.
9. REFERENCES
[1] World Commission on Environment and Development (1987). Our Common Future. Oxford University Press, Oxford.
[2] International trade Administration (2010). How Does Commerce Define Sustainable Manufacturing?
[3] European Union (2010). EU energy and transport in figures: Statistical Pocketbook. Publications Office of the European Union, Luxembourg. [4] Solutions: Simulation Software Overview (n.d.).
Retrieved 2012-09-02, from www.extendsim.com/sols_simoverview.html [5] Sanders, W.H. (2005). Simulation Basics.
University of Illinois, Urbana, USA.
[6] Özgün, O. and Y. Barlas (2009). Discrete vs. Continuous Simulation: When Does It Matter? In:
Proceedings of the 27th International Conference of the System Dynamics Society, Albuquerque,
USA.
[7] Kibira D, S, Jain and C. R. McLean (2009). A System Dynamics Modeling Framework for Sustainable Manufacturing. In: Proceedings of the
27th International Conference of the System,
Albuquerque, USA.
[8] Baines, T.S. and D.K Harrison (1999). An opportunity for system dynamics in manufacturing system modeling. Production planning and control:
The management of operation, 10:6, 542-552.
[9] Sterman, J.D. (2000). Business Dynamics: System
Thinking and Modeling for a Complex World.
Irwin/McGraw-Hill, Boston.
[10] Lin, C., T.S. Baines, J. O’Kane and D. Link (1998). A generic methodology that aids the application of system dynamics to manufacturing system modeling. International Conference on SIMULATION, IEE. Staffordshire University, UK. [11] Tesfamariam D. And B. Lindberg (2005).
Aggregate analysis of manufacturing systems using system dynamics and ANP. Computers &
Industrial Engineering, 49, 98–117.
[12] Maani K.M. and R.Y. Cavana (2007). System
Thinking, System Dynamics: Managing Changes and Complexity. Pearson Education, 2nd edt.
[13] Naranjo R.D., J. Y. Kwon, R. Majumdar and W.T. Choate (2005). Advanced Melting Technology: Energy Saving Concepts and Opportunities for the Metal Casting Industry. BSC, Incorporated.
[14] Adane, T. F. (2012). Mapping Energy Usage in Casting Process for Cylinder Head, Using System Dynamics Modeling and Simulation. Master’s Thesis, KTH Royal Institute of Technology, Stockholm, Sweden
[15] Fredriksson, H. and U. Åkerlind (2006). Material
Processing during Casting. John Wiley & Sons,
Ltd.
[16] Dezsö, G., Szigeti, F. and G. Varga (2011). Case Study on Mechanical Interaction between the Twist Drill and the Workpiece. International Journal of
Engineering, 3, 429.
[17] Nafisi, M. (2012). Applying system dynamics modeling to a manufacturing process with regards to environmental friendliness and energy efficiency. Master’s Thesis, KTH Royal Institute of Technology, Stockholm, Sweden