J
Ö N K Ö P I N GI
N T E R N A T I O N A LB
U S I N E S SS
C H O O L JÖNKÖPING UNIVERSITYD o n o r B e h a v i o u r :
A s t u d y o f S w e d i s h A i d
Bachelor thesis: ECONOMICS
Author: CAMILLA BENGTSSON
TERESE OLSSON
Tutors: ULF JAKOBSSON
Kandidatuppsats inom Nationalekonomi
Titel: Givarbeteende: En studie av Svenskt bistånd Författare: Camilla Bengtsson och Terese Olsson
Handledare: Professor Ulf Jakobsson och Ph.D. Candidate Daniel Wiberg Datum: Januari 2007
Ämnesord: Sverige, bistånd, biståndsfördelning, givarbeteende
Sammanfattning
Denna studie analyserar vilka faktorer som har drivit Svenskt bistånd mellan 1975 och 2003. Resultaten jämförs sedan med officiell policy. Det allmänna målet med Svensk bistånd enligt officiell policy är att ”hjälpa till att höja levnadsstandarden för de fattiga”, men det finns fler faktorer än inkomstnivå som påverkar allokeringen. Allokering av svenskt bistånd påverkas av bestämda "länderkriteria". Detaljerna och biståndets mål har förändrats över tiden även om kärnan har varit densamma. Enligt officiell policy så ska svenskt bistånd användas för att ta ansvar som sträcker sig över gränserna, för att bidra till en större gemensam marknad samt en fredlig utveckling. Det har ansetts vara viktigt att mottagarnas behov kan mötas av Sveriges kapacitet och att biståndet är sammansatt utifrån mottagarnas situation. Mottagarnas absorptionskapacitet är således det ett viktigt kriterium. Sammanfattningsvis ska svenskt bistånd främja demokrati, kämpa mot korruption och bidra till att samhällen blir mer jämställda.
I denna studie finner vi inget signifikant samband mellan den officiella policyn och faktisk allokering. En ”Generalized Least Square Random Effects” regression påvisar blott två signifikanta variabler; mottagarnas handelsvidd (öppenhet) och deras före detta koloniala (Brittiska) status.
Istället för att belöna öppna ekonomier har svensk bistånd allokerats till mer stängda ekonomier som tenderar att vara mer korrupta. Trots att majoriteten av mottagarländerna är före detta kolonier är de Brittiska kolonierna favoriserade. Denna allokering tros vara ett resultat av biståndets historiska utveckling och praktiska omständigheter, så som språk etc…
Bachelor’s Thesis in Economics
Title: Donor Behaviour: A study of Swedish aid Authors: Camilla Bengtsson and Terese Olsson
Tutor: Professor Ulf Jakobsson and Ph.D. Candidate Daniel Wiberg Date: January 2007
Subject Terms: Sweden, aid, aid allocation, donor behaviour
Abstract
This study analyses which factors has driven the allocation of Swedish aid between 1975 and 2003. The results are then compared to the official policy. The general goal of Swedish aid is to “help to raise the living standard for the poor”, but there are more factors than income status that affect allocation.
Allocation of Swedish aid is affected by a set of criteria for the choice of recipient. The details and the goals of aid have changed over time even if the core has remained the same. According to the official policy, Swedish aid should be used to take responsibility across borders, to contribute to a greater common market and a peaceful development. It has been considered important that the recipients’ needs can be matched by Sweden’s capacity and that aid is developed from the recipients’ situation. The recipients’ absorption capacity is thus an important criterion. Summarized, Swedish aid should be used to promote democracy, fight corruption and contribute to more equal societies.
In this study we do not find any significant relation between the official policy and actual allocation. A Generalized Least Square regression with Random Effects points out only two significant variables, the recipients’ size of trade (openness) and their former (British) colonial status.
Instead of rewarding open economies, Swedish aid has been allocated to more closed economies which tend to be more corrupt. Although the majority of the recipient countries are former colonies, we find that former British colonies are favoured. This allocation is believed to be a result of the historical development of aid and practical circumstances such as language etc...
Table of contents
1
Introduction ... 1
1.1 Outline ...2
2
Definitions and Motives for Aid ... 3
2.1 Definitions...3
2.2 Motives ...3
3
Swedish Aid Policy ... 5
3.1 The Swedish Aid Organisation ...5
3.2 Swedish Aid Policy ...6
4
Variables and expected results ... 9
4.1 Variables ...9
4.2 Expected results ...11
5
Data and Descriptive Statistics... 13
5.1 Data...13
5.2 Descriptive Statistics ...13
6
Estimation Methods and Results... 16
6.1 Method ...16
6.2 Multicollinearity ...17
6.3 Joint Hypothesis Testing ...19
6.4 Generalized Least Square Regression...20
7
Analysis ... 22
8
Conclusion ... 25
Figures Figure 1: Scheme over the Swedish aid organisation 5
Figure 2: Quartiles of recipients' income per capita 14 Tables Table 1: Variables and Definitions 10 Table 2: Descriptive statistics 13
Table 3: Quartiles of recipients' income per capita 14 Table 4: Summary over individual hypotheses testing 16
Table 5: Results from individual hypothesis tested with OLS 17 Table 6: Covariance matrix 18 Table 7: Results from joint hypothesis tested with OLS 19 Table 8: Result from joint hypothesis tested with GLS with random effects 20
Appendices
Appendix 1: Summary overview over Swedish aid assistance 2003-2004 Appendix 2: List of recipients with respective country number
1 Introduction
Aid is resource transfers from one nation to another driven by goals and motives that differ both between donors and over time. Aid is a controversial topic, constantly debated and questioned. The effectiveness of aid and its allocation have been recognized in recent years, therefore studies investigating if the stated policy coincides with actual allocation are of great importance.
Intuitively, one might expect that aid is allocated to the poorest nations in the world with the intension of fighting poverty. But since there are several ways to reduce poverty, and there are more criteria than poverty status that affects allocation, this does not seem to be true. Donors must also consider the use of aid, how the recipient can benefit from it and how the aid relates to their own agenda. In 1999 the South Asian countries received on average $ 3 per capita in total aid, while European and Central Asian countries received an average of $ 23 per capita. If donors aim at reducing poverty this allocation behaviour is rather strange since the average income in Europe and Central Asia is about five times as high as that in South Asia (Todaro and Smith, 2003). This indicates that aid has more goals than poverty reduction and hence there are more motives for the allocation of aid.
The history of Swedish aid goes back fifty years and has its roots in early missionary work, non-governmental organizations and private initiatives. In 2003 and 2004 two thirds of total aid was bilateral1 aid, while one third was multilateral2 transfers (Appendix 1). The intention is to investigate the allocation of Swedish bilateral aid between 1975 and 2003. The research question of this study is: “Does the official Swedish policy for aid coincide with actual
allocation of Swedish aid?
Previous studies on pattern of aid flows indicate distortions in donor behaviour. “Who gives foreign aid to whom and why?” by Roberto Alesina and David Dollar (1998) is a frequently cited study on several donors’ behaviour. Alesina and Dollar (1998) find that, in general, donors reward more democratic and open recipients, but still there is a large variation between different donors’ behaviour. They find that Sweden, along with the Nordic donors, respond to the “ correct economic incentives” by targeting countries with relatively more open economic policies and democratic institutions. Most donors give more aid to poorer countries, cet.par. The Nordic countries answer most to poverty when measured by income levels. Also, old colonial powers are found to allocate more aid to their former colonies. In general, smaller countries tend to be favoured and receive more aid per capita. Summarized, Nordic countries target the poorest and amongst those appear to reward good economic policies and political institutions. Alesina and Weber (2002) find that the Scandinavian countries give less to corrupt recipients.
A master thesis by Fulland and Norrman (2006), which is influenced by Alesina and Dollar (2003), investigates Sweden’s donor behaviour through the allocation of Swedish aid. They find no significant variables and conclude that there is a non-consistency in Swedish aid distribution. A study by Svensson (2000) presented in a research paper by Isopi and Mavrotas (2006) find that democracy and corruption do not affect whether or not a
1 Bilateral aid is resource transfers from one donor to its recipient(s) (Development Assistance Committee,
2006).
country receives aid from Sweden. Isopi and Mavarotas (2006) find that a large part of Swedish aid is humanitarian oriented towards the recipients’ needs. Further, the recipients’ own development also affects the amount of aid received. Similar results are confirmed by Odén and Wohlgemuth (2006). There is no general consensus between previous studies on Swedish donor behaviour and it is therefore a subject of further investigation.
1.1 Outline
The outline of the study is constructed in the following manner; chapter 2 presents the background and empirical findings which contains a review of definitions and the theory concerning the motives driving aid. This is followed by a detailed description of the Swedish aid policy; the organisation, the goals and motives behind giving assistance in chapter 3. Chapter 4 includes the chosen factors which are believed to affect the allocation of aid and their respective expected result. In chapter 5, regressions and methods together with a closer review of the dataset are presented. In chapter 6, the results regarding the relation between the different variables and aid allocation are presented. Finally, in the last section, section 8, a conclusion of the study is presented followed by the reference list and three appendices.
2
Definitions and Motives for Aid
2.1 Definitions
Before an analysis of the factors and motives behind aid can be performed, some definitions need to be explained. Aid in this study is defined as the act of transferring resources from one country to another. This study will analyse official bilateral aid from Sweden to all its recipients. Official aid is transfers made between the donors’ and the recipients’ official organs. DAC3 has standards for what accounts as Official Development Aid (ODA) and Official Aid (OA) regarding the income levels of the recipients and the form of aid. In this study, both ODA and OA are considered since all Swedish recipients are of interest when analyzing to whom Sweden allocates aid (Development Assistance Committee, 2006).
2.2 Motives
More interesting than the formal definitions of OA, ODA and so forth, is how donors determine how to allocate aid. The past has shown that different motives have influenced the choice of recipient countries. Aid can be used to build alliances, to promote exports or simply to reduce poverty and promote long run economic growth (Todaro and Smith, 2003). Bilateral aid makes it possible for donors’ to control the goals and motives of aid to a higher extent than with multilateral aid were several donors join together (Hjertholm and White, 2000-2004).
Todaro and Smith (2003) divide the motives behind aid into political and economic and Ruttan (1989) makes a similar division and argues that self-interest can be used to pursue economic or political interests. Ruttan (1989) adds a second category called ”ethical considerations” representing the moral responsibility to assist. This motive is not considered by Todaro and Smith, but supported by others such as Lumsdaile who emphasizes a “moral vision” as the most important motivation behind aid allocation (cited in Krueger, 1995).
The self-interest motive is often used to give a rationale for aid, especially concerning bilateral aid. If the donor allocates aid considering their self-interest first, the disbursements are used to promote a political or economic motive of the donor country.
The economic motive has several aspects, and the most common is the use of aid to increase the donor’s export (Ruttan, 1989). In order to export goods on more favourable terms to the developing countries, the donors’ subsidize domestic production through aid. Besides forming aid to push domestic exports it strengthens the commercial ties between donors and recipients. Further, if aid contributes to economic development in the recipient country, the donor can in the future face an increased export demand from the recipient (Ruttan, 1989). Todaro and Smith (2000) present the economic motive by considering the two-gap model which argues that developing countries face a shortage of domestic savings and/or foreign exchange and that aid should fulfil this gap to create balance.
3 DAC is a central forum for donors and a department under OECD that deals with development
coopera-tion matters (Development Assistance Commitee, 2005).
Structuralism, a theory developed from neoclassical economic theory and advocated by Gunnar Myrdal, Raúl Prebisch and Paul Rosenstein-Rodan amongst others, represents a deeper review of the connection between aid and capital scarcity. Structuralism argues that poor countries need aid to cover the lack of capital and that they are stuck in poverty cycles where the lack of capital leads to low savings, which leads to low investments, stagnated growth, deeper poverty etc. The advocators of this theory therefore claim that poor developing countries show structural, i.e. profound features, that separate them from rich developed countries and makes poor countries function differently than rich. E.g. poor countries are assumed not to have the same market systems or the same institutional framework of laws and regulations as the rich. Therefore, their markets do not react upon the same incentives used to push economic growth in rich countries and consequently they need actual capital transfers to develop. Structuralism accredits the state an altruistic role and assumes that it is the only welfare guarantee; therefore should poor countries receive official aid (Karlström 1996).
If aid is allocated considering a political motive, it will be used as a mean to put leverage on regimes, to influence the international setting or to strengthen the political commitment between donor and recipient (Todaro and Smith, 2000).
When aid is allocated following a self-interest motive the donor shape the transfers in order to gain benefits. This can be done by requiring that some form of condition(s) need to be fulfilled by the recipient in order for them to receive assistance. Generally, aid does not come in the form of pure grants; instead the transfers are either soft loan, i.e. untied loans made on consessional terms or in the form of tied aid. The tied aid restricts the recipients to spend the disbursements received only on goods from the donor or from a group of countries decided by the donor (Development Assistance Committee, 2006). Ruttan (1989) argues that economic and politic objectives may be fulfilled in the short-run, but that these results often are inconsistent with the long-run self-interest of the donor.
The Marshall Plan, i.e. the United States’ (US) aid program to Western Europe after the Second World War, is an example of aid allocated with both a political and an economic motive. From a political perspective, Europe was given assistance to build up a strong West Europe that could counterforce the communist block (Ruttan, 1989). It was also important for the US, from an economic perspective, that Europe was rebuilt. The expanding industry of the US needed the large export market that only a strong Europe could provide. Karlström (1996) argues that the success of the Marshall Plan was due to the fact that Europe, even after the war, possessed both the institutions and the human capital needed to achieve economic growth and therefore only needed capital to rebuild the economy. The motive based on moral responsibility and ethical arguments for aid is the most complicated to define because most of the arguments which it relies upon are developed from the individuals point of view (Ruttan, 1989). Ruttan (1989) presents a set of arguments concerning the connection between distributive justice and aid and also the idea that aid is a mean for rich nations to make up for bad conscious. Other studies claim that a nation never assists another based on solely philanthropy (Griffin and Enos, 1970) while Lumsdaile on the other side claims that the essential cause of aid is the humanitarian and egalitarian principles of the donor country (cited in Krueger, 1995). The latter idea has been heavily criticized by Krueger (1995) who, among others, find that aid is driven by humanitarian, political and economic motives and that the humanitarian motives more often are of less importance.
3
Swedish Aid Policy
3.1 The Swedish Aid Organisation
Swedish aid is organized as follows: The highest decision making organ is the Parliament and the propositions are presented by the Government. The policies determined in the Parliament are carried out by the Government and apply to all agencies that deal with aid. In 2003, the Parliament approved the latest comprehensive government bill, “Mutual responsibility: the Swedish policy for global development” (PGU) (Utrikesdepartementet, 2006). However the effects of this bill will not be considered in this paper since the data used reaches up to 2003. The Ministry of Foreign Affairs (MFA) deals with multilateral aid and the Swedish Institute for Development Assistance (SIDA) 4 deals with bilateral aid (OECD, 2005). The Embassies and “other” organizations deal with official aid in different forms, e.g. the Swedish Export Guarantee Board (EKN). EKN provide export credits to domestic firms that wish to engage in trade with foreign customers and insure their profits against debt default by the foreigner. EKN works as any insurance firm except that it is driven by official funds and promotes trade with foreign clients even if they are from a developing country and the risk of failed payments is higher than normally (Swedish Export Guarantee Board, 2006).
Figure 1: Scheme over the Swedish aid organisation
Parlament Sida MFA Government Others* Embassies
* = Swedish Export Credit Guarantee Board, the Swedish Institute and other organizations use official aid funds (OECD, 2005).
The organization of Swedish aid has not changed much over the years, but agencies have replaced each other and responsibilities have shifted. Before establishing such an organized structure missionaries, non-governmental organizations and popular movements engaged in foreign aid in a rather sporadic way based on private initiatives. But aid came to be more organized after the Second World War when Sweden started to assist the countries that
4 SIDA is an official agency that is a key actor in the Swedish aid organisation and recieved 60 % of total
suffered greatly from the war. These transfers were made through multilateral aid and administered by the Swedish Institute (Andersson, 1989).
In the 1950’s the Central Committee was founded after a recommendation from the United Nations to ensure that aid was administered as effectively as possible. Sixten Heppling, often referred to as the father of Swedish aid, was chairman in the Central Committee and earlier employed at the Swedish Institute. As aid gained more relevance in the Swedish society the new Committee for International Aid Assistance was established to administer both bi- and multilateral aid. It was an attempt to centralize the responsibilities but, the agency had organizational problems and was rapidly dissolved and replaced with SIDA in 1965 (Andersson, 1989).
3.2 Swedish Aid Policy
Throughout the more than 50 year long history of Swedish aid the policies and strategies have changed, but some values have remained constant. The general goal for Swedish aid is “to raise the living standards of the poor”, which has remained constant over time (Andersson, 1989:78). How this aid should be allocated has been based on different motives and a set of criteria for the choice of recipient(s).
The Central Committee performed an inquiry in 1959 to investigate the practical details, ongoing projects, and coordination of Swedish aid. The Central Committee reached three important conclusions; the importance of export credits, stated motives for aid and a set of criteria for the choice of recipients (Andersson, 1989).
During the 1950’s the connection between aid and exports was recognized by both the Swedish export industry and the official agencies. The intention was to increase both technical and financial aid with the commercial relations significance for both parts underlined (Andersson 1989).
The early motives behind aid were stated to be solidarity, passion, gender equality and greater awareness of the recipients’ needs and the growing importance of the developing world. The value of social and economic development in a democratic direction was recognized together with the relationship between aid, development and an expanding world market (Andersson, 1989).
A set of criteria for the choice of recipient country was formulated so that aid could be effective in achieving its goal:
• an economic and social long term planning that Swedish aid could be adjusted to. • the administrative resources needed to benefit from the aid in an effective way
which was called the ability to absorb. This is claimed to be the most important criteria.
• an interest of wanting assistance based on a request from their (the recipients’) part • a need that was possible to match with Sweden’s capacity
• known and developable resources and internal political stability. (Andersson, 1989).
These criteria are still relevant with the only difference being that the reduction of poverty was not underlined explicitly, which later on has become a prominent feature of Swedish
aid. Now, a new set of possible criteria is under discussion which states that recipients should have:
• a low-income status
• a national agenda with clear poverty focus
• values that are consistent with Swedish values and a clear policy working towards democratic governance and fighting corruption
• a potential value added from receiving Swedish aid. (OECD, 2005).
The first government bill concerning a comprehensive aid policy was accepted in 1962 and it set the motives that are still relevant:
• The solidarity motive – Giving aid with the goal of promoting economic development which can be derived from a sense of moral obligation and international solidarity. International solidarity recognises that responsibility reaches cross borders and that these borders get less defined with time and globalization. The solidarity motive is claimed to be the most important motive behind Swedish aid.
• The foreign policy motive - The foreign policy motive, nowadays referred to as the peace and security motive, means that aid should be used to promote increased understanding among people and contribute to a peaceful development and equality. Most aid driven by this motive is allocated through multilateral channels, such as the United Nations and the European Union.
• The economic motive - The economic motive is based in the assumption that both rich and poor countries have a common interest to develop new markets and increase trade. It is recognized that the commercial interest drives business to engage in aid and it is therefore difficult to separate between self-interests and aid since one is dependent on the other.
(Andersson, 1989)
As said above, these essential motives have remained constant over time. However, during the 1970’s more focus was put on the recipients’ needs and conditions and new goals of aid were established. The general goal was to be reached through the means of direct attacks at poverty and its reasons. To accomplish this, four sub goals were formulated; resource development, political and social equalization, economic and political independency and a democratic development of society. These sub goals were to be influential for the choice of recipients and of great importance for the development of Swedish bilateral aid (Andersson, 1989).
Although economic development was stressed, the equalization objective gained relevance because it was recognized that economic growth did not necessarily lead to a more equal income distribution. Countries that aimed at economic and social equalization should be prioritized, to ensure that aid did not only target the poor countries, but also that it reached out to the poorest individuals. To fulfil this goal the recipient country should have clear political ambitions of distributing aid to fulfil this equalization objective (Andersson, 1989).
The goal of Swedish aid to promote democracy aims at a long-term development. In the early years of aid this goal was interpreted widely. This was supported by the difficulty in establishing a more democratic system in terms of a Western Society. Recipients ruled by one party-regime still received aid if there was popular participation in the development process to ensure that aid was distributed to the poorest in order to fulfil the equalization objective (Andersson, 1989). Karlström (1996) also confirms this “soft” focus on promoting democracy with aid, by noticing that there was a belief that aid could “do good” no matter what type of developing policy the recipients were practicing.
The Swedish official aid has been allocated to support several countries in their struggle for independency (Andersson, 1989). The sub goal of political independency meant to support countries that were oppressed and had no opportunity of determining their future. Sweden has supported some former colonies in their struggle for independency, supported by the fact that nearly all recipients are former colonies. From the perspective of aid allocation, what is of more interest is the heritage from the colonial powers to the (former) colonies. Former colonies have characteristics that other poor countries may lack, which are copied from their former colonial power. Characteristics inherited by the colonial power that can affect aid allocation are; institutional frameworks of administration, greater trade opportunities and educational systems, which in a long term perspective has proven to be valuable contributors to development (Karlström, 1996). Colonialism has influenced the spread of the English language for instance. Countries where the English language has a dominant position have been favoured, first by missionary workers and later by official aid since this language facilitated communication in the early years. Therefore, the English language has affected the choice of recipient countries although never expressed as an official criteria or motive (Andersson, 1989).
In recent years, the connection between the recipients’ own economic developing policy and the successful implementation of aid has been recognized. Therefore, the choice of recipients is affected more and more by their economic policy. The decreasing number of planned economies and the reduced influence of socialism in Swedish aid policy has lead to a larger focus on market oriented economies. Other goals such as environmental objectives, the low status of women, pluralism and democracy have gained larger weight (Karlström, 1996).
To conclude, there seem to be no clear-cut strategy for the choice of recipients and policies have changed over time. The solidarity motive is the only motive that has remained constant. If actual allocation has followed the stated policy will now be investigated in the next section.
4
Variables and expected results
4.1 Variables
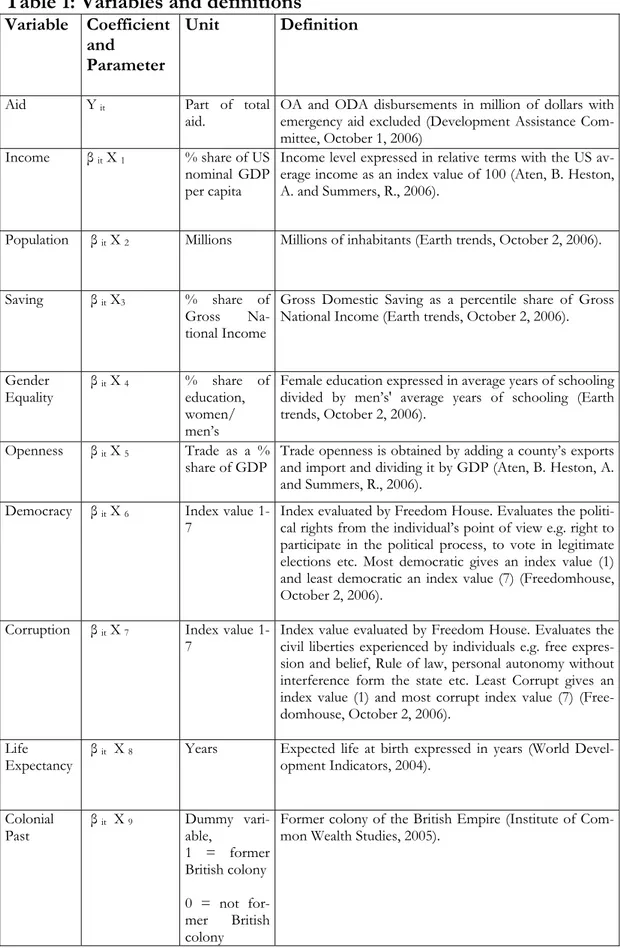
A set of variables are chosen to test if the policies, presented in previous section, is reflected in the actual allocation. The intention is then to investigate the relationship between the variables, included in Table 1, and aid. In other words, the nine independent variables will be tested against the dependant variable, aid.
Table 1: Variables and definitions
Variable Coefficient and
Parameter
Unit Definition
Aid Y it Part of total
aid. OA and ODA disbursements in million of dollars with emergency aid excluded (Development Assistance Com-mittee, October 1, 2006)
Income β it X 1 % share of US
nominal GDP per capita
Income level expressed in relative terms with the US av-erage income as an index value of 100 (Aten, B. Heston, A. and Summers, R., 2006).
Population β it X 2 Millions Millions of inhabitants (Earth trends, October 2, 2006).
Saving β it X3 % share of
Gross Na-tional Income
Gross Domestic Saving as a percentile share of Gross National Income (Earth trends, October 2, 2006).
Gender
Equality β it X 4 % share of education, women/ men’s
Female education expressed in average years of schooling divided by men’s' average years of schooling (Earth trends, October 2, 2006).
Openness β it X 5 Trade as a %
share of GDP Trade openness is obtained by adding a county’s exports and import and dividing it by GDP (Aten, B. Heston, A. and Summers, R., 2006).
Democracy β it X 6 Index value
1-7 Index evaluated by Freedom House. Evaluates the politi-cal rights from the individual’s point of view e.g. right to participate in the political process, to vote in legitimate elections etc. Most democratic gives an index value (1) and least democratic an index value (7) (Freedomhouse, October 2, 2006).
Corruption β it X 7 Index value
1-7 Index value evaluated by Freedom House. Evaluates the civil liberties experienced by individuals e.g. free expres-sion and belief, Rule of law, personal autonomy without interference form the state etc. Least Corrupt gives an index value (1) and most corrupt index value (7) (Free-domhouse, October 2, 2006).
Life
Expectancy β it X 8 Years Expected life at birth expressed in years (World Devel-opment Indicators, 2004). Colonial
Past β it X 9 Dummy vari-able, 1 = former British colony 0 = not for-mer British colony
Former colony of the British Empire (Institute of Com-mon Wealth Studies, 2005).
4.2 Expected
results
Our expected results of the variables’ impact on aid are based on our interpretation of who should receive aid according to the official Swedish policy.
The two common poverty measures, income and life expectancy, are expected to have a negative impact on aid allocation. Income level per capita is a measure of poverty since it reflects the developing countries access to factors of production, such as skilled labour and capital. These factors are essential to modern industry and the lack of these factors prevents the developing countries from escaping poverty. The income level is sometimes criticized for ignoring the income distribution, telling us how broad poverty is but not how deep. However, this variable reflects international differences in both income levels and poverty in relative terms, and these are of interest when analyzing if aid goes to the relatively poorer countries. Life expectancy is reflected by income levels and the average life span falls as relative poverty increases (Krugman, 2004). If the general goal of Swedish aid is to be achieved, countries with relatively low income and/or a lower life expectancy should receive more aid. Alesina and Dollar (1998) supports these expected results regarding income level.
Previous studies (Alesina and Dollar, 1998) find that countries with smaller populations receive more per capita and it is therefore of interest to see if this is true in the Swedish case. However, the amount of aid should be controlled for the size of the recipients’ population. Recipients with larger populations should receive more aid due to the fact that they need more resources. Population size is expected to have positive relation to aid. The trade openness variable is expected to have a positive affect on aid. A positive relation between aid and trade is confirmed by previous studies, Alesina and Dollar (1998) state that good donor behaviour is to respond to the correct economic incentives, i.e. to reward countries with large trade. Swedish aid should be allocated to countries that are more open, to help their escape from poverty (Alesina and Dollar, 1998). Large trade is associated with increased welfare, therefore donors should encourage open economies in order to more effectively promote long-term sustainable growth. The importance of the recipients’ economic policy has become more recognized in recent years (Karlström, 1996). The expected relationship is also supported by the stated economic motive and export credits as a form of aid, because it might encourage Swedish exporters to lobby for recipients with large markets.
Promotion of gender equality is one sub goal of Swedish aid (Karlström, 1996 and Andersson, 1989). But it is complicated to determine how this is reflected in actual allocation. Does it mean that countries with higher gender equality should be rewarded for “good” behaviour, or should the countries that are characterized by higher inequality receive more aid in order to fight it? Therefore, the expected relationship between aid and gender equality is undetermined. Raising the status of the women has several positive effects for the economic growth in a country; like a larger workforce, lower fertility etc. Poor countries are characterized by high inequalities, these inequalities needs to be targeted since a reduction of them are crucial especially for those countries that suffers from high population growth and lack of human capital. By educating women, population growth might slow down and human capital increase (United Development Program, 2006). Poor countries often suffer from a lack of capital, which affects their possibility to save. Low domestic saving rates are not a stated criterion for the choice of recipients or a poverty measure per se. However, it is included because there are those who advocate that
poor countries suffer from structural features, such as low saving due to capital scarcity, and should receive aid to fulfil the capital gap and escape the poverty cycle. Further, structuralism has affected the arguments in favour of aid and is therefore believed to affect actual allocation (Karlström, 1996). Based on these ideas a negative relationship between aid and savings is expected, i.e. recipients with lower saving rates are assumed to receive more aid.
The relationship between aid and democracy should also be negative, meaning that aid should be allocated to more democratic countries. This is based on the fact that one of the Swedish sub goals since 1950 is to promote democracy. In the recent stated criteria for the choice of recipient, it is claimed that the recipient should have a clear policy toward democratic governance. Since Sweden has promoted democracy defined in a broader meaning it is hard to determine how this has been practiced in reality. One-party regimes have received Swedish aid, defended by the belief that as long as there was some kind of popular participation, aid could reduce poverty. Further, it was believed that the countries’ ability to fulfill the equalization objective was not affected by its regime and that aid could still “do good” (Anderson, 1989). Nowadays, the goal of aid to promote democracy is more strictly defined and the recipient should have a clear policy towards promoting democracy (OECD, 2005). Although the interpretation of promoting democracy has changed over time it has been an expressed goal since the 50’s and should therefore have a significant impact on aid allocation. Thus, the expected result is that more democratic recipients should receive more aid, confirmed by previous studies (Alesina and Dollar, 1998). Since democracy is measured by an index with a low value indicating more democracy, the expected relationship is assumed to be negative.
A negative relationship is expected between the corruption variable and aid. This is based on the early stated criteria that the recipients’ should have an ability to absorb aid effectively. Further, in more recent years, it is stated that the recipient’s policy should have a clear focus on fighting corruption (OECD, 2005). The corruption variable is of interest since if aid ought to be effective, and the equalization objective fulfilled, corruption should be low. One can argue that corrupt countries need resources to fight corruption, but such donor behaviour seems rather strange. Instead, good donor behaviour should be to reward recipients with less corruption because less corrupt recipients are expected to correspond better to the stated recipient criteria, i.e. have a better ability of absorption and capacity to meet the equalization objective. If the amount of corruption among the recipients’ is high, it is rather a side effect from choosing the “wrong” countries as recipients’ (Alesina and Weber, 2002).
The expected relationship between colonial past and aid is positive. The recipients’ colonial past can, as stated above, affect the amount of aid. In this study the former British colonies are analysed by including it as a dummy variable giving former British colonies (1) and the rest (0). A positive relationship is expected between colonial past (British) and aid, motivated by that the English language might have worked as an unofficial criteria, facilitating the communication between Sweden and the recipients’ who are former British colonies. The former colonies, might also possess different administrative institutions that have increased their ability to absorb and distribute aid which is in accordance with the stated criteria for the choice of recipient.
5
Data and Descriptive Statistics
5.1 Data
The time period investigated is between 1975 and 2003. The data is divided into seven five year periods; 1975, 1980, 1985, 1990, 1995 and 2003. Due to the problem of finding data for 2005 and 2004, an earlier year was chosen.
Data for all variables is collected for each year and does not represent an average of each five year period. After clearing the dataset from the observations that lack data for some variable, it contains a number of 438 observations which will be used in all of the regressions performed. The data set consist of so called panel data, since the data is collected over time and cross sections. The sample is heterogeneous since every time period contains different recipient countries. New recipients are added over time and although some recipients are dropped, the number of recipients is constantly growing. To facilitate the interpretation of the data each recipient country is given a number, the full list of recipients and their respective number is provided in Appendix 2.
5.2 Descriptive
Statistics
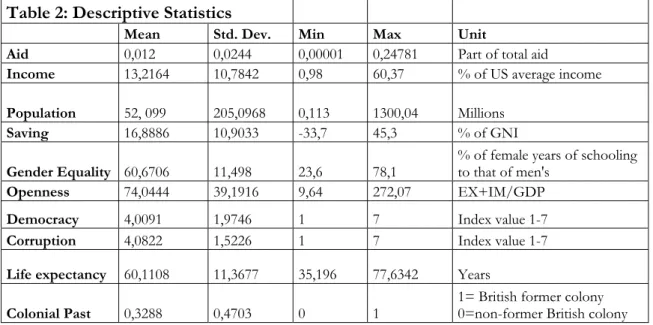
The descriptive statistics in Table 2 is a first step to examine the dataset because it reveals information about the distribution of the variables’ values and the characteristics of the re-cipient countries.
Table 2: Descriptive Statistics
Mean Std. Dev. Min Max Unit
Aid 0,012 0,0244 0,00001 0,24781 Part of total aid
Income 13,2164 10,7842 0,98 60,37 % of US average income
Population 52, 099 205,0968 0,113 1300,04 Millions
Saving 16,8886 10,9033 -33,7 45,3 % of GNI
Gender Equality 60,6706 11,498 23,6 78,1 % of female years of schooling to that of men's
Openness 74,0444 39,1916 9,64 272,07 EX+IM/GDP
Democracy 4,0091 1,9746 1 7 Index value 1-7
Corruption 4,0822 1,5226 1 7 Index value 1-7
Life expectancy 60,1108 11,3677 35,196 77,6342 Years
Colonial Past 0,3288 0,4703 0 1 1= British former colony 0=non-former British colony
The mean income per capita for the recipients is 13,22 % of US average income and the distribution is negatively skewed since the mean value is closer to the smallest income of 0,98 %, than to the highest income of 60,37 %. The maximum value indicates that there are a few outliers or recipients with relatively high income levels that also receive aid. This indicates that Swedish aid is in general allocated to relatively poor countries, but there is a large variation in the income levels among the recipients. Although the average income is low, it is still 13 times that of the poorest country. As a point of reference, the poorest decile of the world’s countries lied below an average income per capita of 2,86 in 2003 (Aten, B. Heston, A. and Summers, R., 2006).
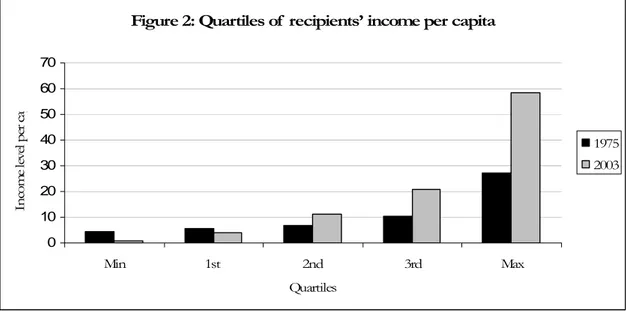
To examine the income levels of the recipients more precisely and changes over time, the data is divided into quartiles for year 2003 and 1975, which is presented numerically in Table 3 and graphically in Figure 2. The quartiles divides the data for 1975 and 2003 into four groups of 25 % and place the observations into one of these groups, were first quartile represents the poorest 25 % of the recipients and fourth quartile represents the richest 25 % of the recipients.
Table 3: Quartiles of recipients’ income per capita
Quartile Income (% of average US)
1975 2003 Min 4,27 0,98 1st 5,54 4,08 2nd 6,66 11,28 3rd 10,34 20,61 Max 27,06 58,21
One can notice a larger variation in the income levels of the recipients in 2003 than in 1975 both from Table 3 and Figure 2, partly because that the number of observations is much larger in 2003 than in 1975. While the 1st quartile has lover income levels in 2003, the 3rd quartile has higher income levels and a larger range than in 1975. Thus, both relatively poorer countries and relatively richer countries are recipients of Swedish aid in 2003, compared to in 1975. As a fact of curiosa, the highest income level in 2003 was Israel, with an income of 58 %, while Sweden’s income that year was 73 % of US average.
Figure 2: Quartiles of recipients’ income per capita
0 10 20 30 40 50 60 70 Min 1st 2nd 3rd Max Quartiles In co m e le ve l p er c ap 1975 2003
The income level seems to have a weak negative curve-linear relationship to part of total aid, which is verified in Appendix 3. This indicates that there is a weak tendency that relatively poorer recipients receive more aid. Life expectancy is another way of measuring poverty. The recipients’ average years of life is 60 and the data is positively skewed to the maximum of 77 expected years of life, with less countries lying around the minimum of 35 years.
All variables show a large variation between the minimum a maximum values, see Table 2, but the poverty measures are of highest interest at this point in the analysis. Therefore, the
Vincent and Grenadines with 100 000 inhabitants and the largest population of 1 300 millions belongs to China. The level of Gross National Savings differ widely between recipients from about -34 % to 45 %. Women’s average years in school to that of men’s fluctuate between 23,6 % and 78 % with a positively skewed distribution towards more equality. The openness variable ranges between 9,6 % and 272 % and again there is a negatively skewed distribution, indicating that most recipients have a small size of trade. However, there are outliers with more than twice as large trade as their GDP, represented by Guyana and Malaysia. All values of the two indices, democracy and corruption, are represented in the dataset and the average recipients lie in the middle of both scales. About a third of the observations belong to recipients that are former British colonies. The next step in the analysis is to test these independent variables separately to determine their individual relationship to aid.
6
Estimation Methods and Results
6.1 Method
As a first step all independent variables are regressed individually against the dependant variable. All nine independent variables are tested separately with Ordinary Least Squares (OLS) regressions in order to see their individual contribution to the variance in aid. Table 4 represents a summary over the nine tested variables and their respective hypotheses.
Table 4: Summary of individual hypothesis testing
Expected Model Hypotheses
Aid i t = β0 + β1 Income1i t + μ H0 = β1 ≥ 0 H1 = β1 < 0 Aid i t = β0 + β2Population 2 i t + μ H0 = β2 ≤ 0 H1 = β2 > 0 Aid i t = β0 + β3Saving3i t + μ H0 = β3 ≥ 0 H1 = β3 < 0
Aid i t = β0 + β4Gender equality4i t + μ H0 = β4 ≥ 0
H1 = β4 < 0 Aid i t = β0 + β5Openness5 i t + μ H0 = β5 ≤ 0 H1 = β5 > 0 Aid i t = β0 + β6Democracy6 i t + μ H0 = β6 ≥ 0 H1 = β6 < 0 Aid i t = β0 + β7Corruption7 i t + μ H0 = β7 ≥ 0 H1 = β7 < 0
Aid i t = β0 + β8Life Expetancy8 i t + μ H0 = β8 ≥ 0
H1 = β9 < 0
Aid i t = β0 + β9Colonial past9 i t + μ H0 = β9 ≤ 0
H1 = β1 > 0
The OLS regression minimizes an un-weighted sum of residual squares, and thus the sum of the residuals becomes as small as possible. It does not make any assumption about the distribution of the disturbances, represented by
u
i,
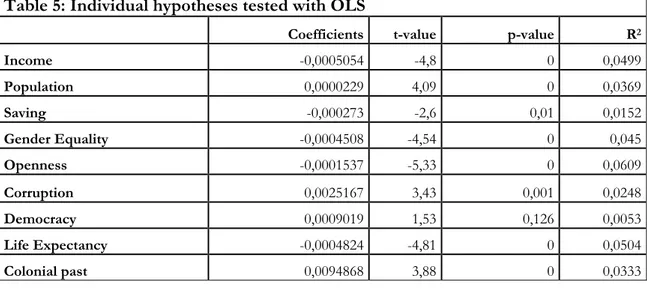
except that it follows a normal distribution with a zero mean and a constant variance. The residuals thus receive the same weight although some observations are closer to the sample regression function. Hence, equal importance is given to them despite how widely scattered the observations areThe result in Table 5 shows that at a 5 % significance level all variables except democracy are significant. Each null hypothesis states there does not exist a relationship between aid and the explanatory variables. If a relationship can be established, the null hypothesis is rejected. For income, population, saving, gender equality, life expectancy and colonial past we can reject the null hypothesis and conclude that the expected relationship do exist. Income is significant and has a negative relationship to aid, with an r square of 4,99%. Life expectancy is also significant and negative as expected.
Gender equality is significant, has an r square of 4,5 % and a negative correlation with aid. Saving is also significant and has a negative relationship with aid. Colonial past is significant and positively correlated with aid and has an r square 3,3 %, this means that former British colonies receive more aid.
The corruption and openness variables are also significant, but do not show the expected relationship to aid. Openness is negatively correlated with aid, with the highest r square of 6,09%. Corruption is positively correlated with aid, indicating that a more corrupt country receives more aid.
The null hypothesis for democracy cannot be rejected, and the expected relationship does not exist. Since the variable representing democracy is not significant, there does not exist any relation between amount of aid received and level of democracy.
Table 5: Individual hypotheses tested with OLS
Coefficients t-value p-value R2
Income -0,0005054 -4,8 0 0,0499 Population 0,0000229 4,09 0 0,0369 Saving -0,000273 -2,6 0,01 0,0152 Gender Equality -0,0004508 -4,54 0 0,045 Openness -0,0001537 -5,33 0 0,0609 Corruption 0,0025167 3,43 0,001 0,0248 Democracy 0,0009019 1,53 0,126 0,0053 Life Expectancy -0,0004824 -4,81 0 0,0504 Colonial past 0,0094868 3,88 0 0,0333
6.2 Multicollinearity
The next step in the analysis is to perform joint hypothesis to test the relevance of all the variables together and how well they fit the model. Before doing so one must test the dataset for multicollinearity, heteroscedasticity and autocorrelation. We find no serious problem of autocorrelation in the dataset, this is tested by the Durbin-Watson statistic. The data show signs of heteroscedasticity, but this will be corrected at a later stage in the analysis.
There is a problem with multicollinearity in the dataset which will be examined in this section. Multicollinearity occurs when there is correlation among the independent variables and this causes the estimates obtained from a joint OLS regression to be less accurate. A rule of thumb is that a correlation between two independent variables below 0.7 does not
give rise to any serious problem of multicollinearity, like distortions of the standard errors, leading to incorrect conclusions about the variables significance. A way to solve for problems with multicollinearity is to remove correlated variables, since it does not make sense to include variables that are highly correlated. They would not make a unique contribution to the regression.
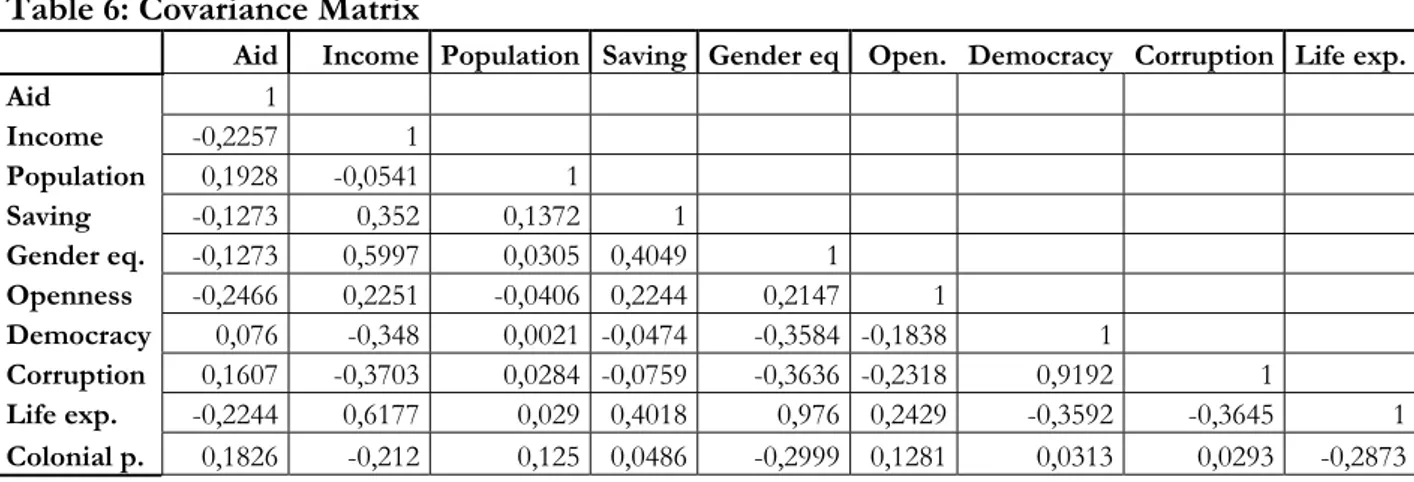
Table 6 presents a correlation matrix for the dataset and there are four variables that have a correlation higher than 0,7. The two indices, democracy and corruption are correlated to 0,91, which makes intuitively sense since the indices are obtained by the same study and measures freedom (political rights=democracy, civil liberties=corruption). The correlation indicates that more democratic countries are less corrupt. Thus, we believe that the democracy variable will catch the effects of corruption and vice versa, and therefore separate regressions are made to isolate their individual effects. The other two correlated variables are life expectancy and gender equality and again we have chosen to do separate regression for each of them to be able to determine their correct contribution to the variance in aid. The correlation between gender equality and life expectance is supported by economic literature which finds that high gender equality leads to higher growth, which leads to higher income and better health (Todaro and Smith, 2003).
Table 6: Covariance Matrix
Aid Income Population Saving Gender eq Open. Democracy Corruption Life exp.
Aid 1 Income -0,2257 1 Population 0,1928 -0,0541 1 Saving -0,1273 0,352 0,1372 1 Gender eq. -0,1273 0,5997 0,0305 0,4049 1 Openness -0,2466 0,2251 -0,0406 0,2244 0,2147 1 Democracy 0,076 -0,348 0,0021 -0,0474 -0,3584 -0,1838 1 Corruption 0,1607 -0,3703 0,0284 -0,0759 -0,3636 -0,2318 0,9192 1 Life exp. -0,2244 0,6177 0,029 0,4018 0,976 0,2429 -0,3592 -0,3645 1 Colonial p. 0,1826 -0,212 0,125 0,0486 -0,2999 0,1281 0,0313 0,0293 -0,2873
Yet another correlation is between income and life expectancy, they are correlated to 0,62 which is below the rule of thumb for multicollinearity and since we will perform regressions both including and excluding life expectance the results can be compared. The correlation between income and life expectancy is both discussed and supported in economic literature, Krugman (2004) states that income is reflected by life expectancy, with the expected years of life at birth decreasing as income falls and poverty increases. This relationship makes sense since both are different measures of welfare.
Corruption is negatively correlated with both income and gender equality to about 0,37 indicating a weak tendency that countries that have higher income and gender equality are less corrupt. Democracy is negatively correlated with both income and gender equality, meaning that countries that are more democratic have a higher welfare when measured by income level and gender equality. Openness has a weak positive correlation with income meaning that countries with a larger trade have a higher income. Openness and corruption have negative relationship that indicates that more open economies are less corrupt, supported by Torrez (2002).
We do not believe that separating the highly correlated variables into several regressions will lead to specification bias of the model, because there is no explicit theory that demands that these variables need to be included when predicting aid allocation.
6.3 Joint Hypothesis Testing
The joint hypothesis with all nine independent variables will be tested with multiple linear OLS regressions which make predictions of the dependent variable, and analyses the independent variables’ effects on aid.
The following model, based on the relationship found in the individual regression, is estimated in the OLS regressions:
Aid i t = β0 + β1 Income1i t + β2Population 2 i t + β3Saving3i t + β4Gender Equality4i t + β5Openness5 i t + β6Democracy6 i t + β7Corruption7 i t + β8Life Expetancy8 i t + β9Colonial past9 i t + μ
Null hypothesis: H0 = β1 = …. = β9= 0 Alternative hypothesis: H1 ≠ β1 ≠ …. ≠ β 9 ≠ 0
The joint model test whether or not it is possible to reject the null hypothesis which state there is no significant relationship between the dependent and the independent variables (Hall, Kerr, and Kozub, 2002).
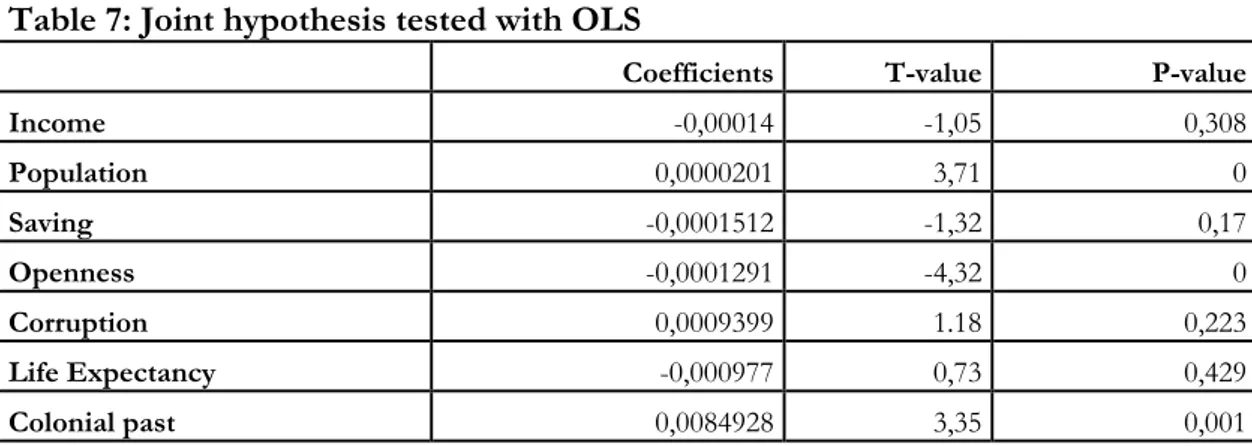
Table 7 is the output results for the OLS regression that yields the highest r-square value, explaining 15,54% of the total variance in aid. Democracy and gender equality are excluded, since the regressions performed with them included give a lower r square. Before examining the explanatory variables individual effect on aid, the relevance of the whole model is determined by investigating the F-value. At a 5 % level of significance the null hypothesis is rejected and we draw the conclusion that there exist a relationship between aid and the model.
Table 7: Joint hypothesis tested with OLS
Coefficients T-value P-value
Income -0,00014 -1,05 0,308 Population 0,0000201 3,71 0 Saving -0,0001512 -1,32 0,17 Openness -0,0001291 -4,32 0 Corruption 0,0009399 1.18 0,223 Life Expectancy -0,000977 0,73 0,429 Colonial past 0,0084928 3,35 0,001
At a 5 % significance level the critical, three variables are significant, see Table 7. The results indicate that; population, openness and colonial past have a significant relationship with aid. Population is positively related to the amount of aid received which means that recipients with larger populations receive a larger part of total aid. Colonial past also show a significant and positive relationship with aid, thus former British colonies are favoured. The openness variable has a negative relationship with amount of aid received, stating that less open recipients, i.e. recipients that have a smaller size of trade receive more aid.
6.4 Generalized Least Square Regression
To refine the analysis a Generalized Least Square (GLS) regression will be performed because OLS regressions may generate misleading results since it gives equal variance to all observations. Due to the dataset used, which is both heterogeneous and shows signs of heteroscedasticity, GLS regressions may generate a more reliable result. With GLS, the observations closely clustered around the mean value are given more weight then those situated further away. The GLS method uses the information of the unequal variance in the dependent variable by dividing the original model by its standard error. In a GLS regression a weighted sum of the residuals is minimized and μ *I becomes homoscedastic. Because all parameters and variables are transformed the estimated model is rewritten: Aid* i t = β*0 +β*1 Income*1i t + β*2Population* 2 i t + β*3Saving*3i t +β*4Gender
Equality*4i t - β*5Openness*5 i t + β*6Democracy*6 i t + β*7Corruption*7 i t + β*8Life Expectancy*8 i t + β*9Colonial past*9 i t + w* it
Null hypothesis: H0 = β*1 = …. = β*9= 0 Alternative hypothesis: H1 ≠ β*1 ≠ …. ≠ β* 9 ≠ 0
It should be noticed that we are using the random effects approach, a method in the field of GLS, which compensates for failing to include relevant explanatory variables and expresses this in the disturbance term. Since the tested model only explains about 15 % of the variation in aid when running OLS regressions, there are other explanatory variables not included in the model that affect aid. The sample used is so heterogeneous that one must assume that there are different intercept values for different recipients, and instead of treating the intercept as fixed, it is assumed to be a random variable with a common mean value βo. The intercept for a recipient is expressed as βoi = βo +εi with the error term, εi reflecting the individual differences in the intercept values. Therefore, the error term μ* is rewritten to w* it including both the normal error μ* it term and the one that represents the individual differences, εi.
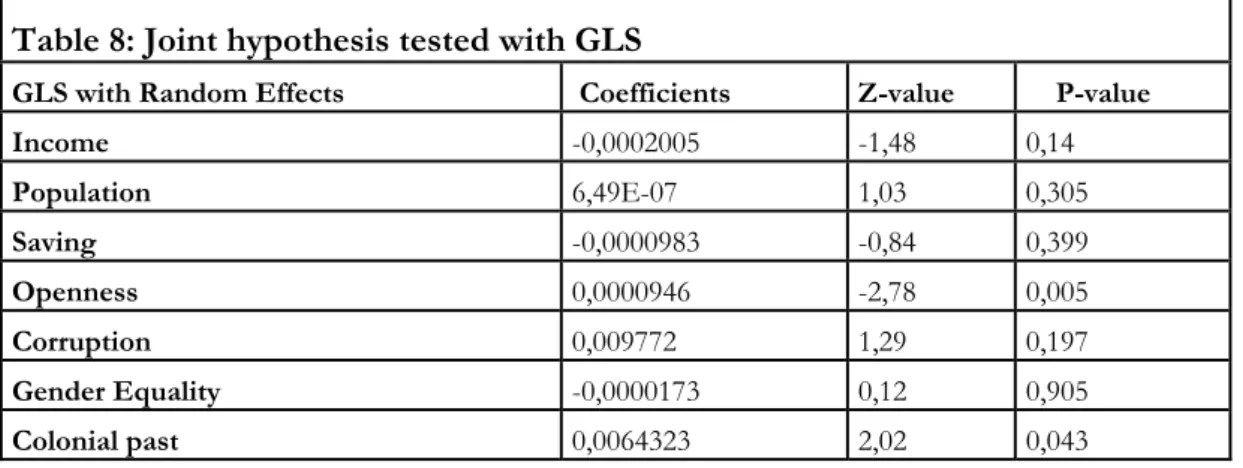
Table 8 presents the results from a GLS regression with the random effects and, again, several regressions were performed to separate the correlated variables, and the one with the highest r square is presented. In this case the variables representing democracy and life expectancy are excluded due to multicollinearity. When running the GLS regression with random effects, the observed chi-square value is larger than the critical, and the null hypothesis is rejected. We conclude that there is a significant relationship between the independent variable and the explanatory variables. The r-square value is 0,1445, thus the variables explain about 14,45 % of total variance in aid.
Table 8: Joint hypothesis tested with GLS
GLS with Random Effects Coefficients Z-value P-value
Income -0,0002005 -1,48 0,14 Population 6,49E-07 1,03 0,305 Saving -0,0000983 -0,84 0,399 Openness 0,0000946 -2,78 0,005 Corruption 0,009772 1,29 0,197 Gender Equality -0,0000173 0,12 0,905
The GLS regression with random effects generate only two of the independent variables have a significant relationship with aid. At a 5 % significance level, openness and colonial past are statistically significant. Openness is negatively correlated to aid, again meaning that recipients with smaller size of trade receive more aid. The colonial past variable also shows a significant and positive relation to aid. As in the results from the OLS regression, the former British colonies receive more aid.
The starting point in the analysis was to describe the data and perform individual OLS regressions for all the independent variables. In the individual OLS regression all independent variables except democracy were statistically significant. When tested jointly only two variables came out significant in the GLS regressions with random effects, and three variables when running the OLS regression.
The differences between the OLS regression and GLS regression with random effects are relatively small. Although a slightly higher r square value is obtained with OLS, the GLS with random effects should fit the data better according to the properties of the sample and is therefore considered to give the most accurate results.
7 Analysis
The factors affecting aid allocation have been investigated by individual OLS regressions, joint OLS regressions and joint GLS regressions with random effects. We believe that the latter (GLS with random effects) gives the most accurate results, indicating that openness and colonial past have a significant impact on aid. Therefore, we will first analyse these results, but for the sake of interest all variables and their relationship to aid will be commented.
Openness was significant in the regressions, but opposite to the expected result it was negatively correlated with aid. The results indicate that Sweden allocated more aid to recipients with a smaller size of trade, i.e. more closed economies. Thus, Sweden did not reward open polices and did not respond to the correct economic incentives as found by Alesina and Dollar (1989). However, it should be noticed that Alesina and Dollar used the Sachs-Warner index which measures openness in a broader context; considering trade liberalization, protection of property rights and improved policy management. The openness variable used in this paper considers the size of trade i.e. openness is more strictly defined, reflecting the recipient’s economic policy through the size of trade. Since Sweden did not reward countries with a larger trade, the economic motive of contributing to a larger common market or promoting exports is not reflected in actual allocation. More closed economies have a tendency of being more corrupt, proven by the covariance matrix and supported by Torrez (2002). There was also a weak positive correlation between openness and income. These results indicate that closed economies have a higher tendency for being poorer and more corrupt. That the recipients are poorer is in accordance with stated policy, but more corrupt countries have a lower ability to absorb aid effectively and this contradicts stated policy. Further, it is stated in more recent years that the recipient should have a clear policy towards fighting corruption. Based on this, we find that Sweden’s allocation does not follow the stated policy when favouring closed economies. Although today it is widely agreed upon the fact that open economic policies is good for economic development, we believe that Sweden’s allocation pattern is driven by other explanatory factors such as long term relations, rather than the recipients’ economic policy. This reasoning is supported by the fact that, although using an advanced GLS regression with random effects, we did not obtain a high r square indicating that other factors are affecting Swedish aid allocation.
The results from the regressions also indicate that colonial past affects aid allocation and that Sweden rewards former British colonies. The colonial powers provided the former colonies with an institutional and legal framework that might have affected the amount of aid that these former colonies have received. The heritage may well have increased the former colonies ability to absorb aid and directed allocation towards these. Political independency, a sub goal of aid, might also have directed aid towards former colonies. However, this does not tell us why the former British colonies are favoured. Since the majority of the recipients’ are old colonies, the importance of only considering the former British colonies is that we capture the effect of the English language. Early missionary work, the predecessor of today’s aid, was established in former British colonies because the English language served as a mean of communication. Today’s aid has been guided by its predecessors and has therefore been allocated to the former British colonies. This is not believed to be a consequence of the stated policy, but rather an effect of that the English language originally worked as a necessity when allocating aid. Thus, language seem to have been a criterion for the choice of recipients’, not stated in the official Swedish policy, as
The rest of the variables, although not significant in the GLS regression with random effects, will now be analysed.
In the joint OLS regression a third variable, population, was significant and had a positive relationship to aid. Thus recipients with a larger population received more aid, which makes intuitively sense since it should be adjusted for the size of population. Previous studies (Alesina and Dollar, 1998) showed that smaller countries received more aid per capita. However, population size was included as an explanatory variable instead of examining aid per capita and we therefore cannot fully verify Alesina and Dollar’s result. Income and life expectancy were both significant in the individual regressions. They were negative correlated with aid, indicating that poorer recipients receive more aid. This supports the solidarity motive and is accordance with the general goal of aid. None of these variables were significant in the joint regressions, thus they are not strong determinants of aid allocation. This contradicts the results of Alesina and Dollar (1998) which found that the Nordic donors target the poorest. What the definition of poor is, is a constant subject for discussion, since there is a large variation in ways to measure poverty. Besides this, poverty is relative, although a country is poor it might still be better off than another relatively poorer country. The results from the descriptive statistics indicate that the Swedish recipients are poor countries with an average income of 13 % of US average. This is not the same as stating that Swedish aid is targeting the poorest countries in the world. There was a large variation in per capita income and life expectancy, which serve as our poverty measures. If targeting the poorest was the only criteria for aid allocation, then other countries would be better candidates, considering that the poorest decile of the world have an average income of 2,68 %. Therefore, other criteria than the degree poverty affects the choice of recipients of Swedish aid. However, Sweden is acting according to the general goal which is “ to help raise the living standards of the poor”.
Gender equality was significant in the individual regression, meaning that a country with less gender equality received more Swedish aid. Thus, the goal of promoting gender equality seems to be have been promoted by targeting countries with higher gender disparities. But gender equality is not believed to determine aid allocation because it was not given much weight in the Swedish aid policy. This is supported by the fact that it was not significant in the joint regressions.
The variable that represent the recipients’ saving rates was negatively correlated to aid i.e. recipients with low domestic savings received more aid. This corresponds to the ideas presented in the structuralic theory and our expected results. Low saving rates is not a stated criteria in Swedish policy, but it is still of interest since structuralistic theory is said to have had a large influence on the formation of aid. However, we found that savings was not significant in the joint regressions and thus had no affect on aid allocation.
Democracy was not significant in the joint or individual regressions, this goes against other studies which state that Nordic countries reward democracy (Alesina and Dollar, 1989). This means that Sweden allocates aid despite the recipients’ level of democracy, although this has been a stated goal since the 1950’s, we therefore conclude that Sweden has not acted according to stated policy. Our result can be explained by the fact that has Sweden traditionally promoted democracy in a weaker sense, based on the belief that aid could “do good”, irrespectively of the ruling regime. This allocation behaviour was based on the belief that there were many ways of fighting poverty and promoting development, and one could not compare democracy in the developing world to that in a Western Society . This way of
reasoning might have affected aid allocation away from more market oriented regimes which today are recognized as more democratic.
The corruption variable was significant and positively correlated to aid in the individual regression, indicating that more corrupt recipients received more aid. Our expected result was based on previous studies (Alesina and Weber, 2002) claiming that Scandinavian countries allocated less aid to corrupt countries. However, we do not believe that our result means that Sweden favoured corrupt recipient, instead it reflects a failure in the decision making process. In 2003, official Swedish policy stated that the recipients should have a clear domestic policy towards fighting corruption, which can be a result of the recognition that there was a serious problem of corruption needed to be addressed. The result might not be that surprising if one considers that Sweden allocated more aid to closed economies, which have a tendency to be more corrupt. This means that the criteria of the choice of recipients are not followed, since a corrupt country’s ability to absorb aid effectively ought to be lower than a less corrupt. The recipients with more corruption are less likely to fulfill mutual agreements of e.g. aid distribution. There is no rationale behind allocating more aid to more corrupt countries, but rather a failure of the Swedish choice of recipients.
To conclude the analysis, we again stress that the GLS regression with random effects is considered to produce the most accurate results. Therefore, openness and colonial past are the two variables that determine aid allocation. Considering the official policy of Swedish aid; democracy, corruption and poverty will be considered in the conclusion. As explained in this section, the income measures should have an impact on aid allocation because the general goal of aid is to reduce poverty, but in our results they are insignificant. Democratic and less corrupt countries should be rewarded if aid allocation followed stated policy, but non of them were significant in the GLS regression with random effects.
Based on these results we conclude that there is an inconsistency between the official policy and actual allocation of Swedish aid.