Hydration of Thermally Denatured Lysozyme Studied by Sorption Calorimetry and
Differential Scanning Calorimetry
Vitaly Kocherbitov* and Thomas Arnebrant
Biomedical Laboratory Science, Health and Society, Malmo¨ UniVersity, SE-20506 Malmo¨, Sweden ReceiVed: April 19, 2005; In Final Form: March 14, 2006
We have studied hydration (and dehydration) of thermally denatured hen egg lysozyme using sorption calorimetry. Two different procedures of thermal denaturation of lysozyme were used. In the first procedure the protein was denatured in an aqueous solution at 90°C, in the other procedure a sample that contained 20% of water was denatured at 150°C. The protein denatured at 90°C showed very similar sorption behavior to that of the native protein. The lysozyme samples denatured at 150°C were studied at several temperatures in the range of 25-60°C. In the beginning of sorption, the sorption isotherms of native and denatured lysozyme are almost identical. At higher water contents, however, the denatured lysozyme can absorb a greater amount of water than the native protein due to the larger number of available sorption sites. Desorption experiments did not reveal a pronounced hysteresis in the sorption isotherm of denatured lysozyme (such hysteresis is typical for native lysozyme). Despite the unfolded structure, the denatured lysozyme binds less water than does the native lysozyme in the desorption experiments at water contents up to 34 wt %. Glass transitions in the denatured lysozyme were observed using both differential scanning calorimetry and sorption calorimetry. Partial molar enthalpy of mixing of water in the glassy state is strongly exothermic, which gives rise to a positive temperature dependence of the water activity. The changes of the free energy of the protein induced by the hydration stabilize the denatured form of lysozyme with respect to the native form.
Introduction
Protein unfolding (denaturation) is a transition from the native state to the denatured state. To understand the thermodynamics of protein unfolding one has to know the properties of the native protein as well as the properties of the denatured protein1. Knowing the thermodynamic functions of the protein in the native and in the denatured state, one can describe the process of unfolding of a protein. The situation, however, is more complicated since native, and especially denatured, states of proteins are not always well-defined states, but ensembles of different configurations of protein molecules. One can consider all the conformations in the process of protein unfolding as a continuum of states where the native and the denatured states will be more populated than other states. When the population of intermediate states is small then the unfolding can be described with a two-state model; when the intermediate states are populated, then a three-state model can be used2. The structure of the denatured state can differ depending on the conditions of denaturation3: thermal denaturation, acidic de-naturation, or denaturation using denaturants such as urea or GuHCl. In many cases the heat-denatured and acid-denatured proteins preserve most of their secondary structure, while denaturation by urea or GuHCl produces less-ordered and more unfolded structures due to the solvating properties of the denaturants (although there are some data indicating the persistence of nativelike topology in a protein denatured by urea4). Depending on the degree of unfolding, the denatured states can be classified as unfolded denatured and compact denatured2 (although sometimes the words “unfolded” and “denatured” are used as synonyms). The widely used term
“molten globule” is then a particular case of a compact denatured state. Hydration properties of compact denatured states of proteins, according to NMR data,5are close to those of native proteins.
Since water plays an important role in the process of unfolding of proteins, the thermodynamic functions of hydration of both native and denatured forms of proteins have to be known for a description of denaturation. Thermodynamic properties essential for the description of protein hydration are the sorption isotherm (dependence of water activity on water content), the enthalpy of hydration, and the glass transition behavior (includ-ing dependence of the glass transition temperature on water content). It is known that glass transition behaviors in native and denatured proteins are very different. Denatured proteins exhibit a distinct step in heat capacity upon heating,6,7 while the glass transition in native proteins is less pronounced and more clearly seen in isothermal heat capacity data (see, for example, the heat capacity data of lysozyme-water mixture8). To explain this difference we suggested that the glass transition in native lysozyme occurs separately for every protein molecule.9 While the hydration of native proteins (and lysozyme in particular) is a subject of a number of studies (see, for example, refs 9-11, and references therein), there are only few studies of the hydration of denatured proteins. Bull12studied sorption isotherms of several native proteins and of one denatured protein using sorption of water vapor from solutions of sulfuric acid. He noted that “heat coagulated egg albumin is not as hydrophilic as the native egg albumin”. Kumagai et al.13 studied water sorption by native and denatured ovalbumin using a sorption balance technique. They reported that the affinity of native ovalbumin for water was larger than that of urea-denatured ovalbumin. Nonetheless, they did not observe a difference
* Corresponding author phone: +4640 6657946; fax: +4640 6658100; e-mail: Vitaly.Kocherbitov@hs.mah.se.
10.1021/jp0520289 CCC: $33.50 © 2006 American Chemical Society Published on Web 04/08/2006
between sorption behaviors of native ovalbumin and thermally denatured ovalbumin. Benson and Richardson14studied sorption isotherms of native and denatured egg albumin and found that the hysteresis in the sorption isotherm of heat-denatured protein is even higher than in that of the native protein. They concluded that denaturation produces a compact structure.
To our knowledge, neither the sorption isotherm nor the enthalpy of hydration of denatured lysozyme has been reported previously. Moreover, no denatured protein was ever studied using the method of sorption calorimetry,15,16 which allows simultaneous high-resolution monitoring of the sorption isotherm and the enthalpy of mixing. Here we present a sorption calorimetric study of hydration of thermally denatured lysozyme. Differential scanning calorimetry (DSC) data for the same composition region are also presented. The experimental data are compared with the corresponding data for native lysozyme obtained in our previous study.9
Materials and Methods
Hen egg white lysozyme was purchased from Sigma (catalog number L6876). According to the manufacturer, lysozyme was three times crystallized, dialyzed and lyophilized. We did not perform any further treatment of the protein except for denaturation and drying. Two different denaturation procedures were used. In the first procedure (low-temperature denaturation) a lysozyme solution was kept at 90°C during 3 h. The obtained white precipitate of denatured lysozyme was separated from the liquid and then dried in a vacuum in contact with 3Å molecular sieves for at least 20 h. In the second procedure (high-temperature denaturation) a mixture of native lysozyme with water (water content was about 20 wt %) was kept at 150°C in a closed stainless steel container during 1 h. After high-temperature denaturation the lysozyme sample was yellow in color and smelled of H2S. The denatured protein was then dried in a vacuum at room temperature in contact with 3 Å molecular sieves for at least 20 h. Most of the experiments were conducted using the high-temperature denatured lysozyme, while the samples denatured at low temperature were used only for some experiments at 40°C.
The method of sorption calorimetry was used to monitor water activity awand partial molar enthalpy of mixing of water Hw
m . A two-chamber calorimetric cell (diameter 20 mm) with the sample chamber on the top and water chamber on the bottom was used. The calorimetric cell was inserted into the double-twin calorimeter.17Sorption and desorption calorimetric experi-ments were conducted following the procedures described in detail elsewhere.15-18Water activity was calculated as described in ref 18. The thermal powers corresponding to the evaporation of water in the vaporization chamber and to the sorption of water vapor in the sorption chamber were used to calculate the partial molar enthalpy of mixing of liquid water with the protein Hwm. For the calculations of the enthalpy Hwm, the sorption calorim-eter was calibrated using magnesium nitrate hexahydrate as a standard substance.19Masses of lysozyme samples were in the range 12-60 mg. A typical time of a calorimetric experiment was about 5 days. Sorption experiments were performed at 25, 40, and 60 °C and desorption experiments at 25 °C. In the desorption experiments,16a nonsaturated solution of Mg(NO
3)2 was used as a water vapor sink.
Differential scanning calorimetry (DSC) experiments were performed using a differential scanning calorimeter, Seiko DSC220, in different temperature ranges between -5 and 200 °C. The scan rate was 1 °C/min. The samples with typical masses 4-10 mg were placed in aluminum pans and
hermeti-cally sealed. In some cases the samples with particular water contents were prepared by sorption of water vapor from saturated salt solution on lysozyme denatured as described above. In other cases, water vapor was absorbed by native lysozyme, then the samples were denatured in DSC experiments. After that, the DSC experiments were repeated in order to get “second scans” reflecting the properties of denatured lysozyme. The glass transition temperature Tg was determined as a midpoint of the glass transition step. To obtain the change of the heat capacity of the glass transition∆Cp, the baselines before and after glass transition were extrapolated to the glass transition temperature and the difference between the two extrapolated values was calculated.
Results and Discussion
Water Activity: Sorption Results. The lysozyme thermally denatured at relatively low temperature (90 °C) was studied using sorption calorimetry at 40°C. The sorption isotherm of the low-temperature denatured lysozyme was very similar to the sorption isotherm of the native lysozyme reported in our previous study.9The observed activity of water in the denatured lysozyme was slightly higher than in the native lysozyme, but the shape of the curve was identical. Since the particles of the denatured material were larger than in the native protein, it is possible that the apparent small increase of the water activity was caused by the slower kinetics of sorption of water by the denatured protein. The similarities of the sorption behavior of native and low-temperature denatured lysozyme indicate that the structures of these two types of lysozyme are very similar. Since it is known from literature that heat denatured proteins are in a compact denatured state1,2,4, and taking into account the similarities of the sorption behavior of the two types of lysozyme, we suggest that the lysozyme denatured at 90°C is in the compact denatured state.
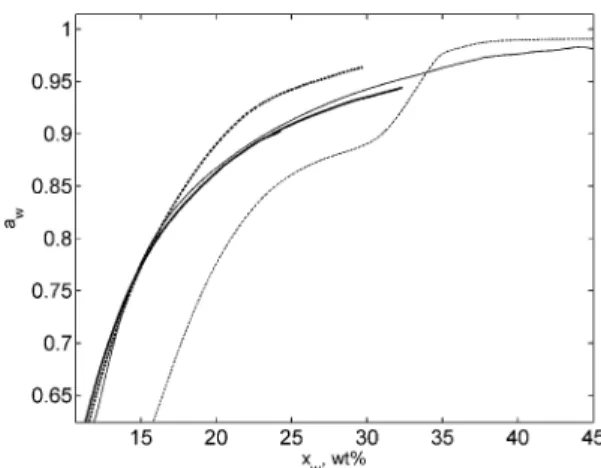
In further experiments, we used the lysozyme denatured at 150 °C. The sorption calorimetric experiments with high-temperature denatured lysozyme were performed at 25, 40, and 60°C. The activity of water in the denatured lysozyme-water mixture at 25°C is presented in Figure 1. The activity curve is similar in shape to that of native lysozyme presented in our previous publication.9For comparison, a part of the sorption isotherm of native lysozyme is also presented in Figure 1. At water contents up to 15 wt % the two isotherms are very close
Figure 1. Calorimetric results on water activity in the mixture with denatured lysozyme (solid line) and native lysozyme (dashed line) at 25°C. Results of static sorption of water vapor from saturated solution of MgCl2: (+), denatured lysozyme; (O), native lysozyme. The insert
shows the sorption isotherms of denatured lysozyme (solid line) and native lysozyme (dashed line) at 60°C.
to each other, the difference between them is about the value of the uncertainty of the measurements. At a composition of 15 wt % of water, the two sorption isotherms start to diverge; the activity of water mixed with denatured lysozyme is significantly lower than the activity of water in the mixture with the native protein. This can be explained by the fact that the denatured lysozyme has a greater surface available for contact with water molecules. In the native protein, a large part of the material is prevented from contact with water due to the globular structure of the proteins. The amino acid residues hidden inside the globule cannot interact with water, while in the extensively unfolded denatured protein they are exposed to water molecules. Therefore, at the same water activity the denatured protein can absorb a higher amount of water (or, at the same composition, the activity of water absorbed by the unfolded protein is lower). On the other hand, at lower water contents, the two sorption isotherms are very close to each other. In Figure 1, the low-water content part of the activity curve of the native lysozyme is not shown since it is very sensitive to the kinetics of the water sorption.9 Instead, two data points obtained by static sorption of water vapor on the two types of lysozyme are presented. The source of the vapor was a saturated solution of MgCl2giving RH ) 32.8%. The difference between the water contents in the two types of lysozyme after one week of equilibration at 25°C was about 0.2 wt %; in other words, the sorption properties of the denatured lysozyme at low water contents are very similar to the sorption properties of the native lysozyme. From the molecular-level point of view, this means that the unfolding of the protein does not affect the sorption properties of lysozyme at water contents up to 15 wt % even if the surface accessible for solvent is larger. We suggest that the reason for the apparent absence of any effect of the folding on the sorption behavior at low water contents is in the distribution of the charged and polar groups in the globule of the native protein. The most hydrophilic amino acid residues of lysozyme are on the surface of the protein (lysozyme has only one charged group that is less than 5% exposed20), while the hydrophobic residues are hidden inside the globule. During the initial steps of water sorption, the water molecules are preferentially adsorbed on ionized and highly polar groups, which are available for the interactions with water in the native form of the protein as well as in the denatured form. Hence the two isotherms are very close during the initial sorption and diverge at higher water contents, when most of the hydrophilic sorption sites are hydrated.
The sorption isotherms of the native and denatured lysozyme at 60°C are shown in the insert of Figure 1. The main feature of the sorption behavior at this temperature is the same as at 25 °C: after taking up some amount of water, the denatured lysozyme shows more hydrophilic properties than the native protein. The difference in the behavior at the two temperatures is in the water content, at which the curves start to diverge. At 60°C this water content is about 12 wt %, which is less than the corresponding water content at 25°C. We suggest that the reason for the shift of the divergence point is in the difference in the distribution of water molecules on sorption sites at these two temperatures. At 25°C, the water molecules are preferen-tially adsorbed on ionized and strongly hydrophilic sorption sites, while less hydrophilic sites are less occupied. At elevated temperatures (for example, 60°C), because of entropic reasons, the water molecules are more evenly distributed on the sorption sites. As a consequence, the additional sorption sites available in the unfolded protein become occupied at lower water contents than at 25°C. As a result, the point at which denatured protein
can take up more water than the native one, moves to lower water contents.
Figure 2 shows the sorption isotherms of denatured lysozyme at 25, 40, and 60°C. One can see that water activity increases with increasing temperature. The temperature dependence of the water activity is more pronounced at low water contents, while at high water contents, the activity change is close to values of uncertainty of the measurements. A more detailed discussion of the temperature-dependence of water activity is given at the end of the article.
Water Activity: Desorption Results. The method of de-sorption calorimetry16is used to study the interactions of water with samples which have high water activities. In desorption calorimetric experiments protein-water mixtures with high water contents are slowly dehydrated, and the activity of water as well as partial molar enthalpy of mixing of water are continuously monitored. We performed a desorption calorimetric study of denatured lysozyme at 25 °C. The results of the measurements of water activity in the desorption experiment are presented in Figure 3. For comparison, the sorption isotherm of the denatured lysozyme, as well as the sorption and desorption isotherms of native lysozyme obtained in our previous study,9 are presented. The sorption and desorption isotherms of native lysozyme differ very much, i.e., a strong hysteresis is observed.9 The results presented in Figure 3, indicate that denatured lysozyme does not show a pronounced hysteresis. The activity of water in the desorption experiments is only slightly higher than in the sorption experiments, while in the case of native lysozyme, it is much lower. Previously,9we have suggested that the hysteresis on the sorption isotherm of native lysozyme is
Figure 2. Water activity in the denatured lysozyme-water system at (from bottom to top): 25, 40, and 60°C.
Figure 3. Water activity in lysozyme-water system at 25°C. Solid denatured lysozyme; dashed native lysozyme. Thick lines-sorption experiments; thin lines-delines-sorption experiments.
due to the difference in association properties of lysozyme in solid state and in solution. The lysozyme-water mixture obtained by dehydration of a solution consists of largely disaggregated molecules having the same structure as in the solution. The lysozyme-water mixtures obtained by the addition of water to the dry lyophilized protein inherit the aggregation properties and structure of dry lysozyme.
With respect to structural features, it is known that theβ-sheet content in dry lyophilized lysozyme is higher than in lysozyme in solution.21,22The denatured lysozyme has different aggrega-tion properties. During denaturaaggrega-tion the disulfide bonds are disrupted and new bonds are formed.23It is very likely that in the present denaturation procedure (at low water content), disulfide bridges are formed between different lysozyme molecules. Therefore, the denatured lysozyme can be considered as a network of polypeptide chains interconnected by disulfide bridges. Such a network cannot change its structure as easily as can an ensemble of individual lysozyme molecules, which is the reason for the absence of a pronounced hysteresis. In the following, we shall compare the hydrophilicity of the three different forms of lysozyme considered in this study. These three forms will be called as follows:
Solid lyophilized, when we refer to initial native lyophilized lysozyme and its mixtures with water obtained in sorption experiments; this form of lysozyme has higherβ-sheet content than does native lysozyme in solution.
Native dehydrated, when we refer to the partly dehydrated lysozyme obtained in desorption experiments; dehydrated does not mean particularly low water content, rather the way the sample was prepared.
Denatured, when we refer to lysozyme denatured at 150°C. As a first approximation, we consider it independent of the hydration/dehydration history.
Hence the desorption isotherm of native lysozyme (dashed thin curve in Figure 3) can be considered as a sorption isotherm of native dehydrated lysozyme.
The sorption/desorption isotherm of the denatured lysozyme lies between the sorption and desorption isotherms of native lysozyme (at compositions between 15 and 34 wt % of water). In other words, the denatured lysozyme is more hydrophilic than the solid lyophilized lysozyme, but less hydrophilic than the native dehydrated lysozyme. As was mentioned above, the denatured lysozyme is more hydrophilic than the solid lyoph-ilized lysozyme because of the higher surface area accessible for solvent. The native dehydrated lysozyme is more hydrophilic than the other two forms because of its native globular structure. In the native lysozyme, the most hydrophilic groups of the protein are on the surface of the globule, while the hydrophobic groups are in the center of the globule and do not have contact with water. In the unfolded protein an “average” sorption site available for contact with water is less hydrophilic than in the native dehydrated protein. One should also take into account the fact that the aggregation of denatured lysozyme can prevent some of the hydrophilic groups from contact with water. However, these arguments are valid only up to a certain water content (about 34 wt % of water). At this water content the hydrophilic groups of the native globular lysozyme become fully hydrated and water added to the system does not interact strongly with the protein molecules and has properties close to those of bulk water. At the same water contents, due to the higher available surface, denatured lysozyme still can provide sorption sites for added water molecules, i.e., it becomes more hydrophilic.
Glass Transition (DSC). The method of sorption calorimetry allows simultaneous measurements of water activity and partial molar enthalpy of mixing of water. The enthalpy data provide important information about isothermal phase transitions, glass transitions in a studied system, and driving forces of hydration. Enthalpy data obtained in sorption experiments can be more informative when considered together with nonisothermal data obtained by DSC. Since the DSC method is well-known and the interpretation of the DSC data is usually simpler, we will consider the DSC data first and then sorption calorimetric data will be discussed.
We have studied several samples of denatured lysozyme with different water contents. The results of three DSC experiments are shown in Figure 4. In each of the scans one can clearly see a step, which corresponds to a glass transition. The higher the water content the lower the glass transition temperature. The steps on the curves have different shapes, which can be explained by the fact that a glass transition, in general, is not an equilibrium transition, but depends on the conditions of the experiment and the thermal history of the sample. The curve corresponding to the sample with water content of 11.9 wt % contains more thermal events at higher temperatures, including an exothermic peak with a minimum at about 140°C. Unlike other samples, (prepared only for DSC experiments) this sample was collected from the sorption cell after a desorption calori-metric experiment. The different thermal/hydration history of the sample is one of the reasons for this peak, which is probably due to structural relaxation. Nonetheless, the glass transition is observed when the sample was prepared by dehydration as well as when it was prepared by hydration.
The DSC data show that the glass transition temperature is strongly dependent on water content, i.e., water acts as a plasticizer. The dry denatured lysozyme has a glass transition at 180°C, and the sample with 15.9 wt % of water has a glass transition at 15.4 °C. The glass transition temperature as a function of water content is presented in Figure 5 (the data obtained by sorption calorimetry are also included in the plot). As previously mentioned, the glass transition depends on the conditions of the experiment and on the thermal history of sample. Therefore, the points on the temperature-water content plot are rather scattered. The curve is drawn as a guide for the eye. One should also mention that the two samples which show glass transition temperatures that lie above the curve were prepared in a different way than the other samples. In the case of these two samples, the lysozyme was denatured in a closed
Figure 4. DSC scans of denatured lysozyme samples with three different water contents. The heat capacities do not represent absolute values. The curves corresponding to water contents 15.9 and 11.9 wt % were moved upward for illustrative purposes.
container at 150°C and when the container was opened, the lysozyme had a pronounced smell of H2S. The denatured lysozyme was then dried in a vacuum and H2S escaped. In the case of other samples (DSC data points below the curve) the denaturation was performed in hermetically sealed aluminum DSC cells, which have never been opened, and therefore, H2S could not escape. The fact that the samples that did not contain H2S have higher glass transition temperatures may be explained by a suggestion that H2S acts as a plasticizer.
The heat capacity change at the glass transition∆Cpdepends less strongly on composition (data not shown). The value of ∆Cpincreases by about 20% with the increase of the water content in the studied composition range. The mean value of ∆Cpmeasured in six experiments was 0.46 J/K/g (calculated per mass of protein - water mixture). This value is in agreement with the value 0.50 ( 0.10 J/K/g obtained by Tsereteli et al.6 (calculated per mass of dry protein).
The increase of ∆Cp with water content is caused by differences in the temperature dependences of the heat capacity below and above the glass transition. The temperature depen-dence of Cpof the protein in the glassy state is higher than that in the elastic state (see, for example, the lowest curve in Figure 4). When water is added to the system and the glass transition occurs at lower temperatures, Cpof the glassy state decreases more strongly than that of the elastic state; therefore, ∆Cp becomes larger.
Enthalpy of Mixing and Isothermal Glass Transition. Glass transitions can be studied not only by differential scanning calorimetry, but also by sorption calorimetry at a constant temperature.9,24In this case, the glass transition is characterized by the water content at which the glass transition takes place and the change of the partial molar enthalpy of mixing of water ∆Hwm (i.e., by the difference of the values of partial molar enthalpy of mixing of water Hwmin the elastic state and in the glassy state).24 ∆H
w
m of a glass transition is positive, which implies that in the beginning of sorption (at low water contents) Hwm is negative (exothermic), and after the transition it is usually positive. In contrast, in the case of crystalline materials, Hwmis usually highly endothermic in the beginning of sorption due to the dissolution of crystals.
In all the sorption calorimetric experiments with the denatured lysozyme, the initial regime of hydration was highly exothermic, which is consistent with the presence of the glassy noncrystalline state, while at the end of the hydration the enthalpy is
endothermic. The values of Hw m
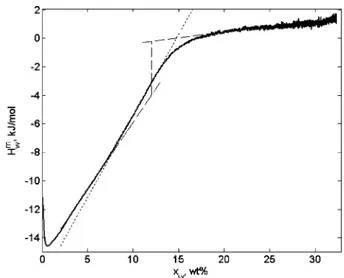
in the beginning of hydration depended on the temperature of the experiment and on the rate of water sorption. The most exothermic value of the partial molar enthalpy of mixing of water registered in the sorption experiments was about -18 kJ/mol of water at 25 °C in an experiment with the lysozyme mass 54.3 mg. In the experiment shown in Figure 6 the sample mass was lower and the sorption was faster, therefore, the most negative enthalpy value was only -14.5 kJ/mol. At higher water contents the enthalpy results are much less dependent on the rate of sorption. The difference in the values of enthalpy in the beginning of sorption arises from the slow kinetics of water sorption in the glassy state. Since in the glassy state the polypeptide chains are “frozen” in their positions, the diffusion of water molecules takes much longer than in the elastic state. Therefore, the states with the lowest free energy and enthalpy are not reached when the rate of sorption is high.
After the initially highly exothermic value, the partial molar enthalpy of mixing of water increases upon addition of water while the system is still in the glassy state. This could be compared with the behavior of alkyl maltosides,24 where H
w m had a plateau in the whole regime of the glassy state. The difference is obviously in the heterogeneity of the sorption sites of the protein, in contrast with the maltosides, where the only hydrophilic groups present are hydroxyls. When water is continuously added to the protein, less and less polar groups undergo hydration and the heat effect becomes less exothermic. The fact that Hwmhas a significant slope in the glassy region makes it difficult to quantitatively determine the thermodynamic properties of the glass transition (see Figure 6). Since Hwmhas a slope not only in the glassy region but also in the region of the transition from the glassy to elastic state, the exact point of the beginning of the glass transition (intercept of the dashed and the dotted lines in Figure 6) is very sensitive to the conditions of the experiment. The large slope of the Hwmin the glassy state also leads to a high uncertainty of the value of ∆Hwm. The typical values of∆Hwmdetermined in different experiments as shown in Figure 6 were in the range of 3-5 kJ/mol, while the difference between levels of Hwmat the end and in the begin-ning of the isothermal glass transition is much higher.
Figure 5. Glass transition temperature of the denatured lysozyme as a function of water content. Stars (/) denote DSC data, squares (9) denote sorption calorimetric data.
Figure 6. Partial molar enthalpy of mixing of water as a function of water content in the denatured lysozyme, obtained in the sorption experiment at 25°C. The dashed lines extrapolate the glassy state and the elastic state to the glass transition region. The vertical dashed line shows∆Hw
mat the glass transition. The dotted line approximates the
As we pointed out above, the activity of water in the mixture with denatured lysozyme increases with the increase of tem-perature and this is more pronounced at low water contents (Figure 2). The enthalpy data presented here explain this observation. Considering the dependence of the chemical potential of water on temperature, one can show that the activity of water depends on temperature according to the following equation:
Unlike the Clausius-Clapeyron equation, which deals with evaporation, eq 1 has a minus sign in its right-hand side, and therefore, the temperature dependence of the water activity has the opposite sign to the value of enthalpy. The difference arises from the fact that a mixing is an addition of a substance into system, while evaporation is a removal of a substance from the system. Combination of the enthalpy data presented in Figure 6 and eq 1 gives a straightforward explanation of the temperature dependence of the water activity. Highly negative enthalpy values give rise to a strong increase of the activity of water at low water contents. At high water contents, the partial molar enthalpy of mixing of water is close to zero, which results in weaker temperature dependence of water activity.
Influence of Hydration on the Thermal Stability of Proteins. Protein denaturation is a transition from the native to the denatured state. Knowing the hydration properties of the native and the denatured protein one can estimate the influence of the hydration on the stability of the protein. The hydration of the protein can be characterized by the free energy of hydration (i.e., the integral free energy of mixing with water), which can be calculated from the water activity:
where r is the water to protein mole ratio. The free energies of hydration of the native and the denatured proteins are as follows:
The processes of denaturation of the dry and the hydrated proteins (and the corresponding changes of the free energies) can be described as
Combining Eq 3-6 one can show that
From our sorption calorimetric results, it follows that the water activity in the denatured lysozyme is equal to or lower than in the native lysozyme (an exception is the native dehydrated lysozyme, which is probably in the metastable state). Then, according to eq 2, the free energy of hydration of the denatured lysozyme is lower than the free energy of hydration of the native lysozyme:
and, according to the eq 7,
The free energy change of the denaturation of hydrated lysozyme is lower than that of the dry lysozyme. In other words, hydration stabilizes the denatured form of the protein (with respect to the native form), dehydration stabilizes the protein’s native form. The value of Gm (natiVe)-Gm (denatured), calculated in the water content range from 0 to 40 wt %, is about 20 kJ/mol. Since the calculation of the difference of the free energies of hydration involves the integrations of water activities of the two forms of the protein in a wide range of compositions (eq 2), a large error can be introduced and the presented value should be considered as approximate.
An experimental manifestation of the stabilization of native forms of lysozyme upon dehydration is the increase of the temperature of denaturation of lysozyme upon decrease of the water content. This was observed in the first scans of the DSC experiments (the detailed DSC study of the dependence of the denaturation properties on the water content will be presented elsewhere) and is also known from literature.25
Conclusions
Description of the unfolding of proteins requires information on properties of both native and denatured proteins. We have performed a sorption calorimetric study of thermally denatured lysozyme and compared the results with the data on the native lysozyme obtained in our previous study. The main conclusions are as follows:
(I) The sorption behavior of lysozyme denatured at 90 °C and native lysozyme are very similar over the whole studied composition range, which is in agreement with the concept of the compact denatured state.
(II) The sorption isotherms of the native lysozyme and lysozyme denatured at 150°C are almost identical at low water contents (0-15 wt % at 25 °C). At higher water contents denatured (unfolded) lysozyme is more hydrophilic than the native lyophilized lysozyme due to availability of the sorption sites of the interior of the globule, which are hidden in the native protein.
(III) At moderate water contents (15-34 wt %) the native lysozyme obtained by dehydration of a protein solution is more hydrophilic than the denatured lysozyme due to exposure of the hydrophilic groups of the native protein to the solvent.
(IV) DSC data show the presence of a glass transition at 180 °C in the dry denatured protein and at lower temperatures in the protein-water mixtures.
(V) Initial sorption of water is highly exothermic due to immobilization of water molecules on the protein in the glassy state, while at higher water contents the sorption is slightly endothermic.
(VI) Hydration stabilizes the denatured form of lysozyme with respect to the native form.
Acknowledgment. The department of Physical Chemistry 1, Lund University is acknowledged for the use of the sorption calorimeter. We also like to thank Olle So¨derman, Gerd Olofsson, and Tommy Nylander for fruitful discussions. Malmo¨ University and the Knowledge Foundation (KK-stiftelsen) are thanked for financial support.
Note Added after ASAP Publication. This article was published ASAP on April 8, 2006. Eq 1 was corrected and the revised version was reposted on April 12, 2006.
∆Gden(hydrated) <∆Gden(dry) (9)
d ln aw
dT )
-Hwm
RT2 (1)
Gm) RT
∫
ln awdr (2)N(dry) + nH2O f N(hydrated) Gm(natiVe) (3) D(dry) + nH2O f D(hydrated) Gm(denatured) (4)
N(dry) f D(dry) ∆Gden(dry) (5)
N(hydrated) f D(hydrated) ∆Gden(hydrated) (6)
∆Gden(hydrated) )∆Gden(dry) +
Gm(denatured) - Gm(natiVe) (7)
References and Notes
(1) Shortle, D. FASEB J. 1996, 10, 27.
(2) Dill, K. A.; Shortle, D. Annu. ReV. Biochem. 1991, 60, 795. (3) Shortle, D. Curr. Opin. Struct. Biol. 1993, 3, 66.
(4) Shortle, D.; Ackerman, M. S. Science 2001, 293, 487.
(5) Denisov, V. P.; Jonsson, B. H.; Halle, B. Nat. Struct. Biol. 1999,
6, 253.
(6) Tsereteli, G. I.; Belopolskaya, T. V.; Grunina, N. A.; Vaveliouk, O. L. J. Therm. Anal. 2000, 62, 89.
(7) Sochava, I. V. Biophys. Chem. 1997, 69, 31.
(8) Yang, P. H.; Rupley, J. A. Biochemistry 1979, 18, 2654. (9) Kocherbitov, V.; Arnebrant, T.; Soderman, O. J. Phys. Chem. B
2004, 108, 19036.
(10) Smith, A. L.; Shirazi, H. M.; Mulligan, S. R. Biochim. Biophys.
Acta-Protein Struct. Mol. Enzym. 2002, 1594, 150.
(11) Gregory, R. B. Protein-solVent interactions; Marcel Dekker: New York, New York, 1995.
(12) Bull, H. B. J. Am. Chem. Soc. 1944, 66, 1499.
(13) Kumagai, H.; Seto, H.; Sakurai, H.; Ishii, K. Biosci. Biotech.
Biochem. 1997, 61, 1307.
(14) Benson, S. W.; Richardson, R. L. J. Am. Chem. Soc. 1955, 77, 2585.
(15) Wadso¨, L.; Markova, N. ReV. Sci. Instrum. 2002, 73, 2743. (16) Kocherbitov, V.; Wadso¨, L. Thermochim. Acta 2004, 411, 31. (17) Wadso¨, I.; Wadso¨, L. Thermochim. Acta 1996, 271, 179. (18) Kocherbitov, V. Thermochim. Acta 2004, 414, 43. (19) Kocherbiov, V. Thermochim. Acta 2004, 421, 105.
(20) Kajander, T.; Kahn, P. C.; Passila, S. H.; Cohen, D. C.; Lehtio, L.; Adolfsen, W.; Warwicker, J.; Schell, U.; Goldman, A. Structure 2000, 8, 1203.
(21) Griebenow, K.; Klibanov, A. M. Proc. Natl. Acad. Sci. U.S.A. 1995,
92, 10969.
(22) Costantino, H. R.; Griebenow, K.; Mishra, P.; Langer, R.; Klibanov, A. Biochim. Biophys. Acta-Protein Struct. Mol. Enzym. 1995, 1253, 69.
(23) Chang, J. Y.; Li, L. FEBS Lett. 2002, 511, 73.
(24) Kocherbitov, V.; So¨derman, O. Langmuir 2004, 20, 3056. (25) Bell, L. N.; Hageman, M. J.; Muraoka, L. M. J Pharm. Sci. 1995,