Southern Swedish Forest Research Centre
Natural regeneration after wind disturbance
Maaris Varrik
Master thesis • 30 credits
EUROFORESTERMaster Thesis no. 315 Alnarp 2019
Natural regeneration after wind disturbance
Maaris Varrik
Supervisor: Emma Holmström, SLU, Southern Swedish Forest Research Centre Assistant supervisor: Floortje Vodde, Estonian University of Life Sciences, Department of
Forest Biology
Examiner: Magnus Löf, SLU, Southern Swedish Forest Research Centre
Credits: 30 credits
Level: Advance level A2E
Course title: Master thesis in Forest Science
Course code: EX0941
Programme/education: Euroforester Master Program SM001 Course coordinating department: Southern Swedish Forest Research Centre
Place of publication: Alnarp
Year of publication: 2019
Cover picture: Andres Putting
Online publication: https://stud.epsilon.slu.se
Keywords: storm,gap,microsite,deadwood,RipleyK,wind disturbance
Swedish University of Agricultural Sciences Faculty of Forest Sciences
Preface
I would like to thank my supervisors Emma Hölmstrom and Floortje Vodde for their help and guidance during this master thesis. Also, I would like to thank Estonian University of Life Science for providing me with part of the data.
3
Abstract
Wind is one of the most common natural disturbances in boreal forests, creating gaps in the forest, which are important for natural regeneration- creating suitable light, space and nutrient availability. Common regeneration practice after a wind throw is soil scarification and planting but in forest set-asides it is not applicable in Estonia. These areas are left to naturally regenerate. In this study an in-depth spatial pattern research was made in Halliku plot 3 to investigate the effect of dead wood on regeneration. If microsite type affects species establishment was investigated using data from Eisma and Halliku and finally the relationship between regeneration density and gap size was investigated in three storm areas in Estonia: Halliku (4 plots), Tudu (4 plots) and Eisma (4 plots).
The results showed that deadwood affected regeneration - it showed clustered pattern, and the spatial distribution of regeneration was significantly different from normal distribution. Furthermore this study’s results showed statistically significant effect of microsite on species establishment. Microsite and species had a significant effect on seedlings density per m2. The analyse between gap size showed no statistically significant effect on regeneration density. Further studies with increased study areas and continous data collection are needed to inevestigate gap size influence on regeneration density.
4
Content
Abstract ... 3
1. Introduction ... 5
1.2 The aim of this study ... 7
2. Materials and methods ... 8
2. 1 Study sites ... 8
2.2 Field inventory ... 11
Eisma, Tudu and Halliku field inventory ... 11
Halliku plot 3 ... 12
2.3 Data analyses ... 13
The occurrence of deadwood affected regeneration establishment negatively ... 13
Microsite type affects species establishment ... 16
There is a correlation between regeneration density and gap size ... 17
3. Results ... 18
General results ... 18
The occurrence of deadwood affected regeneration establishment negatively ... 20
Microsite type affects species establishment ... 22
There is a correlation between regeneration density and gap size ... 24
4. Discussion ... 25
The occurrence of deadwood affected regeneration establishment negatively ... 25
Microsite type affects species establishment ... 26
There is a correlation between regeneration density and gap size ... 26
REFERENCES ... 28
5
1. Introduction
Climate change
We are living in the midst of man-made climate change, which is considered to be one of the biggest challenges now and in the coming decades, affecting many different areas of life and making us rethink our ways. Many agreements and protocols are signed to fight climate change like Kyoto Protocol (16 February 2005) and Paris Agreement (4 November 2016). Their purpose is to have structured efforts to legally take action against climate change and improve countries’ ability to deal with climate change together. Countries, who signed the Paris agreement committed themselves to limit emissions to keep the global warming below 2 degrees, but to do so immediate measures must be taken. One of the outcomes of climate change will be increasing frequency of storms and strong winds, which will cause destruction everywhere (Trenberth 2011). Furthermore causing financial harm to different areas and industries that people are dependent on and which provide them with food and income. Storm and forest damage
Wind is one of the most common natural disturbances in boreal forests but also in temperate forest Ulanova (2000), Schlyter et al. (2006) allowing the forest to renew itself and increase diversity. The increasing frequency and severity of the storms affect the stability of the forest industry. A good example is storm Gudrun, which hit the Baltic Sea regionin January 2005, causing damage in Denmark, Sweden and Estonia. The Swedish forest industry suffered greatly from the storm, as more than 75,000,000 cubic metres of wood was felled, overflowing the industry with wood and therefore lowering the wood prices (Skogsstyrelsen 2006). Depending on the size of the gap, nutrients, microsite, dead wood, distance to and existence of seed tree species, regeneration composition and density may vary greatly. In forest gaps occur in the canopy due to death of one tree or multiple trees Brokaw (1982); Zhu et al. (2014). That definition thus also includes gaps made by storms. Gaps are important for natural regeneration- creating suitable light, space and nutrient availability. Larger gaps have shown higher densities in seedlings (Bolton et al. 2011). Researchers have found that important factors for regeneration establishment have been microsite, different species have shown preference to different microsites (Huth et al. 2006) and research showed higher occurrence of pine seedlings on disturbed microsites than expected (Kuuluvainen et al. 2003). Dead wood benefits the regeneration most in more advanced decaying stages, when it is increasing soil nutrient
6
availability and has proved an important seedbed to trees (Lambert et al. 2016; Mori et al. 2004). Furthermore, deadwood has found to be an important factor against browsing, providing a physical barrier (Rammig et al. 2007). An important factor for regeneration is also the presence of seed trees, in case of bigger gaps the establishment of regeneration may be uneven. Regeneration
The severity of a storm is unpredictable: it depends on the characteristics of the storm and the area that it hits. The damage can vary from tree level to large scale areas and therefore the post-disturbance steps can vary from no management to large scale salvage logging and reestablishment of the area. Many issues must be considered when leaving forest to regenerate naturally after a storm. The first decision to be made is if the area must be cleared or not. In Northern-Europe common practice is to harvest trees in a damaged area and regenerate it with suitable tree species, mainly by planting. The main reasons for salvage logging can be owners desire to have some income from the area or decrease the possibility of insect outbreak due to deadwood (Helms, 1998). Furthermore, important reason is tradition-forest owners want to keep their forest clean and beautiful.
As an example, the Estonian State Forest Management Centre regenerated in 2017 a total of 9571.7 hectares of land, of which a total 7140.5 hectares were planted, 310.7 hectares were sowed and on 2120.5 hectares the State Forest Management Centre contributed to natural regeneration (Keskkonnaagentuur 2017). Mocalov et al. (2002) found in their research that recruitment is lower in old-growth forests after the storm damaged areas were left uncleared. Secondly, since light availability will increase after wind-throw and therefore provide suitable light conditions for pioneer species, more severe wind-throw will increase the percentage of pioneer species, but studies have shown that the pioneer species are more dominant only during the first stages of re-establishment of regeneration (Vodde et al. 2010; Tsvetanov et al. 2018). Storm damage will also create many different patterns and conditions favouring some species and hindering others. Regeneration patterns after storm disturbance can vary due to many factors: tree species, dead wood, soil properties. Some researchers have shown significant change in regeneration after a storm disturbance (Xi et al. 2008) but some found the pattern random (Allen et al. 2012). In Estonia few articles have been published about regeneration after storm damage (Metslaid et al. 2005; Vodde et al. 2010; Vodde et al. 2015). The reason could be the shortage of study areas: storm damaged areas are usually immediately harvested to avoid possible insect outbreak and/or forest owners wish to regenerate it as soon as possible.
7
1.2 The aim of this study
Research questions in general on storm gaps and natural regeneration:
In forest set-asides areas, such as national parks or key habitats, the traditional regeneration practice with soil scarification and planting, is not applicable in Estonia. When an unexpected disturbance occurs, the reforestation is solely done by natural regeneration. In this study the natural regeneration after storm gaps was investigated. The aim of this study is to investigate the disturbance severity influence on upcoming regeneration and whether light incidence after storm affects regeneration establishment. In a forest set-aside area nothing is cleaned or salvage logged so the dead wood is left in the storm damaged area, in this study we want to know if dead wood has an effect on upcoming regeneration. Furthermore, after the storm forest floor intact ground is disturbed and different microsites like mounds, pits and logs are present. The study attempts to evaluate whether different microsites have any effect on species establishment. This study was separated into two parts: an in-depth small scale spatial pattern research based on Halliku plot 3 and a larger scale research that compares 3 different study sites.
The hypotheses of my work were:
1. The occurrence of deadwood of low decay level affected regeneration establishment negatively.
2. Microsite type affects species establishment
8
2. Materials and methods
2. 1 Study sites
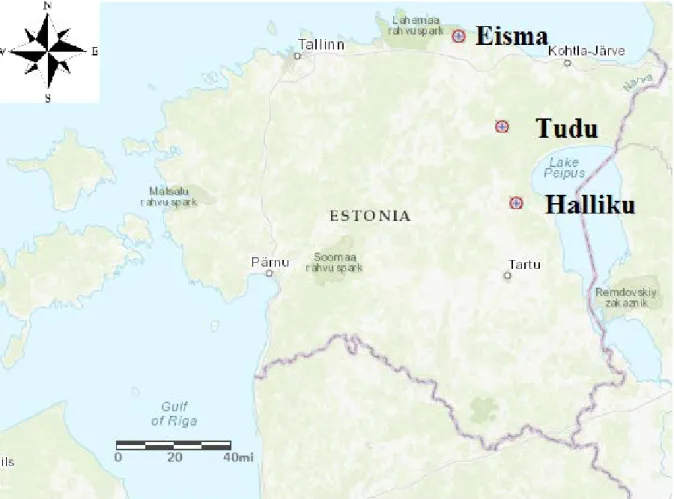
Fig 1. Study sites Eisma, Tudu and Halliku
The earliest storm used in this research occurred on former Tudu state forest district in Eastern Estonia (59°11′ N, 26°52′ E). One year after the area was hit by a storm in 2001, ten study plots were established inSuigu nature reserve, which has been unmanaged since its establishment in 1976 (Table 1). The storm damaged forest in three different former state forest districts: Tudu, Oandu and Paasvere. Approximately 15 000 m3 was harvested due to either heavily damaged or wind-felled trees and therefore removed (Paide 2011). The Filipendula and Myrtillus forest site types are most commonly represented in the area, what indicates gley and podzolic soils (Lõhmus 2004). Before the storm the dominant tree species in the area was spruce (Picea abies) mixed with European aspen (Populus tremula), black alder (Alnus glutinosa), and silver birch (Betula pendula).
9
The next big storm occurred almost one year later in July 2002 and covered two former state forest districts Halliku and Paasvere in Eastern Estonia (area of state forest affected ~ 4570 ha), which now are part of an enlarged forest district Jõgevamaa ('Tormimurrus käib töö ööpäevaringselt' 2002). Eight study plots were established in former Halliku forest District (58°43′ N, 26°55′ E). Agreements were made after the storm to preserve several areas from salvage logging and some sites were already under protection as woodland key habitats. Tudu like Halliku is mainly represented by Filipendula and Myrtillus forest site types mainly dominated by spruce before the storm.
The most recent storm which damaged an area used in this research occurred in August 2011. Study plots were established in the vicinity of Eisma village (59°33′N, 26°17′E) in North-Estonia. Two plots were located on private land and two on state forest land, agreements were made to preserve these areas for science. The area is situated on gley and podzolic soils, Myrtillus, Oxalis-Myrtillus and Filipendula forest site types are represented mainly in the area (Lõhmus 2004). The area was dominated mainly by Scots pine (Pinus sylvestris). Norway spruce, black alder, silver birch, European aspen and common alder (Alnus incana) were also present in the area.
The gap sizes affecting the established plots ranged between <10000 to 50000 m2 (Table 1). The land use surrounding the plots varied, in some areas the surrounding land was forest, but in other areas surroundings were heavily salvage logged. Creating increased light availability and decreasing seed sources to the area. Table 2 introduces what tests on which sites and plots are investigated in this research. The first part of this study concentrates on Halliku plot 3 and the second part on all tree storm damaged areas.
10
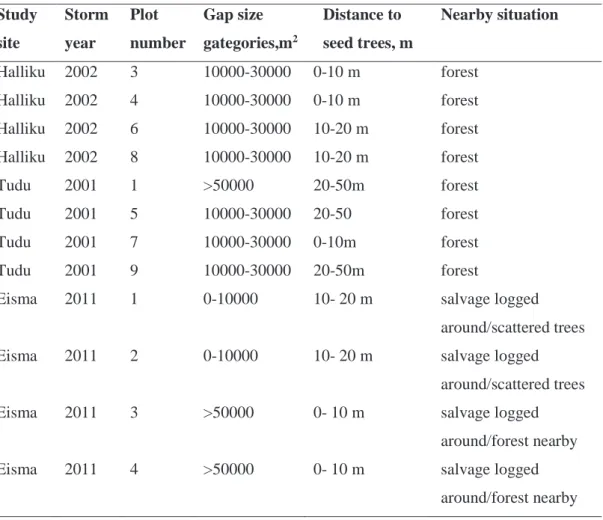
Table 1. Established study sites and plots with additional information about, gap size affecting the established plots, distance to seed trees and nearby situation
Study site Storm year Plot number Gap size gategories,m2 Distance to seed trees, m Nearby situation Halliku 2002 3 10000-30000 0-10 m forest Halliku 2002 4 10000-30000 0-10 m forest Halliku 2002 6 10000-30000 10-20 m forest Halliku 2002 8 10000-30000 10-20 m forest Tudu 2001 1 >50000 20-50m forest Tudu 2001 5 10000-30000 20-50 forest Tudu 2001 7 10000-30000 0-10m forest Tudu 2001 9 10000-30000 20-50m forest
Eisma 2011 1 0-10000 10- 20 m salvage logged around/scattered trees Eisma 2011 2 0-10000 10- 20 m salvage logged
around/scattered trees Eisma 2011 3 >50000 0- 10 m salvage logged
around/forest nearby Eisma 2011 4 >50000 0- 10 m salvage logged
11
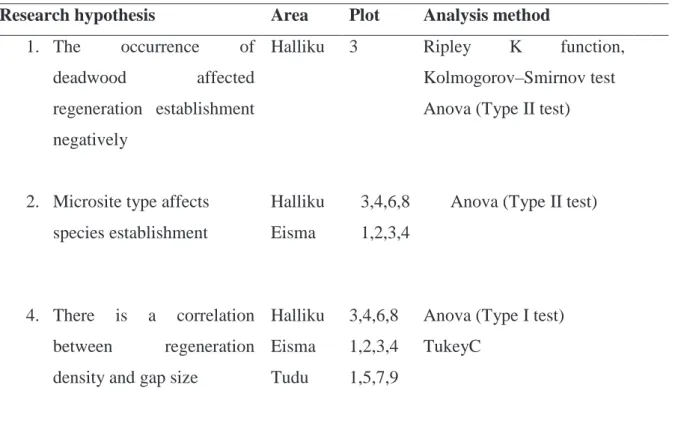
Table 2. Research analysis method based on data and hypotheses used
Research hypothesis Area Plot Analysis method
1. The occurrence of deadwood affected regeneration establishment
negatively
2. Microsite type affects species establishment
Halliku 3 Ripley K function,
Kolmogorov–Smirnov test Anova (Type II test)
Halliku 3,4,6,8 Anova (Type II test) Eisma 1,2,3,4
4. There is a correlation between regeneration density and gap size
Halliku 3,4,6,8 Anova (Type I test) TukeyC
Eisma 1,2,3,4
Tudu 1,5,7,9
2.2 Field inventory
Eisma, Tudu and Halliku field inventory
Four types of study plots were established in Tudu and Halliku in 2002, 2003, respectively: heavily damaged (all trees fallen; 4 plots), moderately damaged (approximately half of the trees storm-felled; 5 plots), harvested (trees storm-felled and salvage logged; 5 plots) and control (undamaged stands; 4 plots) (Ilisson et al. 2005). In 2011 four plots in Eisma were added to the research: three heavily damaged and one moderately damaged.
All the plots were 20×40 m and established randomly along transects. For monitoring regeneration on intact ground ten 1 × 1 m squares were placed on every 4 meters along the 40 m plot middle line. If logs or pit-and-mounds occurred, squares were moved to the opposite side of the middle line to avoid them. In 2005 to increase the area of intact ground, on which regeneration is monitored, 2 × 2 m squares were also established in the corners of the plot. The species, height, physical damage, mortality, microsite substrate and position were collected
12
from living regeneration. In all three storm damaged research areas a total of 12 plots (7 heavily damaged and 5 moderately damaged) are currently active and being measured. All measurements were repeated annually during summer 2004 to 2018 in heavily and moderately damaged plots, except for the years 2008 and 2011. Since 2013 all regeneration is measured in four 5x5m sub-plots which also include intact vegetated ground. Control plots were inventoried in 2004 and 2009, the inventory stopped due to tree falling. Harvested plots have been inventoried irregularly from 2004 to 2007 and in 2009. Field work was carried out by staff of Silviculture and Forest Ecology chair of Estonian University of Life sciences.
Halliku plot 3
Data for spatial analyses of regeneration was collected between June and August 2018 in Halliku district, Jõgeva County, Estonia, 16 years after the storm (Fig 2). A 20 × 40 m already established plot was used to collect data, the plot was divided to smaller subplots (Fig 2). During the field inventory, measurements of heights and tree positions were collected from trees higher than 1 m. Trees higher than 1.3 m were calipered at 1.3 m height to register diameter at breast height (dbh). All trees originating from the same root were considered as one tree with multiple stems and heights were only measured from the highest stem, but all stems higher than 1 m were calipered. All height measurements were taken with Vertex III, diameter at breast height was measured with caliper rule and all the information was collected into a tablet.
13
Height, species and location were registered of trees outside the plot in four zones. Zone 1: 0-1m all trees with height > 2 m
Zone 2: 1-3m all trees with height > 4 m Zone 3: 3-5m all trees with height > 8m
Zone 4: >5m all trees > 12 m, Distance < Tree Height
Fig 2. The experimental plot design
2.3 Data analyses
The occurrence of deadwood affected regeneration establishment negatively
For the statistical analysis of spatial point patterns in Halliku plot 3, The spatstat (Baddeley et
al. 2015) package was used in R-Studio (Foundation 2019). To get an accurate estimate of the
DBH for multi-stemmed trees and use it for analyses, DBH is calculated with the following equation:
𝐷𝐷𝐷𝐷𝐷𝐷 = (𝑑𝑑𝑑𝑑ℎ12+ 𝑑𝑑𝑑𝑑ℎ22 + ⋯ 𝑑𝑑𝑑𝑑ℎ𝑖𝑖2)0.5
DBH-estimated total diameter at breast for multi-stemmed trees, cm dbh1, dbh2... – diameter at breast height of stem 1, stem 2… stem i, cm
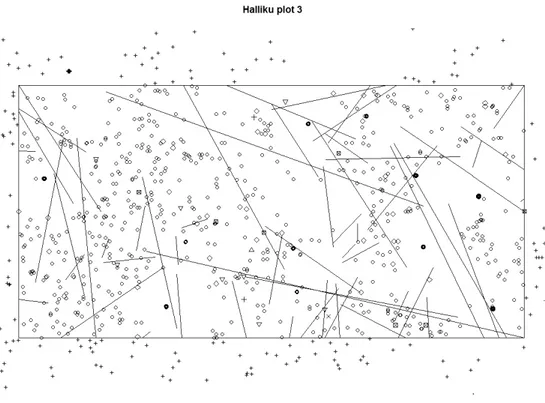
Halliku plot 3 was visualized based on coordinates of all trees snags, stumps and lying wood creating a life true figure of the situation in the plot (Fig 3).
14
Fig 3. Visualisation of tree species distribution in Halliku plot 3. Open circles represent regeneration, diamonds snags/stumps, plus symbols regeneration outside the plot and lines lying dead wood
Height and diameter labelled point patterns were created to get better visual estimation on size distribution.
Ripley K function
Ripley’s K (r) function (Ripley 1977, 1979) was used to analyse spatial patterning of regeneration after a storm damage. The function helps to assess spatial structure at different distance intervals, it detects clustering at smaller distances and exclusion at longer distances (Fajardo et al. 2006). The function counts number of neighbouring regeneration for each seedling in given distance. The number of observed neighbouring regeneration is compared to a number of randomly distributed regeneration and if it is greater, then the observed distribution is clustered, whereas if it is less than the observed distribution is dispersed.
15
The K (r) is formally defined as follows:
𝐾𝐾(𝑟𝑟) = 1𝑛𝑛 �∗ 𝑛𝑛 𝑖𝑖=1 𝑁𝑁𝑝𝑝1(𝑟𝑟)/𝛼𝛼 N – Number of trees r – Distance, m α – Area, m2
p
i – the location of the selected seedlingThe Ripley’s K function was transformed into the function L (r) to better visualize the results.
The L (r) is formally defined as follows:
𝐿𝐿 (𝑟𝑟) = �𝐾𝐾(𝑟𝑟)𝜋𝜋 K(r) – Ripley K (r) function
r – Distance, m
The K-function L (r) was generated from K (r) then used to analyse the significance in spatial patterning, correcting edge effects with isotropic correction. The 95% confidence envelope was formed by Monte Carlo permutations.
Regeneration is mapped using their X, Y coordinates from the 0, 0 point of the study design middle line (Fig 2). If observed values are higher than zero line then the distribution is aggregated. The function was used on all seedlings and birch and black alder seedlings separately.
16
Kolmogorov–Smirnov test
Kolmogorov–Smirnov test was used to test hypothesis number 1, if dead wood affects the emergence of regeneration negatively (Berman 1986). For testing, distance maps were created of lying dead wood and stumps/snags with the R package spatstat (Baddeley et al. 2015) (Fig 8) and then tested with regeneration. The test compares observed and predicted distributions of the values of a spatial covariate, meaning that if the observed distribution, in this case the seedlings, is following normal distribution or dead wood is presence is affecting the normal distribution.
If the p-value ≤ 0.05 then the result shows strong evidence that variables don’t follow normal distribution.
𝐷𝐷𝑛𝑛 = 𝑆𝑆𝑆𝑆𝑆𝑆𝑡𝑡 | 𝐹𝐹�1(𝑡𝑡) − 𝐹𝐹�2(𝑡𝑡)|
F1 – The cumulative Distribution Function of the hypothesized distribution F2 – The empirical distribution function of observed data
t – Observed data
Microsite type affects species establishment
Microsites were classified into three categories: pit, mound and intact ground. Pits occurred after a tree was wind-felled, where the root system and attached soil were dislocated. Mounds are formed of the upright standing root system after a tree is wind-felled. Intact ground was defined as undisturbed soil with intact field vegetation and no bare mineral soil.
In-depth example of the species distribution and possible reason behind their location was made based on Halliku plot 3 data. To increase the credibility of the Anova (Type II test) in this
17
analyse the most recent data from study sites from Halliku (3, 4, 6, 8) and Eisma (1, 2, 3, 4) was used to analyse if microsite type affects species establishment. The area for every pit, mound and intact ground area was calculated for study sites Eisma and Halliku. The eventual effect on regeneration density of microsite was tested with an Anova (Type II test), the test was done to analyse the four most prevalent species seedling per microsite area; - birch, black alder, rowan and Norway spruce.
There is a correlation between regeneration density and gap size
Orthophotos from 2005, 2007, 2011, and 2019 were used to estimate the gap size created by the wind in Tudu, Halliku and Eisma (Maa-amet 2019). Measurements were taken using Estonian Land Board Geoportal and put into four categories to have a better estimate of the size of the damage.
Gap size categories: 0-10000 m2
10000 m2-30000 m2 30000 m2 -50000 m2 50000 m2<
From the centre of every study plot measurements were taken to the closest seed trees (canopy tree) to estimate the possibility of seed dispersal. Distances were also put into four categories; 0-10 m, 10-20 m, 20-50 m and more than 50 m from seed tree to plot centre (Appendix 1) Tree densities of each active plot were calculated for Halliku, Tudu and Eisma to analyse the sapling density and the gap size. Microsite is important substrate for tree seedlings and amount of different regeneration vary in different microsites. To get the most accurate density, calculations were made to compare densities based on mound, pit and intact ground area separately and based on variance and Standard deviation (SD) of seedling/m2the most accurate density per ha was chosen to test the correlation between density and gap size. Furthermore seedling density and gap size correlation was analysed using Anova (Type I test) and TukeyC to see which gap size is significantly different from each other.
18
3. Results
General results
Average total densities per plot in Eisma were 23718 ha-1 (plot 1) 17716 ha-1 (plot 2) 7599 ha-1 (plot 3) 1333 ha-1 (plot 4). The most common species in Eisma study plots were rowan, birch and spruce. The average total densities per plot were in Tudu were 3800 ha-1 (plot 1) 16702 ha-1 (plot 5) 7364 ha-1 (plot 7) 13262 ha-1 (plot 9). The most common species in Tudu study plots were also rowan, birch and spruce.
Findings from the detailed inventory in Halliku, plot 3. Based on detailed inventory the total density in Halliku plot 3 was 12962 ha-1 and the following species found where Black alder (Alnus glutinosa) (2612,5 seedlings ha-1), grey alder (Alnus incana) (175 seedlings ha-1), maple (Acer platanoides) (37,5 seedlings ha-1), birch (Betula pendula) (2962,5 seedlings ha-1), hazel (Corylus avelana) (337,5 seedlings ha-1), buckthorn (Frangula alnus) (900 seedlings ha-1), ash (Fraxinus excelsior) (900 seedlings ha-1), fly honeysuckle (Lonicera xylosteum) (12,5 seedlings ha-1), spruce (Picea abies) (2150 seedlings ha-1), aspen (Populus tremula) (12,5 seedlings ha -1), oak (Quercus robur) (12,5 seedlings ha-1), willow (Salix spp.) (212,5 seedlings ha-1), rowan (Sorbus accuparia) (2300 seedlings ha-1), elm (Ulmus glabra) (287,5 seedlings ha-1).
Visualization based on tree diameter was done to see the diameter distribution in plot 3 (Fig 4). Bigger proportion of trees were smaller than 20 cm at breast height, a few bigger trees standing before the wind disturbance had bigger diameters.
19
Fig 4. Visualisation of tree diameter (in cm) in Halliku plot 3
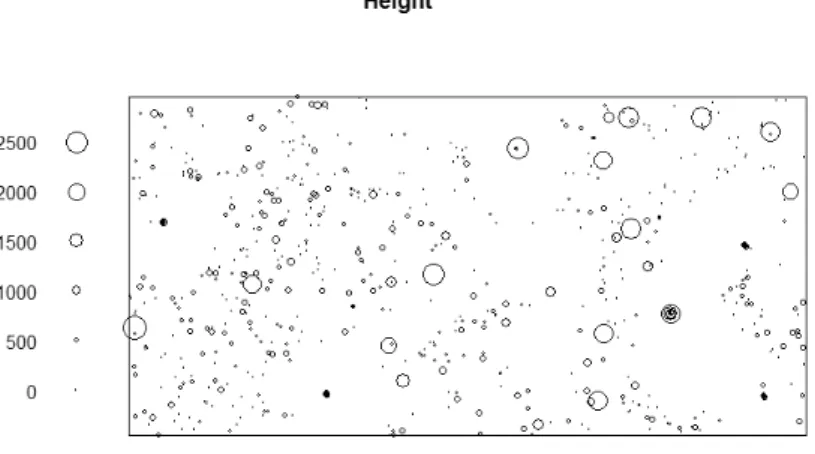
Visualization based on tree height was also done to see height distribution in plot 3 (Fig 5). Bigger proportion of trees were smaller than 15 meters and like previous graph, the higher trees standing in the plot are before wind disturbance.
20
The occurrence of deadwood affected regeneration establishment negatively
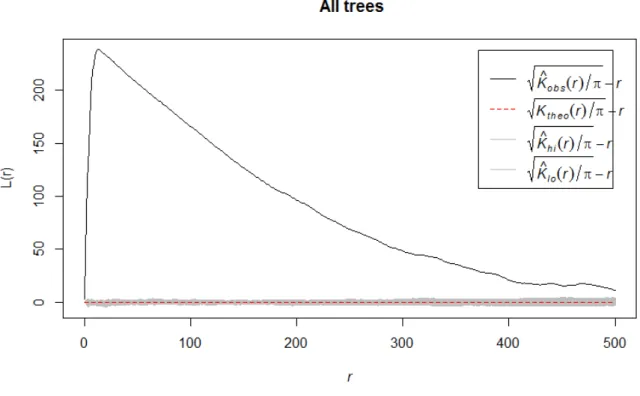
Regeneration showed a clustered pattern, where the spatial distribution of regeneration was significantly different from a normal distribution (Fig 6).
Fig 6. Regeneration pattern in Halliku plot 3, where r shows the distance from regeneration (in cm)
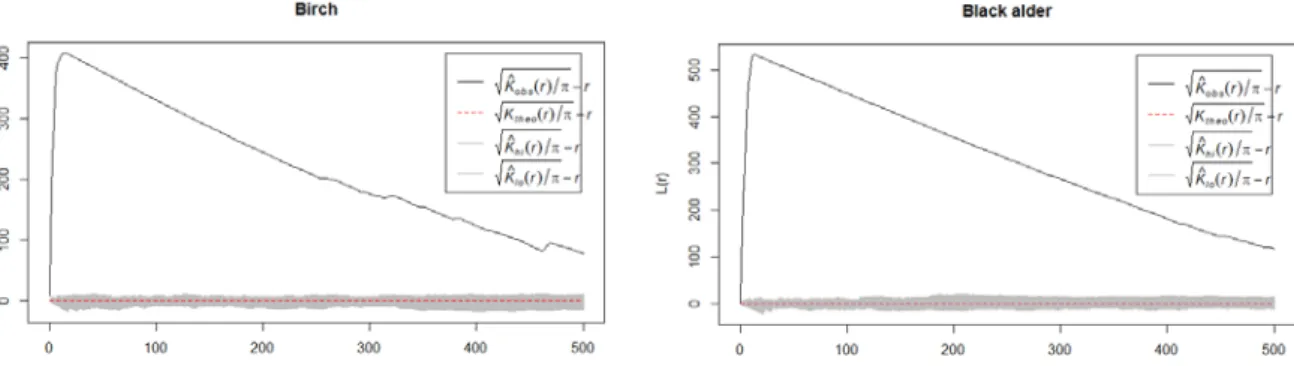
Supporting graphs were made of birch and black alder which were most represented among in the plot. The function for them also confirms, that there is clustering inside the plot (Fig 7).
21
Fig 7. Regeneration pattern of birch and black alder in Halliku plot 3, where r shows the distance from regeneration (in cm)
Fig 8. Distance maps (in cm) of lying dead wood and stumps/snags
The Kolmogorov–Smirnov test showed strong evidence that regeneration does not follow normal distribution. Visually, while looking at the graphs, even the shape of the CWD is visible, so that there is a strong indication that deadwood affects the establishment of regeneration, at least physically by its presence, at this, still, relatively early stage since disturbance. The p-value for the analyses with lying dead wood was 2.458e-06 and the p-value for the analyses of snags and stumps was 2.2e-16.
22
Microsite type affects species establishment
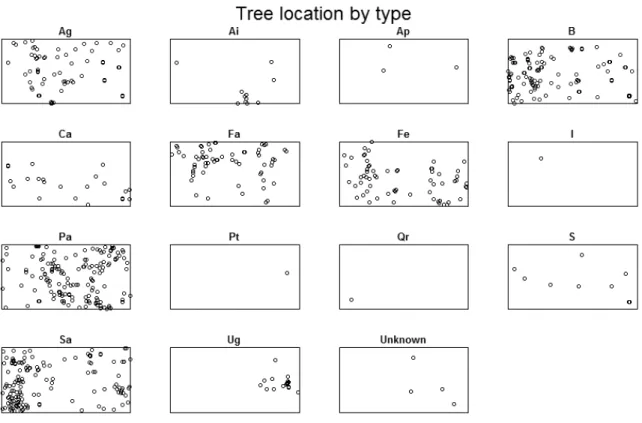
The visualization of tree location by species shows that Norway spruce and rowan are distributed the most evenly on the Halliku plot 3, although rowan shows clustering in one spot (Fig 9). Other species seem to be randomly distributed or were too little to make a clear assumption.
Fig 9. Tree location by species in Halliku plot 3, where Ag is black alder, Ai- grey alder, Ap- Norway maple, B-birch, Ca-hazel, Fa-buckthorn, Fe-ash, I-fly honeysuckle, Pa-spruce, Pt- aspen, Qr-oak, S-willow, Sa-rowan. Ug-elm
The dominant microsite in plot 3 was intact ground, which was 82% of the total plot area. Pits covered 12% and mounds and logs both respectively 3% each (Table 3).
23
Table 3. Estimated area and percentage of each microsite in Halliku plot 3.
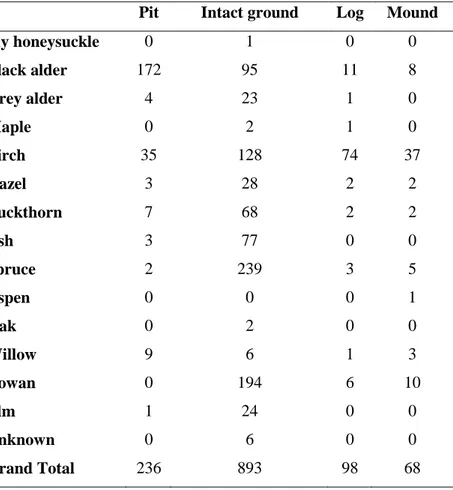
The frequency of species occurrence with microsites indicated a possible correlation of black alder with pits and spruce with intact ground in Halliku plot 3 (Table 4).
Table 4. Species per microsite in Halliku plot 3
Pit Intact ground Log Mound
Fly honeysuckle 0 1 0 0 Black alder 172 95 11 8 Grey alder 4 23 1 0 Maple 0 2 1 0 Birch 35 128 74 37 Hazel 3 28 2 2 Buckthorn 7 68 2 2 Ash 3 77 0 0 Spruce 2 239 3 5 Aspen 0 0 0 1 Oak 0 2 0 0 Willow 9 6 1 3 Rowan 0 194 6 10 Elm 1 24 0 0 Unknown 0 6 0 0 Grand Total 236 893 98 68
The Anova (Type II test) confirmed that microsite type affects species establishment. The model used seedlings/m2~microsite+species showed significance between seedlings/m2
Area, m2 Percentage, % Pits 96.00 12.00 Mounds 23.87 3.00 Logs 20.87 3.00 Intact ground 659.48 82.00 Total area 800.00 100.00
24
species and microsite (mounds, pits, intact ground) in Halliku plot 3, 4, 6, 8 and Eisma plots 1, 2, 3, 4.
There is a correlation between regeneration density and gap size
Table 5 shows densities calculated for each storm area per plot and per microsite. In all but three cases seedlings/m2 based on intact ground showed the smallest variance and standard deviation. Seedling/m2 in mounds had significantly bigger variance than pits and intact ground showing what an extreme substrate it is for seedlings. Therefore density to test the correlation between gap size and seedling density was chosen based on variance and SD.
Table 5. Average, variance and standard deviation of seedlings/m2 and density per hectare for all active plots in Eisma, Halliku and Tudu
District Plot. Number Microsite Total seedlings # Sampled area % Total area % Average seedling/m2
Variance Stdev Density per ha
Eisma Plot 1 Mound 134 4,66 4,99 3,78 8,71 2,95 37750,22
Eisma Pit 92 5,09 7,36 2,24 2,14 2,24 22426,49
Eisma Intact 193 10,25 87,65 2,37 0,42 2,37 23718,66
Eisma Plot 2 Mound 72 4,01 5,82 2,98 10,41 3,23 29847,23
Eisma Pit 136 8,11 9,18 1,80 2,53 1,59 18032,53
Eisma Intact 22 11,31 85,00 1,77 0,61 0,78 17716,03
Eisma Plot 3 Mound 87 1,27 2,52 6,98 17,44 4,18 69771,61
Eisma Pit 35 8,11 14,59 1,69 6,58 2,57 16899,98
Eisma Intact 55 8,97 82,89 0,76 0,29 0,54 7599,56
Eisma Plot 4 Mound 19 0,46 1,05 10,17 110,59 10,52 101653,48
Eisma Pit 48 4,83 9,42 1,52 1,52 1,52 15234,77
Eisma Intact 10 9,38 89,53 0,13 0,00 0,04 1333,33
Halliku Plot 3 Mound 57 1,94 2,97275 5,50 56,05 7,49 55011,69
Halliku Pit 214 11,28 11,98 2,67 8,02 2,83 26703,85
Halliku Intact 117 11,18 85,04 1,33 0,01 0,10 13333,33
Halliku Plot 4 Mound 36 1,75 1,75 2,75 2,75 2,75 27455,87
Halliku Pit 19 3,82 5,26 0,63 0,03 0,18 6288,95
Halliku Intact 143 11,49 93,00 1,57 0,34 0,58 15688,36
Halliku Plot 6 Mound 14 1,24 2,32 1,28 0,45 0,67 12807,59
Halliku Pit 32 6,60 7,50 0,65 0,90 0,95 6451,00
Halliku Intact 62 12,24 90,19 0,62 0,01 0,07 6200,00
Halliku Plot 8 Mound 43 2,60 3,21 3,01 17,45 4,18 30087,01
Halliku Pit 55 9,65 10,39 0,63 0,40 0,63 6330,47
25
In the model used to analyse gap size and density data, the independent value of gap size showed not to be important. Gap size had no statistically significant effect on regeneration density (p = 0.93). Furthermore the same model showed that there is no significant difference between gap sizes.
4. Discussion
The occurrence of deadwood affected regeneration establishment negatively
The regeneration showed clustered pattern and the spatial distribution of regeneration was significantly different from a normal distribution. While looking at the results we could conclude that there is a strong indication that deadwood affects the establishment of regeneration, at least physically by its presence, at this, still, relatively early stage since disturbance. Research made in eastern-Finland found that seedlings clustered strongly in wind disturbed gap, specifically in disturbed microsites like mounds and pits (Kuuluvainen 1998). Similar result has been showed in (Harmon et al.1989) study, where they found that mechanical fragmentation of deadwood may result in high seedling mortality. Also Orman et al. (2016) found in their study that deadwood diameter had negative effect on regeneration densities, Bace et al. (2012) concluded that bigger diameters of deadwood can increase the competition between regeneration, which results in lower densities. In storm damaged areas that are not salvage-logged, amounts of deadwood are higher than in average forest and therefore the competition in regeneration is increased and that can be reason of the clustering.
Tudu Plot 1 Mound 37 4,28 7,22 1,31 1,23 1,11 13108,97
Tudu Pit 43 12,04 14,05 0,52 0,11 0,33 5205,37
Tudu Intact 38 12,50 78,74 0,38 0,03 0,18 3800
Tudu Plot 5 Mound 54 5,07 8,89 1,47 1,01 1,01 14730,40
Tudu Pit 164 17,25 21,09 1,58 2,91 1,71 15788,13
Tudu Intact 90 7,75 70,03 1,67 0,54 0,54 16702,79
Tudu Plot 7 Mound 75 2,69 1,73 8,86 63,07 7,94 88636,28
Tudu Pit 48 8,79 4,65 0,74 0,12 0,35 7364,03
Tudu Intact 95 12,30 93,62 0,96 0,27 0,52 9598,95
Tudu Plot 9 Mound 102 5,31 5,48 26,54 6352,30 79,70 265353,77
Tudu Pit 65 21,19 8,00 10,60 310,94 17,63 105954,59
26
However, many articles show that deadwood starts affecting regeneration positively in more advanced stages of decay. Zielonka (2006) showed that the highest regeneration establishment on deadwood occurs 30-60 years after tree death. In a forest managers point a view, this can be used to leave more deadwood into the forest to improve the regeneration (Muller and Butler,
2010). Therefore the situation in our study site may also change in couple of decades.
Furthermore dead wood provides habitat to many different species and thus it is an important
substrate for biodiversity (Jonsson et al. 2005) and habitat for many different species (Harmon
et al. 1986). Another example is a publication by (Bruelheide 2010) where they conclude that after wind throw resources like light (gaps) and dead wood (nutrients, stable but empty place to establish on) are often decoupled: they are not available at the same time, unless a new gap is formed by the time the dead wood is sufficiently decayed and thus ’ready’.
Microsite type affects species establishment
The results of this study show a statistically significant effect of microsite on species establishment. The model used in this study showed significance between seedling density per m2 and microsite (mounds, pits, intact ground) and Species, indicating that disturbed microsites are important to seedling establishment. Vodde et al. (2010) found in their study that microsite has an effect on species establishment, birch seedlings preferred spruce pits and mounds as a substrate and spruce seedlings preferred spruce pits and aspen mounds. The significance of microsites created by windthrow disturbance to spruce seedlings was also found in Kuuluvainen (1998) study, where spruce was found predominantly in mounds and pits but also in logs.
There is a correlation between regeneration density and gap size
The final hypothesis of my work was to find out if gap size has an effect on regeneration density. The results of this study showed no statistically significant effect of gap size on regeneration density. Furthermore gaps between 0-10000 m2, 10000-30000 m2 and >50000m2 showed no statistical difference between each other. One reason could be the lack of variability in the data-set (12 stands affected by storm gaps) due to not having bigger amount suitable study sites available. But Bolton et al. (2011) found in their study that seedling and sapling densities increased in bigger gap size classes. However, their study had 46 gaps sized from 0– 0.02 to >0.04 ha, compared to 12 gaps presented in this study (1 to >5 ha gaps).
27
In conclusion, this study showed that after wind disturbance many factors influence the upcoming regeneration in the damaged area. Microsite and deadwood had a significant effect on regeneration establishment. Further studies with bigger data-sets are needed to determine the influence of gap size on regeneration establishment.
28
REFERENCES
Allen, M. S., V. Thapa, J. R. Arevalo, and M. W. Palmer. 2012. 'Windstorm damage and forest recovery: accelerated succession, stand structure, and spatial pattern over 25 years in two Minnesota forests', Plant Ecology, 213: 1833-42.
Anon. 2002.'Tormimurrus käib töö ööpäevaringselt'. Metsamees, pp. 8.
Bace, R., M. Svoboda, V. Pouska, P. Janda, and J. Cervenka. 2012. 'Natural regeneration in Central-European subalpine spruce forests: Which logs are suitable for seedling recruitment?', Forest Ecology and Management, 266: 254-62.
Baddeley, A., E. Rubak, and R. Turner. 2015. Spatial Point Patterns: Methodology and Applications with R. London: Chapman and Hall/CRC Press, Publisher.
Berman, M. . 1986. 'Testing for spatial association between a point process and another stochastic process. ', Applied Statistics, 35: 54–62.
Bolton, N. W., and A. W. D'Amato. 2011. 'Regeneration responses to gap size and coarse woody debris within natural disturbance-based silvicultural systems in northeastern Minnesota, USA', Forest Ecology and Management, 262: 1215-22.
Brokaw, N. V. L. 1982. 'The Definition of Treefall Gap and Its Effect on Measures of Forest Dynamics', Biotropica, 14: 158-60.
Bruelheide, Kathke 2010. 'Gap dynamics in a near-natural spruce forest at Mt. Brocken, Germany', Forest Ecology and Management: 624-32.
Fajardo, A., J. M. Goodburn, and J. Graham. 2006. 'Spatial patterns of regeneration in managed uneven-aged ponderosa pine Douglas-fir forests of Western Montana, USA', Forest Ecology and Management, 223: 255-66.
Harmon, M. E., and J. F. Franklin. 1989. 'Tree Seedlings on Logs in Picea-Tsuga Forests of Oregon and Washington', Ecology, 70: 48-59.
Harmon, M. E., J. F. Franklin, F. J. Swanson, P. Sollins, S. V. Gregory, J. D. Lattin, N. H. Anderson, S. P. Cline, N. G. Aumen, J. R. Sedell, G. W. Lienkaemper, K. Cromack, and K. W. Cummins. 1986. 'Ecology of Coarse Woody Debris in Temperate Ecosystems', Advances in Ecological Research, 15: 133-302.
Helms J.A. "The Dictionary of Forestry". Society of American Foresters, Bethesda, Maryland (1998)
Huth, F., and S. Wagner. 2006. 'Gap structure and establishment of Silver birch regeneration (Betula pendula Roth.) in Norway spruce stands (Picea abies L. Karst.)', Forest Ecology and Management, 229: 314-24.
Ilisson, T., M. Metslaid, F. Vodde, K. Jogiste, and M. Kurm. 2005. 'Storm disturbance in forest ecosystems in Estonia', Scandinavian Journal of Forest Research, 20: 88-93.
Jonsson, B. G., N. Kruys, and T. Ranius. 2005. 'Ecology of species living on dead wood - Lessons for dead wood management', Silva Fennica, 39: 289-309.
Tetlov, E., Raudsaar, M. 2017. 'Metsauuendamine.' In: Siimon, K., Raudsaar,M.,Valgepea,M. Aastaraamat "Mets 2017". Keskkonnaagentuur. Tallinn, 4-13
Kuuluvainen, T., Juntunen,P. 1998. 'Seedling establishment in relation to microhabitat variation in a windthrow gap in a boreal Pinus sylvestris forest. ', J Veg Sci, 9: 551–62. Kuuluvainen, T., and R. Kalmari. 2003. 'Regeneration microsites of Picea abies seedlings in a windthrow area of a boreal old-growth forest in southern Finland', Annales Botanici Fennici, 40: 401-13.
Lambert, J. B., A. Ameztegui, S. Delagrange, and C. Messier. 2016. 'Birch and conifer deadwood favour early establishment and shade tolerance in yellow birch juveniles
29
growing in sugar maple dominated stands', Canadian Journal of Forest Research, 46: 114-21.
Lõhmus, E., 2004. Eesti metsakasvukohatüübid (Estonian Forest Site Types). Eesti Loodusfoto,Tartu. 80 pp.
Maaamet. 2019. Halliku,Tudu and Eisma districts in Estonia. 58°43′ N, 26°55′ E , 59°11′ N, 26°52′E, 59°33′N, 26°17′E,
[https://xgis.maaamet.ee/maps/XGis?app_id=UU82A&user_id=at&LANG=1&WIDT H=1620&HEIGHT=937&zlevel=0,552500,6505000 ]March 3, 2019.
Metslaid, M., T. Ilisson, E. Nikinmaa, J. Kusmin, and K. Jogiste. 2005. 'Recovery of advance regeneration after disturbances: Acclimation of needle characteristics in Picea abies', Scandinavian Journal of Forest Research, 20: 112-21.
Mocalov, S., and R. Lässig. 2002. 'Development of two boreal forests after large-scale windthrow in the Central Urals', Forest snow and Landscape Research journal, 77,171-186.
Mori, A., E. Mizumachi, T. Osono, and Y. Doi. 2004. 'Substrate-associated seedling recruitment and establishment of major conifer species in an old-growth subalpine forest in central Japan', Forest Ecology and Management, 196: 287-97.
Muller, J., Butler, R., 2010. A review of habitat thresholds for dead wood: a baseline for management recommendations in European forests. Eur. J. For. Res. 129: 981–992. Orman, O., M. Adamus, and J. Szewczyk. 2016. 'Regeneration processes on coarse woody
debris in mixed forests: do tree germinants and seedlings have species-specific responses when grown on coarse woody debris?', Journal of Ecology, 104: 1809-18. Paide, Olavi. 2011. "Järjekordne torm murdis palju riigimetsa."
[https://www.rmk.ee/organisatsioon/pressiruum/uudiste-arhiiv/uudiste-arhiiv-2001/19112001-jarjekordne-torm-murdis-palju-riigimetsa] March 27, 2019.
Rammig, A., Fahse, L., Bebi, P., Bugmann, H., 2007. Wind disturbance in mountain forests: simulating the impact of management strategies, seed supply, and ungulate browsing on forest succession. For. Ecol. Manag. 242 :142–154.v
R Core Team (2019). R: A language and environment for statistical computing. R Foundation for Statistical Computing, Vienna, Austria. URL http://www.R-project.org/
Ripley, B. D. 1977. 'Modelling Spatial Patterns', Journal of the Royal Statistical Society. Series B (Methodological), Vol. 39: 172-212.
Ripley, B. D.1979. 'Tests of randomness for spatial point patterns', Journal of the Royal Statistical Society, 41: 368-74.
Schlyter, P., I. Stjernquist, L. Barring, A. M. Jonsson, and C. Nilsson. 2006. 'Assessment of the impacts of climate change and weather extremes on boreal forests in northern Europe, focusing on Norway spruce', Climate Research, 31: 75-84.
Skogsstyrelsen: Stormen 2005 – en skoglig analys, Meddelande 1, 2006a.
Zhu, J. J., D. L. Lu, and W. D. Zhang. 2014. 'Effects of gaps on regeneration of woody plants: a meta-analysis', Journal of Forestry Research, 25: 501-10.
Zielonka, T. 2006. 'When does dead wood turn into a substrate for spruce replacement?', Journal of Vegetation Science, 17: 739-46.
Trenberth, K. E. 2011. 'Changes in precipitation with climate change', Climate Research, 47: 123-38.
Tsvetanov, N., A. Dountchev, M. Panayotov, P. Zhelev, P. Bebi, and S. Yurukov. 2018. 'Short- and long-term natural regeneration after windthrow disturbances in Norway spruce forests in Bulgaria', Iforest-Biogeosciences and Forestry, 11: 675-84.
Ulanova, N. G. 2000. 'The effects of windthrow on forests at different spatial scales: a review', Forest Ecology and Management, 135: 155-67.
30
Vodde, F., K. Jogiste, J. Engelhart, L. E. Frelich, W. K. Moser, A. Sims, and M. Metslaid. 2015. 'Impact of wind-induced microsites and disturbance severity on tree regeneration patterns: Results from the first post-storm decade', Forest Ecology and Management, 348: 174-85.
Vodde, F., K. Jogiste, L. Gruson, T. Ilisson, K. Koster, and J. Stanturf. 2010. 'Regeneration in windthrow areas in hemiboreal forests: the influence of microsite on the height growths of different tree species', Journal of Forest Research, 15: 55-64.
Vodde, F., K. Jogiste, Y. Kubota, T. Kuuluvainen, K. Koster, A. Lukjanova, M. Metslaid, and T. Yoshida. 2011. 'The influence of storm-induced microsites to tree regeneration patterns in boreal and hemiboreal forest', Journal of Forest Research, 16: 155-67. Xi, W. M., R. K. Peet, and D. L. Urban. 2008. 'Changes in forest structure, species diversity
and spatial pattern following hurricane disturbance in a Piedmont North Carolina forest, USA', Journal of Plant Ecology, 1: 43-57.
31
APPENDIX 1 Gap size and seedling density in every district
District Plot nr Size of the gap, m2 Gap gategories Distance to seedtrees,m
Nearby situation Density.ha Halliku 3 23778.88 10000-30000 0-10 m forest 1333.33 Halliku 4 1975.25 0-10000 0-10 m forest 6288.95 Halliku 6 13346.97 10000-30000 10-20 m forest 6200 Halliku 8 11076.16 10000-30000 10-20 m forest 6651.85 Tudu 1 69932.71 >50000 20-50m forest 3800 Tudu 5 19809.81 10000-30000 20-50 forest 16702.79 Tudu 7 21072.38 10000-30000 0-10m forest 7364.03 Tudu 9 40353.3 10000-30000 20-50m forest 13262.57
Eisma 1 8848.73 0-10000 10- 20 m salvage logged around/scattared trees
23718.66 Eisma 2 8848.73 0-10000 10- 20 m salvage logged
around/scattared trees
17716.03 Eisma 3 54522.12 >50000 0- 10 m salvage logged
around/forest nearby
7599.56 Eisma 4 54522.12 >50000 0- 10 m salvage logged
around/forest nearby