SKI Report 00:42
Research
Study of Defect Characteristics Essential
for NDT Testing Methods ET, UT and RT
Håkan Wirdelius
Elena Österberg
October 2000
ISSN 1104–1374 S T A T E N S K Ä R N K R A F T I N S P E K T I O N
Swedish Nuclear Power Inspectorate
POST/POSTAL ADDRESSSE-106 58 Stockholm BESÖK/OFFICEKlarabergsviadukten 90 TELEFON/TELEPHONE+46 (0)8 698 84 00 TELEFAX+46 (0)8 661 90 86
SKI Report 00:42
Study of Defect Characteristics Essential
for NOT Testing Methods ET, UT and RT
Hakan Wirdelius
1Elena Osterberg2
1
Det Norske Veritas
Neongatan 4B
SE-431 53 M61ndal
Sweden
2SQC kvalificeringscentrum AB
Box 519
SE-183 25 T6by
Sweden
October 2000
This report concerns a study which has been conducted for the Swedish Nuclear Power Inspectorate (SKI). The conclusions and viewpoints presented in the report
Abstract
This paper presents results from a literature review of defect characteristics essential for non-destructive testing (NDT). Most of the major NDT methods are included in the study - ultrasonic testing (UT), radiography (RT) and eddy current testing (ET). The study was performed by means of searching in scientific databases, technical journals, conference proceedings etc. Mainly, the following databases were used: CHANS (Chalmers database), INSPEC, NTIS, Ei Compendex, World Surface Coating Abs, METADEX, JICST-Eplus, Aerospace database, Pascal, Eng Materials, SciSearch and Weldasearch.
It is concluded that for eddy current testing, the defect geometry, the defect size and the defect orientation influence the outcome signal. A number of investigations address the relationships between the defect parameters like defect depth, length and width and the outcome signal parameters like amplitude, phase and signal shape. Also the phenomena of the electrical contacts between the defect surfaces (for a crack) was studied.
Defect parameters that are essential to the quality of ultrasonic testing are defect position in the object (includes the depth), orientation, size, crack surface roughness, closure and tip radius. This investigation has been focused on those parameters that are not that easy to reconstruct and only briefly discussed the influence on the signal response due to defect position, orientation and size.
When it comes to radiographic techniques, the most important defect related parameters that influence the quality are the difference in radioopacity of the specimen and defect and the angle between the volumetric extension of the defect and the direction of projection. The defect gape and the morphology of the crack are also very essential parameters. A very simple model of the detectability as a function of depth, width and misorientation (angle to the radiation beam) has been validated and to some extent also verified in a number of papers. Even for defects with very individual morphology, such as typical stress corrosion cracks, this very simplified model has proven to be valid. The results of the study are used to establish the characteristics of manufactured defects that must be controlled to produce defects that are similar to the ones of real in-service induced defects.
Finally, the proposal for the future investigation to attend the lack of knowledge about essential defect characteristics is made.
The study was sponsored by the Swedish Nuclear Power Inspectorate (SKI), which is gratefully acknowledged.
Sammanfattning
Denna rapport innehaller resultat fran en litteraturstudie over vasentliga
defektkarakteristika som maste aterskapas yid defektsimulering fOr kvalificering av ofOrstOrande provnings (OFP) metoder. Studien omfattar de vanligaste OFP metodema-ultraljudprovning (UT), radiografering (RT) och virvelstromsprovning (ET).
Litteratursokningen genomfOrdes i vetenskapliga databaser, teknisk litteratur,
konferenspresentationer mm. Huvudsakligen, fOljande databaser utnyttjades: CHANS (Chalmers databas), INSPEC, NTIS, Ei Compendex, World Surface Coating Abs, METADEX, JICST-Eplus, Aerospace database, Pascal, Eng Materials, SciSearch och Weldasearch.
Studien visade att fOr virvelstromsprovning, ar signalsvaret beroende av defektgeometri, defektstorlek och defektorientering. Flera undersokningar beskriver samband mellan defektparametrar som djup, langd och vidd och signalsvarets parametrar som amplitud,
fas och signalutformning. A yen fenomen av uppkomst av elektriska kontakter mellan
sprickytor har studerats.
Defektrelaterade parametrar som ar av avgorande kvalitativ betydelse fOr
ultraljudssignalen ar defektens position i objektet (inklusive djup), orientering, storlek, sprickans ytstruktur, sprickslutning och sprickspetsens radie. Denna litteraturstudie har fokuserats kring den kvalitativa inverkan de parametrar som konventionell simulering inte hanterar och bara oversiktligt beskrivit inflytande pa ultraljudsignalen av parametrar sasom position, orientering och storlek.
Vad betraffar radiografiska metoder ar de viktigaste defektrelaterade parametrama, som paverkar radiogramkvaliteten, skillnaden i radiogrammets opacitet (svartning) av provobjektet och defekten samt vinkeln mellan defektens volymetriska utstrackningen och projektionsriktningen. Vidare ar sprickans vidd och sprickmorfologi ocksa mycket vasentliga parametrar. En enkel modell av detekteringsbarhet som funktion av djup, vidd och sprickans lutning mot stralkallan har validerats och i viss man aven verifierats i ett antal publikationer. Modellen har ocksa pavisats stamma fOr IGSCC, trots att dessa karakteriseras av mycket individuell morfologi.
Vasentliga parametrar hos tillverkade defekter i kvalificeringsblock har definierats mot bakgrund av de i studien erhallna resultaten. De tillverkade defektema skall vara lika de riktiga defektema i station ur OFP-synpunkt.
Slutligen, ett fOrslag pa fortsatta studier har tagits fram med hansyn till de funna kunskapsluckoma.
Table of contents
Abstract ... 2 Sammanfattning ... 3 Table of contents ... 4 1 Introduction ... 5 2 Objectives ... 6 3 Results ... 63.1 EDDY CURRENT TESTING ... 6
3.2 ULTRASONIC TESTING ... 18
3.3 RADIOGRAPHy ... 35
4 Conclusions and recommendations ... 43
4.1 EDDY CURRENT TESTING ... 43
4.2 ULTRASONIC TESTING ... 44
4.3 RADIOGRAPHy ... 46
I
I
I
I
I
I
I
I
I
I
I
I
I
I
I
I
I
I
I
I
I
I
I
I
I
I
I
I
I
I
I
I
I
I
I
I
I
I
I
I
I
I
I
I
I
I
I
I
I
I
I
I
I
I
I
1 Introduction
Qualification of NDT systems according to the qualification practice in Sweden involves practical trials on test specimens for different purposes. Test specimen trials may be performed for technique development or for assessment of a present technique. The practical trials may also be performed under supervision of the Swedish
Qualification Body (SQC) to assess capabilities of the inspection system. The open trials are usually used for procedure and equipment qualification and the blind trials for
personnel qualification. In all cases, the test specimens aim to represent the real objects in the plant and contain a number of artificial defects, which should correspond to the
real defects from an NDT point of view.
At the present, a number of techniques are used for defect manufacturing. Some of the defects are quite simple; for example EDM notches, SDH, FBH etc. The others are more sophisticated and are usually called for realistic defects. The processes generally used to generate realistic defects are defect generated by fatigue and defect generated by
welding with doped electrode.
A number of problems related to artificial defects have been observed. A major problem is lack of evidence whether manufactured defects are a realistic simulation of real defects. Basically, does an artificial IGSCC have the same properties such as surface morphology, width, crack tip radius etc, as a real IGSCC? If not, what is the difference and how does it affect the outcome of an inspection? Additionally, it seems that there are difficulties to control the manufacturing process to provide the defect parameters like defect depth, length, tilt, skew etc within the specified tolerances. A number of investigations were performed in order to compare the pre-set values with real values of defect parameters. Sometimes, the real values were found to be outside the pre-set values. At the present it is unclear how big deviations from pre-set values are tolerable. Mathematical modelling is now widely being used in qualification process. Some models functionally relate the NDT signatures with defect parameters. Realism of those models has to be assessed.
In recognition of the importance of the reliability of defects used in qualification process, the Swedish Nuclear Power Inspectorate initiated a study concerning essential defect parameters. Emphasis of the study has been on investigating which defect parameters do influence the outcome of NDT inspection. The examples of such parameters are crack morphology, crack tip radius, crack orientation, crack depth etc. Such knowledge enables a better understanding of defect parameters essential for a particular situation and provides a basis for criteria for manufacturing of defects, which can be regarded as real. The obtained knowledge also forms a basis for assessing the defect manufacturing processes.
2 Objectives
The objectives of this literature review were:
1) to study defect characteristics essential for NDT testing with ET, RT and UT methods,
2) based on obtained information, to establish what characteristics of the manufactured defects are needed to be controlled to produce defects that are similar to real service defects,
3) if there is lack of knowledge about essential defect characteristics, to make a proposal for the future investigation,
4) to prepare a report with the results obtained in the study.
3 Results
The literature review was performed by means of searching in scientific databases, technical journals, conference proceedings etc. Mainly, the following databases were used: CHANS (Chalmers database), INSPEC, NTIS, Ei Compendex, World Surface Coating Abs, METADEX, JICST-Eplus, Aerospace database, Pascal, Eng Materials, SciSearch and Weldasearch. This section contains the results obtained from the study.
3.1 Eddy current testing
In eddy current testing (ET) the flaw is detected/quantified by observing changes of output voltage .1U or probe impedance.1Z while scanning the ET probe over the flaw. The response signal has parameters like amplitude and phase (or reactance and resistance), and also shape of the flaw signal. Both theoretical and experimental investigations were carried out to study interaction between the response signal and particular defect characteristics. Relationships between defect characteristics and ET inspection performance in terms of detectability, sizing ability etc., were studied as well. An example of this kind of investigations, performed for ET tube testing, is PISC III programme (1998) [1]. The goal of the study was to evaluate the performance examinations of ET techniques available for steam generator tubes inservice inspection in nuclear power plants. Bobbin coils and pancake rotating coils were both included in the study. The test tubes were made of Inconel 600 with a total of 95 artificial flaws: machined flaws simulating typical flaws such as cracking, wastage and pitting and chemically introduced flaws validated as simulations of secondary water stress corrosion cracks, volumetric intergranular attack and pitting. Destructive examination was
performed on all flaws after the experiments in order to compare the NDT results with the real characteristics of the flaws. Flaw detection probability as a function of flaw depth showed that axial flaws with the depth over 40% of the wall thickness were usually well detected. ET rotating pancake coils performed in general better than bobbin coils. There was good correlation between axial narrow slots and axial stress corrosion cracks. Thus, axial narrow slots were considered to be good enough to assess detection performance of ET techniques on axial cracks. Sizing performance was evaluated as well. ET rotating pancake coils showed capability to size the axial narrow slots but undersized the axial stress corrosion cracks.
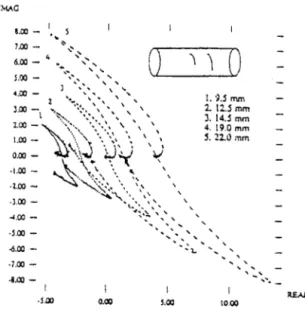
Ross and Lord (1995) [2] studied ET signal response from fatigue cracks and from EDM notches in tubing, made of 304 stainless steel. An inner diameter differential probe with operating frequency 600 kHz was used. Figure 1 shows dimensions of the ET probe and the stainless steel sample.
_·;!!!!!!!!!!!!!:;#::":~~~I~I~~----lll.1lmm
t ____
~.
.:-~-~~________
~o.,mm
- -
L59mmFigure 1: Eddy current coil and stainless steel sample dimensions.
The experiments were carried out on the manufactured fatigue cracks at the various growth intervals, the crack length varied from 9.5 to 22.0 mm; and the EDM notches varied in length from 7.0 to 22.0 mm. The experimental results led to interesting observations. Firstly, the amplitude of the response signal strongly corresponded to the flaw length. The signal amplitude increased significantly as the flaw length increased, see Figures 2 and 3.
iMAO
()
1,00 ·J,oo "\,00 ·7,00 ·'.00 -·1.00 0.00 1.00'\ 1 ()
1.9.5 mm 2.12.5 mm J. 14.5 mm 4, 19,0 mm 5.22.0 mm , ' , , ... ".-10.00Figure 2: Impedance plane trajectories of growing fatigue cracks.
lMAG 9,00 - I 1,00 _ 7 " 7,00 6.00 \,00 4.00 ),00 2,00 -1.00 _l 0,00 - ~ ·1.00 ,l,oo ·),00 "',00 ·4,00 -.J.oo " 0.00 1,00 1. 7,0 mm 2. 8.0 mm J. g.7 mm 4.9,$ mm S, :6,0 mm 6, 17,5 mm 7.2::.0 mm iO.oo 11.00
Figure 3: Impedance plane trajectories of EDM notches cut into the tube.
Another observation was that the increase in the flaw length had no effect on the phase. The absence of the phase change was explained by the authors by the fact that all of the flaws, except the first notch, were through wall flaws; the response signal from the first notch had a phase angle different from the other notches.
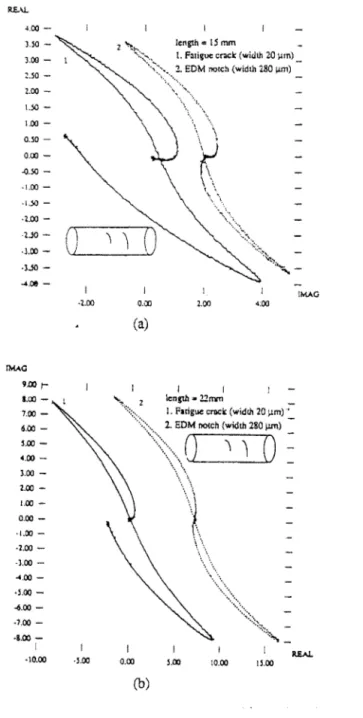
The authors also observed the similarity between the response signals from the cracks and the notches. The response signals for the cracks and the EDM notches are compared in Figure 4.
..00 - I I I
J.l0_~~" lcngth=lSmm _
3.00 _ I "<>,. 1. F.tigue crack (width 20 ~lIn)_ "':'" 2, EOM notch (width 280 ~)
,..10 - \ .. ". -2.00 - ~ ... <'~''''''' _ 1.50 - ' \ \ \ ... , ... \ 1.00 O.jO 0.00 .o.jQ ·Loo ·L.Iil ·1.00 -·1..10- ( ) '\
'I
·1.00 - '-1,.' _ _ _ --"-' ·3..lO 4.08 -IMAO 9.00 r 8.00 - I 7.00 6.00 S.oo '.00 ).00 1.00 1.00 0.00 ·1.00 ·2.00 ·100 .... 00 ·1.00 ..i.00 ·7.00 ·8.00 -I ·10.00 ·1.00 ·S.oo 0.00 2.00 4.00 Ca) I I '-"" 2 length :;g 22nvn _:::::.. 1. Fatigue cruek (widdl 20 ~m)'
0.00
'.:':::"" 2. EDM notch (width 280 ~)
-"":':::::::.> ... ,. ( ) '\
'I ( ) _
\~~,
1.00 \\ . '. ~ \,"" ... :> ....
.'.<~::::~:.:::~:.,
... :::;.::::",,-I 10.00 11.00 (b) IMAOFigure 4: Impedance plane trajectories of fatigue crack and EDM notch, a) 15 mm length, b) 22 mm length.
That was suprising because the EDM notch had a width of approximately 250-300 /lm,
while the fatigue crack had a width of approximately 20 /lm. The authors explained this
phenomena by the difference in the path of crack and the path of notch. The notch was much wider than the crack, bur also much straighter, therefore, giving the same response
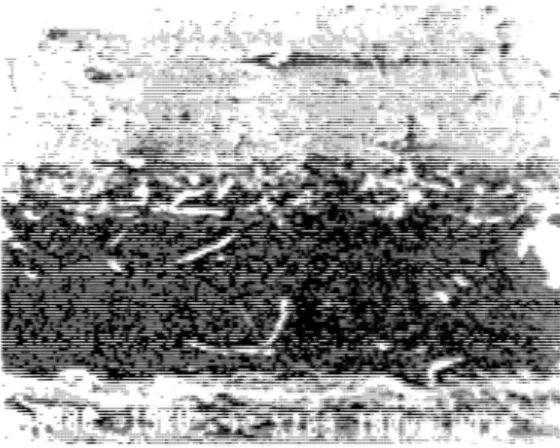
as the tight, but jagged crack. Figure 5 shows the top views of the crack and the EDM notch.
Figure 5: SEM micrographs offatigue crack and EDM notch, top view lOOX.
Besides tube inspection, eddy current testing is widely used for surface inspection. Then fatigue damage and stress corrosion cracking (SCC) are the most usual target. The width of the real cracks may be affected by bridging crack by corrosion deposits and by crack closure when the crack is under compression. Particularly, the cracks fatigued in the air, may develop electrical contacts inside the crack because of the smooth crack surfaces and the absent of the corrosion products inside the crack. The influence of the crack width on eddy currents has been the subject of considerable experimental and theoretical work [3, 4, and 6]. Most of the researches found that the response signal seems to be weakly affected by change of the crack width, as long as there are no electrical contacts inside the crack.
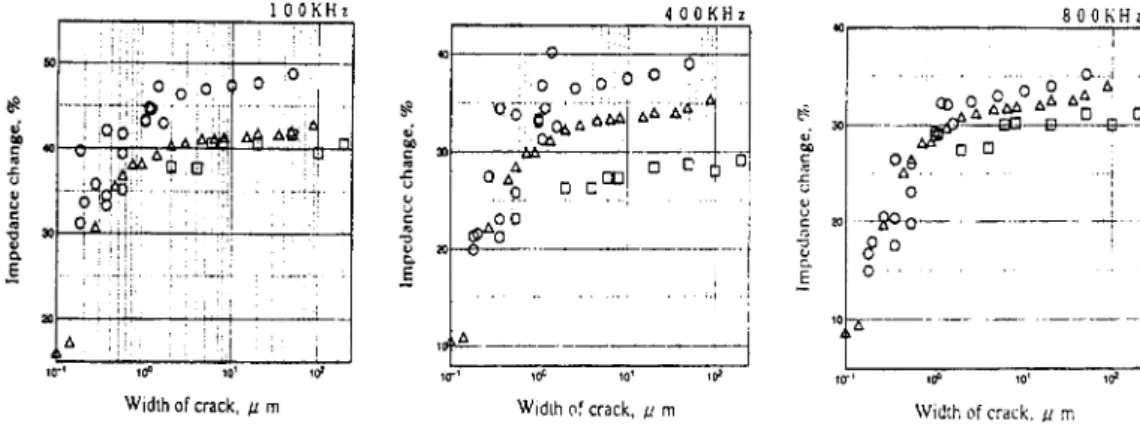
Kurokawa, Kamimura and Fukuki (1995) [3] studied the relationship between the amplitude of the impedance change and the width of cracks by both experiments and numerical analysis. Experimental investigations were performed on a test specimen made of Inconel600, 100 mm in length, 10 mm in width, 8.4 mm in thickness. One artificial surface crack (artificial stress corrosion crack or a fatigue crack) was made at the centre position of test specimens. The moving of the adjusting bolt up and down controlled the width of the cracks, as shown in Figure 6.
Adjusliag Boil
r:
Figure 6: Experimental apparatus.
Teat Pioce(IocoaeU 600) 100mmx10mmx8.4mm
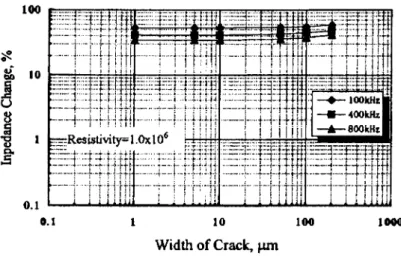
The depth of the cracks was larger than 4 mm, the length of cracks was equal to width of the specimens, so that for exciting current frequencies those cracks could be considered as a through wall crack. Experiments were carried out with a pancake probe with 0 3.2 mm for three frequencies: 100 kHz, 400 kHz and 800 kHz and for the crack width range from 0.1 /-lm to 100 /-lm. The largest value of impedance change while the probe moved across the crack was considered as the impedance change in the measurement. The results were presented as the graphic presentation of relationships between impedance change and width of crack for the used frequencies: 100 kHz,
400 kHz and 800 kHz. The results showed that the impedance change due to the width of the crack was small for all cracks. Figures 7 and 8 illustrate the received results.
..
~ ,;..
"" c..
.r: <.> ~ C) c..
"" " '" " .§..
Width of crack. /1 m i ~~'----~'~~--~'O''---~'~ Width of crack. /1 m lQ"' 800KHz loG 10' Width of crack. /1 mFigure 7: Relationships between impedance change and width of
scc.
400KHz .. r -__________ ~8~O~OKTH~Z
..
1O~---
-It'-' Id' '0' la'
Width of crack. /1 m Width of crack. 11 m Width of crack. 11 m
The researches [3] also performed numerical analysis. In numerical analysis, widths of the crack were changed from 1 !-lm to 200 !-lm for the frequencies 100 kHz, 400 kHz and 800 kHz. The results showed that the impedance change between 1 !-lm and 200 !-lm width crack was not significant. Figure 9 provides the graphic presentation of relationships between impedance change and width of the crack.
0.1 10 100 1000
Width of Crack, J.Ull
Figure 9: Numerical results of relationship between impedance change and width of
crack.
The numerical analysis results were in good agreement with experimental investigation results. To sum up, from both experiments and numerical results, impedance change due to the width of the crack was small.
Newton (1987) [4] studied crack transparency to NDT techniques, including ET. Four, unwelded flat plate samples were manufactured from BS4360 SOD steel. The first three concentrated on the production of tight cracks under a range of environmental
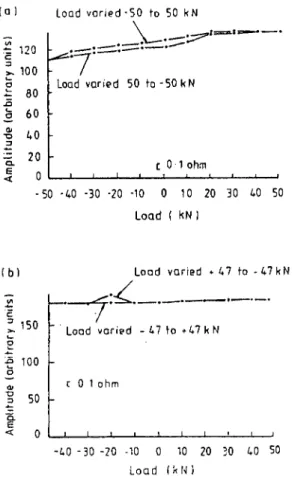
conditions and the fourth sample was used to investigate the effect of deposits within an open crack. The ET measurements were carried out by a pancake coil, outer diameter 16 mm, inner diameter 4 mm, length 4.8 mm. The crack width was controlled by the applied stress level. The amplitude of the response signal decreased insignificantly (by about 20%) for the cracks under large compressive stress (Figure 10).
(0 ) ~ 120 ;. 100 (; .!:: 80 15
£
60 .g 40 :> load varied· 50 to 50 k N ~0_~1='-_0:==;:=:-:=::':_0-Load varieod 50 to-SOkN
0. 20 cOl ohm ~ 0 ~~~~~--~~~~~~ ·50 ·40 -30 ·20 ·10 0 10 20 30 40 50 Load ( kN) (b) ~ c ~ 150 :.0 100
a
'":2
50 ~ Load varied. 47 to -47kN0-1:£'._._._-_'_'
Load varieod -47 to .47 kN [ 0 1 ohm ~ 0 ~ __ ~~~~~ __ ~~~~ -40 - 30 -20 ·10 0 10 20 30 40 50 Load (kl, lFigure 10: The variation of eddy current signal amplitude with applied load for two samples - using a large diameter ring coil; (a) dry crack at 10 mm depth, (b) crack
under free corrosion in seawater at 16 mm depth.
Auld, Muennemann and Winslow (1981) [5] studied the eddy current response to open and closed surface flaws. Measurements were made by differential probes with
operating frequency 100 kHz and 1 MHz, and also a ferromagnetic resonance probe with the operating frequency 1000 MHz. A test specimen was made in aluminium and included artificial fatigue cracks. The results showed that the low frequency probe response was essentially unchanged while the ferromagnetic resonance probe response had been significantly reduced with increase of loading. The main conclusions from the study were that low frequency probes did not distinguish between closed cracks and open flaws, such as EDM notches, and also that the ferromagnetic resonance probe was more sensitive to width of cracks.
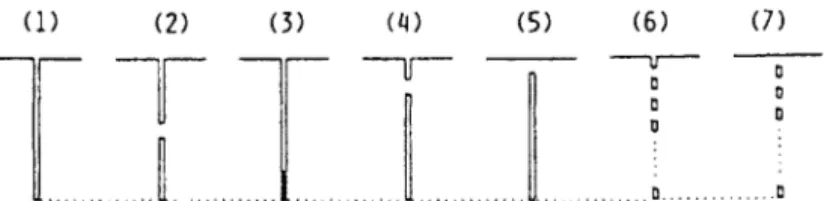
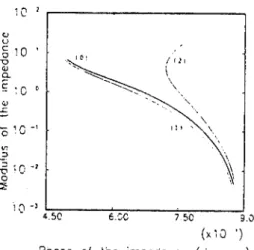
Nakagawa, (1980) [6] investigated theoretically the situation when the crack closure effect produces electrical contacts inside the cracks. The response signals were calculated for different cracks. Figure 11 shows these cracks and Figure 12 illustrates the calculated impedance signals.
(l) (2) (3) (4) (5) (6) (7)
TIT
-u-
~
..J
- - v -00 0
.0 .. .0
Figure 11: Various tight cracks, for which impedance signals are calculated, all having electrical contacts except (1).
10 ' r---.---..-~(~!)~----, Q.J U C Cl "0 Q) 0-. 0 -, c' <:J ..c o '" 1 0 -J ::> ::> 'D o ::2 (5) (7) ~---10-~ ~ __ ~~--~ __ --~ __ - - - J -3.00 0.00 3.00 6.00 9.00 (x 1 0 ') Phose of the impedance (degrees)
Figure 12: The impedance signals calculatedfor the cracks of Fig. 11.
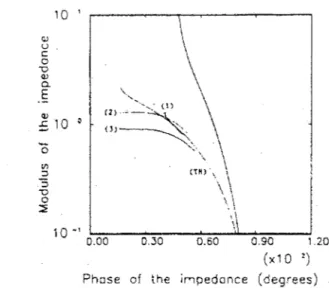
The results clearly show a significant change of the impedance signal. Nakagawa has also compared the results of theoretical investigation, carried out by him, and the existing experimental data for the cracks with closed tip. Agreement has been found between theory and experimental measurements. Figure 13 shows the comparison among theoretical results and experimental results for the cracks with closed tip.
10 ' ~-~--.---r---""'---'
,
\
<lJ U . c: o -0 QJ a. E QJ :5 10 0 ' - - " _ ' ( 1 ) \:::~.\.
(TH) \ \ "\
\ .\\
10-' 0.00~--~~--~~~~~~--~
0.30 0.60 0.90 , .20 (x10 ')Phose of the impedonce (degrees)
Figure 13: 1mpedance curves showing the comparison between theory and experiment
in the case of cracks with closure at the tip. The theoretical result, labelled as (TH), is obtained assuming the surface-breaking part is 80% of the total depth. Experimental data are shown as (1), (2) and (3).
Nakagawa has also calculated eddy current signals caused by change of crack width without developing electrical contacts between crack surfaces (Figure 14).
lJ
T
Figure 14: Cracks: an open crack and a tight nonconducting crack.
The calculations of the impedance signal for the open crack were carried out for two cases, shown in Figure 15:
u
dFigure 15: An open crack and two choices of surfaces, S1 and S2.
1 [' , , - - - - . - - - , <l! U § 10 ' "0 '" a. £ 1 C 0 '" '0 '0 -\ rto! '-~-"''''' rlr , \ Ilr \ \ .\ \ 1 €.SC 750 i 0 -l !-;-::---~~-____,~---l 4.se 9.00 (X 1 Cl I)
Pnase of the impedance (degrees)
Figure 16: The impedance curved calculated: (0) for a tight crack, (1) for an open crack with the choice S1, (2) for an open crack with the choice S2.
In 1985, McFetridge [8] has conceived a chart for crack depth and crack width (Figure
17). The chart is the plot of the amplitude of impedance change versus the phase of impedance change, at the centre point of the flaw profile, with all but one of the flaws parameters fixed. For example, the flaw length and width may be fixed - and the maximum depth varied, or the flaw length and maximum depth may be fixed and the width varied. These two choices generate two amplitudeversus phase curves
-constituting the McFetridge chart. The flaw depth is normalised to the skin depth; the flaw width is normalised to the coil radius. The operating frequency, the flaw length and the flaw depth shape must be fixed. The chart was validated by other researches [7] with good results.
THEORETICAL INVERSION GRAPH
FOR CRACK DEPTH a AND CRACK WIDTH Au
I.-1.2 FLAW PAOFII.£
PHASE. DEG"EES
Figure 17: Theoretical depth and width inversion curves.
The flaw length concept was developed by Copley in 1983. Copley, Thompson and Chimenti [9] showed that for a rectangular surface notch, the notch length related in the
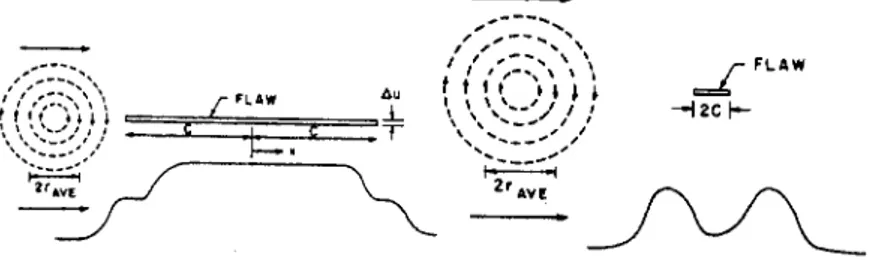
systematic way to the shape of impedance change while scanning over the flaw (Figures 18 and 19). Thus, the flaw length may be deduced from shape of the amplitude change. Even the other works found that the flaw length could be deduced from the amplitude shape of the impedance change signal.
Figure 18 shows the physical basis for length inversion from the flaw amplitude profile.
Figure 18: Flaw amplitude profile for average probe diameter smaller than 2c and for
average probe diameter larger then 2c.
Copley [9] has also showed that the phase of the response signal related to the defect depth. Also, the amplitude of the response signal was mainly affected by the defect length and also defect depth. Figures 19 shows the measured phase angle changes for the rectangular notches with varied depth. Figure 20 shows how the amplitude of the response signal relates to the notch length for notches 0.125 and 0.25 mm deep.
12 r - - - , 10 ~ 5 • 2 e 6 0.1 0.2 o. ] 0.4 0.5 0.6 NOTCH DEPTH (nrn)
0.5 1.5 2.5
NOTCH LENGTHS (mm)
Figure 20: Variation of signal amplitude with length of rectangular notches.
3.2 Ultrasonic testing
The first well known system for performance demonstration, within the area of NDT, was the result of a requirement of the safety case for the pressurised water reactor Sizewell B. A trial with technique based on the ASME code was carried out on large blocks replicating PWR vessel welds. The result was more or less devastating with a very low probability of detection (POD) of even very large defects. This became to be known as the PISC I exercise and the result enforced further investigation based on international co-operation and large scale round robin tests (DDT, PISC II and Ill). The poor results from the PISC I have later been identified being to some extent caused by the use of unrealistic artificial defects. The surfaces of the implanted internal cracks where very smooth and the applied pulse echo technique is not the optimal choice for this case. The main consequence of the PISC I experience was the development of a NDT quality assessment program (reliability) based on the principles of diversity, redundancy and independent validation (see [11]). The question of what characteristics that have to be reproduced in order to make a manufactured defect realistic is discussed in a paper by Crutzen et al from 1996 [12]. They conclude that the use of pieces of structures containing real defects embodies a major drawback since they all are
individuals and the number of available and representative real defects are very limited. Based on a limited number of defect characteristics, the defects used in the PISC II program are usually divided into three groups and the PISC II results, specified as function of defect, are visualised in Figure 21:
PISC II defect A - smooth cracks with sharp crack edges (fatigue cracks).
PISC II defect B - rough cracks and cracks which were strongly modified during implantation and with unrealistic crack tip conditions.
30 40 50 60 70 80
DEFECT SIZE (mm)
A. smooth. planar for ultrasonic wave length. sharp crack edges B. Hybrid defects or rough
defects like hot tears
C. Volumetric defects
Figure 21: Detection rate for ASME type procedures (PISC II assembly n03).
All category A flaws used within PISe 11 and III were smooth and characterised by a sharp crack edge. Various fabrication procedures were utilised in order to produce these
so-called type A flaws (Table 1): diffusion welding, electro-discharge machining
(EDM), and shrink fitting (HIP process). According to the authors measurements were made which concluded that all these flaws can be considered ultrasonically equivalent provided that the crack tip equivalent radius is less than 0.03 mm (at 2MHz) and that there is no compressive residual stresses acting on the crack tip.
Flaw Size Position of Fabrication Crack tip Tilt Defect in depth the lower Method of the aspect angles shape
(mm) crack tip defect (deg.) (mm)
from from
-
diffusion-V
from - long stripswelding - ellipse
10 13
-
sharp EDM-V
0 - circular to to-
fatigue.-
~
to (shape(mechanical) correction
25 200 - shrink fitting
.-~
15 for disk type defectsTable 1: Characteristics of realistic PISC category A flaws usedfor comparison with real fatigue cracks.
In Table 2, the theoretical GTD model (Geometrical Theory of Diffraction) was used as
a common reference measure in order to reduce important parameters such as size and angle of the defect. The diffracted signal from the lower crack tip differs less than 3 dB from that of a real crackand corresponding less than 7 dB for the upper tip. The
amplitude levels (GTD) were also found to correspond to those measured from real fatigue cracks.
Type of crack Probes N° of Mean difference (dB)
measurements
lower crack tip upper crack tip
Artificial type A 45°,60°,70° 51 -0.8±2.3 2.9±4.3
SV, 2 MHz, contact
Artificial type A 45°, focalised 3 -1.2±0.7 2.5±1.I
SV, 2 MHz, immersion
Real SV, 2.25 and 5 MHz, 19 0.0±1.5 0.0±1.5
(GTD-model) immersion
Table 2: Comparison of the measured amplitudes of diffraction for PISC category A flaws and theoretical values of diffraction (GTD).
The authors also refer to results where combination of type A flaws and volumetric defects has had a misleading impact on the sizing task. The two planar defects under compressive stresses had also a systematically lower detection rate than standard planar flaws. A comparison between stress corrosion defects (IGSCC) and type A flaw (see Figure 22) revealed moderately higher detectability of the type A flaw. This effect is explained by the different defect surface conditions and the closure of the rGSCC by corrosion products. The paper concludes with a recommendation to emphasise on studies.of NDT signal response from real defects, more than on the metallurgical appearance of the real defects compared to the artificial ones.
all flaws
..
1 T 0 C I 4 4 • ~ 0.9•
•
4•
•
0 O.B 'I: 4 11 0. 0.7•
c 0 0.6•
44 :;"
4 'ii > 0.5 4 • IGSCC cracks w 0.4 .., ... non·IGSCC flawsI
c:...
•
c: 0.3 .2 0.2•
•
'(j•
.!! 0.1 tl 0 0 20 40 60 BO 100flaw depth (% wall thickness)
Figure 22: PISC III action 4. Results of the inspection of wrought steel primary piping. Difference in detection and correct evaluation rate between IGSCC and other defects.
Wtistenberg and Erhard discuss in a contribution [13] from 1994 the importance and opportunity to use specific artificial defects for a well specified NDT -task and method. They emphasise the necessity to make a definition of the artefact as being a reflector or an object for crack tip simulation. The most frequently used artefacts and their typical physical interaction to produce an indication are listed in Figure 23.
I cylinder
7g~
Idealizing shapes (refJectlon)~~
ultrasonic probe./~~~--~~~
~f?E
Figure 23: Testreflector types.
(reflection and dlllrection) crack type reflectors (dillractlon and ItJIec\lon)
The general approach to base the registration of ultrasonic indications on an absolute amplitude threshold implies an assumption of proportionality between echo amplitude and defect size. For small indications (in the range of a wavelength) the echo amplitude increase monotonically with the defect dimension but this is not the case for larger defects and inclined cracks. The absence of a predictable and monotonous dependency between echo amplitude and defect dimensions is visualised in Figure 24 as the dynamic range for a number of artificial defects.
The authors also state the following factors to be regarded as the defect is to be used as reflector:
• The typical interaction between the ultrasonic wave and the defect must be
transferable from the defect to the test reflector. A minimum demand of similarity in morphological sense such as: slag-SDH, hydrogen crack-FBH and near surface crack by notch.
• The reflector dimension should correspond to actual simulated defect size and its echodynamic range.
• The localisation of the reflector should represent the same geometrical conditions as the defect.
• The production of the test reflector should be of such high quality that it ensures a high reproducibility also in the echodynamic response.
dB Reference: 2 MHz, shear wave +20 +10 QI 0 'tJ .a
a
E ·10 to 0 .c 0 W ·20 waves 0,01 3 D/) .. 10flaw size to wavelength ratio
..
Figure 24: Dynamic range of echo amplitudes for different reflector types.
The authors also state in the article [13] that if the main interaction instead is based on the crack tip diffraction, then there is no other possibility than to use real cracks from cut outs from real objects. This does not ensure that they represent the worst case conditions. Any available production of realistic cracks, e.g. electron beam welding and diffusion welding, are not sufficiently representing weak tip diffraction. This is used by the authors as an argument for using amplitude related sizing techniques instead of diffraction techniques.
The complexity within the problem of using real flaws were made obvious as a German regulatory body demanded that cracks due to stress corrosion or authentically defects (i.e. by UT means) in the cladding of the pressure vessel should be applied as
calibration. According to the German KTA-rules (3201.4) for in-service inspection, notches had up to then been applied to calibrate the ultrasonic techniques for the inner and outer surface of the reactor pressure vessel.
Neundorf et al present in a paper from 1998 [14] an investigation of which defect characteristics that have to be reproduced in order to make the calibration defects more authentic. Unfortunately was the amount of available real defects from the objects very limited and hence had the study to emphasise on IGSCC found in other applications.
Though based on previous observations on other objects with IGSCC, the ultrasonic characteristics were specified as:
• Poor detectabilty if the corner trap between crack and surface is influenced by craze cracking.
• Deeper cracks tend to be branched, so the evaluation of the crack tip is not possible. • Rough and irregular face due to the intercrystalline morphology.
The artificial defects used in the study to simulate the IGSCC were produced by mechanical cycled loading (fatigue), since the impact on the surrounding welding material are thought to be very low. The goal for the ultrasonic investigation of the test piece (with seven implants) was to analyse whether the defects were detected by conventional technique (pulse-echo shear wave 45° and 60° together with tandem technique) based on standard sensitivity calibration with notches. The detectability with conventional procedure is in the report clearly demonstrated. How the artificial implants relate to real IGSCC is unfortunately not sufficiently investigated in the report.
As in the previous paper [14], the significance of incorporating redundancy in the NDT inspection procedures is emphasised in a paper by Rose et al from 1990 [15]. They demonstrate in their paper that using two inspection procedures simultaneously (in a redundant mode) produces a probability of detection substantially higher than any of the
individual procedures. In order to confirm this theoretically, the two procedures have to
be based on two independent techniques, though practical experiences have indicated that this is not an absolute demand. The basic principle to achieve a redundant technique is to combine two independent physical interactions with the defect in the procedures. An example of this is to combine an ultrasonic technique that are optimal for crack tip diffraction with another ultrasonic technique optimised for defect surface reflection or corner echo. An often used redundant technique is to combine conventional pulse-echo technique with a tandem configuration based on crack tip diffraction (TOFD).
An interesting parametric study within the PISC II program, dealing with flaw
characterisation by using tandem and time-of-flight diffraction (TOFD) techniques, has been accounted for in a paper by Murgatroyd et al in 1988 [16]. The study was
performed by the United Kingdom Atomic Energy Authority (UKAEA) and one of the main objectives of the reported work was to acquire reliable experimental data that could be used to test and verify theoretical models. A thorough validated model may be an alternative and a complement to the experimental work in the development of new testing procedures and has a significant advantage in its capacity in parametric studies. Thirteen test blocks were selected with flaws covering a wide range of sizes, degrees of roughness and orientations.
Flaw parameters Scan skew
I
(degrees)
Maximum amplitude
Size Depth Tilt Surface (mm) (mm) (degrees) (Rough/Smooth) lOx50 55 0 R 0 +2.7 15 -22.7 lOx50 55 0 S 0 +13.3 15 -29.1 lOx50 55 7 S 0 +0.5 15 -36.5 lOx50 55 7 R 0 -7.6 15 -15.8 lOx50 55 15 S 0 -8.2 15 -41.9 10x50 55 15 R 0 -13.6 15 -23.6 25x125 82.5 0 S 0 -18.0 15 -27.0 25x125 82.5 7 S 0 -4.0 15 -37.0 25x125 82.5 10 S 0 -9.0 15 -34.0
Table 3: Results from the tandem inspection of strip flaws (diffusion-welded).
Peak signal response relative to a 6 mm FBR.
Some of the vast amounts of results from the study are presented in Table 3 regarding maximum amplitude response in 45° tandem configuration for a number of flaw cases. Even though the amount of situations included in the study is large, the number of parameters that are varied are to many in order draw any significant conclusions. This was though not the intention of the study; instead it made it possible to verify theoretical models which then could be used to make more thorough parametric studies. The tandem configuration is based on specular reflection and the defects are not surface breaking, why the great reduction in amplitude due to skew and tilt angles, visualised in Figure 25 and 26, is what could be expected. The less impact due to these parameters as the crack surface becomes more rough is also intuitive and has a simple physical explanation.
-Sf PEAK AMPLITUDE I dB I • S"OOTlf HAW K ROUOiH fUW SKEW ANGLE lOUGH. " TILT lOUD". ,. TILT
ROUtH .U' TILT SHOOTH • ,. TILT SMOOTH ,"TILT
Figure 25: Variation in peak signal amplitude with skew for a 10x50 mm strip flaw. PEAK AMPLITUOE I dB) TI LT ANGLE SMOOTH. 0' UlW ROUi". O' SUW ROUGH. 1S' UIW
Figure 26: Variation in peak signal amplitude with tilt for a 10x50 mm strip flaw.
As the tandem configuration part of the study was dedicated towards the task of
detecting defects, the TOFD technique was applied as a sizing and characterisation tool. The TOFD inspections were conducted on test blocks containing sharp edged circular flaws produced by diffusion welding and composite. The defects were in some cases placed within 3 mm from the surface and some were closely spaced which in the report is recognised as conditions that presented difficulties to the TOFD technique. One of the conclusions made by the authors is that even though TOFD is a valuable sizing
technique it should for some defect configuration and situations, be working in conjunction with others such as pulse-echo and tandem techniques. This of course coincides with the above discussed methodology of incorporating redundancy in the inspection procedures.
Another interesting contribution to the empirical database of ultrasonic responses from various types of defects as function of their misorientation, was presented by Toft in 1986 [17]. This, as also previous discussed paper, has an outspoken mission of being a
tool to verify theoretical models and assessing the capabilities of particular inspection procedures. The study includes ultrasonic measurements from smooth reflectors,
flat-bottomed holes, a fatigue crack tip and rough crack faces. In Figure 27 the experimental
study of diffraction from a straight-edged, smooth flat crack is visualised together with theoretical prediction by geometrical theory of diffraction (GTD). The object was manufactured by producing a smooth fatigue crack in a large compact tension specimen, which then were subsequently machined into the shape of a disc (80 mm thick). The centred edge of the crack was then accessible by zero degree probes by all directions and at identical distance. The object was scanned by a 5 MHz compression wave probe (left diagram in Figure 27), a 2.25 MHz horizontally polarised shear wave probe and a 2.25 MHz vertically polarised shear wave probe (right diagram in Figure 27). As can be seen the predicted diffraction coefficients derived by the theoretical GTD model agree well with the signal response recorded within the experimental study.
5 MHz, comp. 2.25 MHz, hori.shear 2.25 MHz, vert. shear
24 24 24 18 ~
..
1.0 le ~..
1.0 18 ~ I..
1.0 § Q i'li Q I i'li 2 ~;
M Ii
i
2 I 12 ~ 12 ~ 12 ~ " liI i i " u < ~ ~ " ! ! ! !""
8 6 ;:: 5 .{ ;:: ~i
u lE ~ ... 0 0 0 Q 0 Q 0.1 0.1 0.1 -8 -6 -6 -12 -12 -\Z -18 -18 -18AHCLE TO CRACK FACE <DEC) • Cl
-24
30 eo 90 120 I -24 0 eo 180
Figure 27: Comparison of experimental (dotted) pulse-echo response of a fatigue crack tip with theoretical predictions by GTD (solid lines).
The ultrasonic response from circular and square flat-bottomed holes as function of both tilt and skew angle was measured with a 70°, 1.6 MHz shear wave probe in pulse-echo mode and the defects were also scanned with a tandem technique. The results from these measurements are presented in Figure 28 as contour plots with the tilt angle measured from the specular direction and the skew was simulated by skewing the probe.
20 ID , , ... ... " ... ... ... ... ...
,
\, ,
,
,
\,
,
,
,
\ \ \ I \ , ... 10 ... ... ... ... ... ...,
... ... ... ... ... OdB '-, -,
, ,
, ,
, ,
,
,
\ \ \ \ I IFigure 28: Contours of pulse-echo response above 10% DAC of circular (left) and square (right) holes misoriented in tilt and skew.
A minor study of how roughness correlates to signal response as a function of incident angle is also included in the report [17]. Theoretically the roughness of the surface of a real crack (e.g. IGSCC) affects the detectability by increasing diffuse scatter at the expense of specular reflection and by attenuating edge wave response. The author pinpoints the complexity of such an experimental study since it is more or less
impossible to elucidate the separate dependence on variables such as range, frequency, pulse length, crystal diameter and defect dimensions. Another difficult task is that the measurement of average ultrasonic response must be based on a valid statistical ensemble of defect surfaces (each crack being an individual). This problem is though not unique for these kinds of effects but should also be present when e.g. the effect of anisotropy in welded material is to be studied. A number of brittle fracture surfaces was inspected with a 1.5 MHz shear wave contact probe and a compression wave probe immersed in water, with variables chosen in order reproduce the wavelength, pulse length and beam diameter used in the contact study. The comparison in Figure 29 with an equivalent smooth defect shows the expected quality features: signal levels from rough defects at normal incidence are considerable lower than corresponding for smooth, whilst persisting at higher levels in non-specular directions. This confirms the common NDT experience that rough cracks are quite readily detected by angle probes.
...
30
20
10
SMOOTH CIRCUlAR OEFECT
~F8H)
t /
...
ROUGH SURFACE IMMERSION STUDY Q / ' III G Q G I!lI (i) G Q []/'"
ROUCH SURF ACE CONTACT STUDY
Figure 29: Signal level of the 50th percentile, compared to the response of an equivalent
smooth defect.
Material defects can have frequency-domain characteristics that cause their echo amplitude to differ significantly for ultrasonic inspection equipment of different bandwidths and centre frequencies even when conventional calibration procedures are used. These differences reduce the reliability of defect detection and in some cases also of the defect sizing. In a paper by Green from 1989 [18], this issue is investigated based on the impact on inspection reliability due to defect variables such as: angle, size and defect surface roughness. The basis for the analysis is the assumption of the signal response being composite of a finite number of single independent transfer functions
(gi (f ,ai) ) that can be identified: 8(t) -
f
R(f)T(f)gj (f ,aJ )g2 (f ,a2 ) ... gn (f ,an)e -ift df with R(f)T(f) defined as the equipment transfer function (also possible to subdivide) and the acoustic system transfer function (ASTF) defined as gJ (f ,aJ )g2 (f ,a2 )···gn (f ,an) ,where
f
is the frequency and £Xi the specific parameter.As the author pinpoints in the paper, it is impossible to identify a worst-case defect by modelling all possible defects and performing sensitivity analysis. This being an even more impossible task if it should be based on experimental studies. Based on this insight the objective of the work presented in the paper was to determine what features make a worst-case defect and to search the literature for data on defects with these worst-case features. Due to the fact that almost all papers dealing with ultrasonic spectroscopy only include amplitude information as function of frequency the study had do exclude the effect of phase vs. frequency. Phase interaction between the equipment system and the acoustic system may, as the author also admits, prove to be important, e.g. in connection with rough cracks. This and the fact that the number of observations that are used to draw conclusions from are very limited, makes the conclusions made in the report somewhat ad hoc and hence not submitted here.
An earlier investigation that also emphasis on the impact on the ultrasonic signal response, due to the equipment transfer function, is found in a paper by Posakony from 1986 [19]. Six 45°,2.25 MHz shear wave transducers (two each of three different bandwidths) were applied together with three types of ultrasonic instruments.
These were characterised as square wave pulser/ultrawide-bandwidth receiver, tuned pulser/narrowband receiver and untuned pulser/moderate-bandwidth receiver. The test blocks were made of stainless steal (304) with eight different machined defects: one end-milled notch (reference), one side-drilled hole and six EDM notches. The results are presented as maximum signal response (pulse-echo mode) as function of bandwidth and with information of the distribution within the twelve measurements (two transducers, three instruments and two directions). The author concludes that the use of amplitude response for sizing is not reliable even for these very simple artificial defects and with both sides of the defect scanned.
In a literature review by Zetterwall and Borgenstam from 1994 [20], the subject
"detection and sizing of closed crack" is thoroughly investigated. The inspection of components is usually carried out during a shut-down period, which tends to transform normally tensile conditions for the component towards a state of compressive stresses. The tensile stress is a foundation of crack growth while the residual compressive stress closes the crack and affects the detectability and sizing conditions. This phenomenon has been the basis for a number of experimental studies [21-24]. The effect on
detectability, i.e. in this case pulse-echo response from the corner, of a fatigue crack as function of compressive stress has been investigated by Wooldridge and Steel in a paper from 1980 [23] and Ibrahim and Whittaker in a study published in 1981 [21]. Both studies have used angled shear wave probes (45°, 60° and 70°) in pulse-echo mode and a test block containing fatigue cracks (opposite side) with applied loading simulating residual compressive stress due to plastic tensile deformation (see Figure 30).
~ 45' ~+--+--~--~~--+ 30+--+---" JO _ ... I Crack depth - 2 m m - - - - 4mm 0+--4---r-=r--+--+ o 100 200 300 ~ 500
CompreSSlve Stress (MPa)
60" ~+-~---r--r--+--+ Crack depth 30 ._-_.+--_ ... +-_ .. ---:
=
O~-+--~--r--+--+ o 100 200 300 ~ 500Comprcsslvc Stress (MPa)
70" ~+--+---r--r--+--+ Crack depth 30 +----i-·-·---"'--·-·- _-__ -. ~:: @:. ... " 6mm
J
20 JO +---', ... --: .. -. --,.~,.+ .-.. -., .. ,-,.,-" ... __ ... __ .+_._ ... _ .... + 100 200 300 ~ 500 Compresslve Stress (MPa)Figure 30: Maximum signal response from fatigue crack as function of applied compressive stress (5 MHz shear wave probe).
The tendency depicted in Figure 30 (from [21]), i.e. highest detectabilty with a 45° probe, is also deduced in the paper by Wooldridge and Steel. To compare these individual experiments, one has to take in to account each fatigue cracks history of growing since the surface condition (roughness) unquestionably is an important parameter as the crack is partially closed. The complexity of the problem increases as the reflection from the rough surface also depends upon used frequency (wavelength). To perform parametric studies that covers all these parameters, based upon experimental
work, then tends to be an impossible task. This has enforced the development of mathematical models predicting the reflection as function of the above describe variables.
One of these models has been used in a theoretical study by Temple in a paper from 1984 [24]. In order to qualitatively evaluate the impact roughness has on ultrasonic NDT in detection mode, the reflection coefficient has been calculated for a number of cases. Smaller scale roughness shows greater effect than larger scale roughness for the same frequency and applied load. This is due to a larger number of possible contact points that will be activated and transfer energy when the load is applied (decreasing the reflection). The use of higher frequency reduces the influence of compressive stresses, which is visualised in Figure 31. It should be noticed that the model used by Temple does not include the correlation length of the roughness as a parameter.
o 2 4 6 8 10 Frequency [MHz] ~ ._ 0.8 (.) ~ <1l 80 . 8
.~
0.4 (.) ~ ~ 0.2 •••. j ... : ... 30j.lm.. _
... _+ ... :., ...
:F ... _
...
! ... _
...
b:.,_IO j.lm-A,:~'--b-;+,:=:t-'-
5,m=~~Z::::k.::~J·:~·::::::::r::
....
:::~]::::·::::·:·:·::
....
~:i
. i
o --=-~--~--~--~--~ o 2 4 8 8 '0 Frequency [MHz]Figure 31: Reflection coefficient for compressive waves at normal incidence on rough cracks (three rms values) under 60 MPa (left) and 160 MPa (right) compressive stresses.
The author also stresses the model beyond its validity and draws conclusion of the impact roughness has on the tip diffracted signal. This after assuming that all incoming energy is either diffracted by the tip or transmitted through the surface (i.e. for Tandem or TOFD setup). This coarse approximation is the basis for a very simplified model that associates the diffracted signal with corresponding reflected wave component from an infinite crack.
A much more sophisticated model for the impact on the ultrasonic signals due to defect surface roughness was derived by Ogilvy in 1989 [25]. The model, which also
incorporates the tip diffraction, is based on the acoustic Kirchhoff approximation. The model is valid if the correlation length of modelled surface is much larger than used wavelength. This restriction is caused by the fact that Kirchhoff theory postulates that each surface point is assumed to scatter as though it was part of an infinite plane reflector parallel to the local tangent. As has been deduced within the paper this
restriction could be under certain circumstances violated and still reach good agreement with experimental results. The model does not include the effect of the residual
Another approach to model the effect of closure is to make a physical interpretation of the impact on ultrasonic signal and reduce the defect to a mathematical boundary layer with spring boundary conditions. This has been deduced by Bostrom and Wickham in paper from 1991 [26]. Their model is based on the assumption that the energy is transmitted by the contacting faces caused by the defects surface roughness and static background pressure. These are modelled as randomly distributed circular spot-welds and hence the defect is replaced by an approximate equivalent interface with the traction being continuous and a jump in the displacement proportional to the traction, i.e.:
t+ - L =0
u _ u
=
!!!5.... t ' with a being mean contact radius, "a material constant and Po the external pressure.+ -
-Po
In the paper [26] the model is also validated against measurements made by Wooldridge and Steel [23] and the model is found to agree qualitatively in respect of dependence on wave mode, pressure and frequency (Figure 32). All attenuation due to absorption (viscous effects) or grain boundary scattering is neglected in the model, which is the explanation for the discrepancy one can identify in the figure.
ITI 0.8 0.6 ~ 0.'
.-.
o " 0 • 2 (MH,I P o 4 (MHz] P , 6 (MHzl P I1MHzJ5 , 4(MHz]S IRI 0.8 , ,.
0' • ~.
0.6 ~~ 0.4 0.2 o " • 2IMHz) P o '(MHz)P , 6(MHz)P " 1 (MHz)S • «MH.IS o~o---c----c---~---~ TjFigure 32: Reflection and transmission coefficients at normal incidence versus 11 ( dimensionless pressure parameter). The continuous curve represents the model (a=l0f.1m) and the symbols correspond to Wooldridges and Steel [23] measurements.
The above described model of a crack that is partly closed due to an external
background pressure has been incorporated in a model of the whole ultrasonic testing situation. In a paper by Wirdelius from 1992 [27] the ultrasonic NDT model has been compared with another model based on geometrical theory of diffraction. Both defect models have been equipped with the above described spring boundary conditions hence the validation does not include this part of the model.
Figure 33 presents the signal response as function of tilt of the defect and varied static background pressure, i.e. residual compressive stress due to plastic tensile deformation. The simulated probe is a zero degree, 3 MHz compression wave probe applied in a pulse-echo mode. The three distance amplitude curves then together provide with information of the impact on reflection, in the non-tilted case (left figure), and on the tip
diffracted component in the case of the defect being perpendicular to the scanned surface (centre figure). In the case of specular reflection (to the left in Figure 33), the signal is not particularly effected by the background pressure until it becomes 200 MPa with a drop in the maximum amplitude of about 8dB. The amplitude from the tip diffracted signals (middle figure) are reduced to the same amount when the background pressure is 50 MPa and drops down to more than 12 dB below corresponding for the open crack, when the static background pressure is put to 200 MPa. Used frequency has no major impact on the maximum amplitude in signal response as can be deduced from Figure 34. The change in divergence due to used frequency is a plausible explanation to the difference in points where maximum amplitude is received.
~
•
pen crack - - ! 0 pencrack~1~
•
, _ f l P e n c r a c k -j -10i
-10 50MPa ---I j -..
l
00 MPa ---l
~ ->I ~ -m ~ -ID ~o MPfl 00 MP, -"...
...
...
-50 -., -so...
...
...
-'" -", -:>Q -10...
...
-10•
10 '" "..
-«l ,. "..
I'mboeJllQliliaRhNnJ PI'1lbepoailioA Imml
Figure 33: Signal response for a zero degree, 3 MHz compression wave probe in pulse-echo mode. Three different static background pressures have been used and the penny-shaped crack (depth 60 mm and with a diameter of 4 mm) has been given varied tilts: 0° (parallel to scanning surface in left figure), 90° (perpendicular to scanning surface in middlefigure) and 30° (rightfigure).
e 0 .OMhz ::s
1
·\0 .5MHz .OMHz '6. ~ ~ ·20 1.5 MHz ·30 -40 .:;0 -60 .'1\1 -80 ·30 ·20 ·\0 0 10 20 30 Probe pooItion [mm)Figure 34: Signal response as function of used frequency. The compression wave probe (0°) is applied in pulse-echo mode. The static background pressures is 200 MPa and the penny-shaped crack (depth 40 mm, 4 mm diameter) has been tilted 30°.
The previous discussed experimental studies on the subject "impact on detectability due to static background pressure" have mainly dealt with in-service induced cracks such as fatigue cracks. This hence the stress conditions in normal operation that is the basis for crack growth also is one of the reasons for crack closure in shut -down period. A
programme of experimental work to investigate selected manufacturing defects has been undertaken by the CEGB and The Welding Institute, which has been reported in a paper by Denby and Duncumb from 1984 [22]. There were three types of manufacturing defects that were fabricated in specimens, which then were suppressed to a variety of loading sequences giving uniform stress conditions on the defective area. For neither of the three defect types (lack of sidewall fusion, solidification crack and under-clad reheat cracking) or loading conditions (one equal to 90% of the yield stress) could any major impact on the detectabilty be deduced. This result embodies both impacts on the reflected wave component as well as the influence on the tip-diffracted signal. As has been mentioned before, one of the large scale round robin trials that was a consequence of the PISC I outcome, was the Defect Detection Trials (DDT) exercise organised by the Risley Nuclear Laboratories of the UKAEA. The main objective of this action was to compare the defect detection and sizing performance of different kind of ultrasonic inspection techniques. One of the participants was CEGB [28], and their results measured on fabricated fatigue cracks has together with the Wooldridge and Steel documentation [23] been used by Denby and Duncumb [22] to predict the detectabilty of fatigue cracks under normal shut-down conditions.
Two different reflectors are generally used to measure the bandwidth and the beamwidth of a transducer. A quasi-infinite plane (half-cylindrical objects) normal to the axis of the beam is used to measure the pulse in time and convert it to information of its frequency content. When information of the beam is to be obtained a small target such as a disc or a ball shaped defect is often used to characterise the geometry of the beam. The
differences in the beam characterisation induced by using different shaped targets are emphasised when using a focused transducer. De V adder et al describes, in a paper from 1990 [29], a new defect to be used for the beam characterisation. When a cone is used it only diffracts the signal (if the angle is modest) and the apex is in the paper proven to act more or less as a point source. In Figure 35 the shape of the different received time pulses has been compared when a sphere, a disc and the Conical Reference Diffractor (CRD) has been used as target.
Amplitude arbitrary units
o
-sphere -disc l~ Amplitude arbitrary unitso
-sphere Time l~o
Amplitudearbitrary units -sphere
-cone
derivated
Time
IIJ.S
Figure 35: Comparison of the shape of signals scattered by a sphere 02 mm, a disc 0
The historical use of artificial reflectors such as side-drilled and flat-bottom holes or notches is being replaced by use of actual fabrication or in-service induced flaws which
display an acoustic response more typical of those encountered in practise. In a paper by
Edwards et al from 1995 [30] the difficulty to produce relevant fatigue cracks is discussed. The production of manufacturing a relevant fatigue crack invokes the problem of specifying what kind of loading history the crack should be provided with. As discussed previous in this paper the crack opening and the crack surface condition depends on whether the load has been high- or low cycled. Even if the loading history of the object is known the relevancy of the artificial fatigue crack then becomes fixed to a specific object and for a specific time of inspection. This is also due to the fact that the crack most often has to be induced into the object that simulates the geometry of the object to be inspected. The weld-solidification technique to produce cracks in ferritic steel enables a defect production without implanting any coupon which tends to
introduce satellite defects and a signal response that can be used to identify a change in material properties. In ferritic steel the weld-solidification technique produces cracks that are very close to TGSCC in a morphological sense while it produces cracks in austenitic stainless steel that that more closely simulate the IGSCC morphology than do thermal fatigue cracks. Besides the identification of the weld-solidification crack by studies of micrographs the study also includes a comparison of the signal response (A-scan) from a IGSCC, a weld-solidification crack, a thermal fatigue crack and a
mechanical fatigue crack all situated in an austenitic test piece. Based upon the comparison in Figure 36 the authors conclude that the weld-solidification crack is almost as difficult to detect and size as the IGSCC.
1 - IGSCC
2 - WS crack
o
s
10s
103 - TF crack
4 - MF crack
o
s
10o
s
10Figure 36: Comparison of corner-echo response from a: IGSCC (1), Weld-solidification crack (2), Thermal fatigue crack (3) and a Mechanical fatigue crack (4). The probe was a 45° shear wave probe in pulse-echo mode.
3.3 Radiography
The radiographic technique is based on the generation of penetrating radiation (x-rays or gamma-rays) and some registration of the radiation intensity behind the object of
interest. This providing a two dimensional projection of the mass-density within a three dimensional volume. This basic principal is not only valid for conventional radiography but is the foundation also for three dimensional reconstructions such as tomography and tomosynthesis. The most important quality factor, that influences the detectability and sizing capability which could be affected by defect parameters, is the contrast
constituent. The contrast is essentially a measurement of projected differences in density between defects and their surrounding material. Another important factor is the degree of unsharpness (blur) which could be defined as the gradient of the contrast.
The intensity of a beam of x-rays or gamma-rays undergoes local attenuation as it passes through a specimen, due to absorption and scattering of the radiation. The quality of the radiograph can be severely affected by scattered radiation since it contributes with "nonspecular" projection of density, which could be defined as noise. The most
radio-opacity of the specimen and defect and the angle between the volumetric extension of the defect and the direction of projection. The defect shape and position within the object correlated to the source and detector are also very essential parameters.
If the crack is postulated as a rectangularely shaped void the detectability of the crack can be deduced from the increase in "brightness" caused by the defect:
L\B )1ldf [ Cd sine+wcos9)M ] 0
e
w- = - - <
<arctan-B case Cd sine+wcos9)M + UT ' d
L\B )'Ilwf [ Cd sin e + w cos e)M] w e 180
- = - - arctan-< <
B case Cd sine+wcose)M+ UT ' d
t: thickness of base material y: imaging system parameter
d: depth of defect 11: effective linear attenuation coefficient
w: width of defect f: form factor (0.7 - 0.8)
e:
angle of defect (0 eq. parallel to radiation) M: geometric magnificationL\B: difference in " brigthness" UT: total unsharpness B: "brigthness" of proj. base material
These equations have been validated in an investigation reviewed in a paper by Munro et al from 1989 [31]. The objective of the study was to examine what impact the angle
of shallow (19 to 38 ~m) cracks had on the detectability. The defects were simulated by
the spacing between two shims with specified thickness and the shims were clamped between two plates of steel.
The criteria for detectability in the study were chosen as 1.6% in contrast perceptibility. The validation of the theoretical prediction for maximum angle of visibility as function
of defect depth is visualised in Figure 37. The simulated crack was 38 ~m wide and the
surrounding base material was 13 mm thick steel. The experimental results were recorded with a real-time radioscopic system and the system parameters in the above equation were adjusted in conjunction with this specific system ("(=2.6, ~=0.212, f=0.76,