Research
2010:33
Lineament interpretation Short
review and methodology
Authors: Sven TirénTitle: Lineament interpretation Short review and methodology Report number: 2010:33
Author: Sven Tirén GEOSIGMA AB Date: November 2010
This report concerns a study which has been conducted for the Swedish Radiation Safety Authority, SSM. The conclusions and viewpoints present-ed in the report are those of the author/authors and do not necessarily coincide with those of the SSM.
SSM Perspective
This report concerns a study which was initially conducted for the dish Nuclear Power Inspectorate (SKI), which is now merged into the Swe-dish Radiation Safety Authority (SSM). The conclusions and viewpoints presented in the report are those of the author and do not necessarily coincide with those of the SSM.
Background
In the characterization of a site that may have potential for hosting a repo-sitory for spent nuclear fuel at depth in crystalline bedrock, it is essential to understand the existent framework of brittle deformation zones in the bedrock. These zones have affect on groundwater transport and the hydro-chemistry in the bedrock and the rock mechanical properties.
The ground comprises the solid and continuous surface of the Earth. By using remote-sensing techniques applied for structural analysis of the ground surface, it is possible to map features in the terrain that are related to bedrock structures provided that the topography of the bedrock surface is not totally concealed below a cover of soil or other lose material. Even though the sedimentary cover is relatively thick it may be distorted and the ground surface displaced by late faulting in the basement rock.
Source data for studies of lineaments consist of information on the topography (e.g. topographical maps, aerial photos, elevation data, multi-spectral sensing, laser, radar and thermography) and geophysical data (e.g. airborne geophysical data comprising magnetic, electromagnetic, radia-tion measurements, and gravimetric measurements).
Purpose
The purpose of the current project is to review the concept “Lineament” and present a lineament interpretation procedure. The interpretation of lineaments should be made in steps: a. Interpretation of each data set/ima-ge/terrain model is conducted separately; b. Compilation of all interpreta-tions in a base lineament map and classification of the lineaments; and c. Construction of thematic maps, e.g. structural maps, rock block maps, and statistic presentation of lineaments. Generalisations and extrapolations of lineaments/structures may be made when producing the thematic maps.
Results
The outcome of the study is mainly a discussion of the basic concept of li-neaments and lineament interpretations but only touches on the technical aspects of image processing and data codes for lineament interpretations. Effects on SSM supervisory and regulatory task
In the forthcoming review of SKB’s application to build a repository for spent nuclear fuel it is important for SSM to have knowledge of the ex-istence of brittle deformation zones in the bedrock because these zones have affect on groundwater transport and the hydrochemistry in the bedrock, and the rock mechanical properties. These characteristics are important for the long term safety of the repository for spent nuclear fuel. Project information
SKI reference: SKI 2006/691/200609024 and SKI 2006/690/200609025
Table of
Contents
Abstrakt ... 2
Abstract ... 3
1. Introduction ... 4
2. General introduction of concepts and nomenclature ... 5
3. A short review of the concept “Lineament” ... 7
4. Lineament interpretation ... 11
4.1 Base data /Source data ... 11
4.2 Interpretation techniques ... 15
4.3 Thematic maps ... 19
Lineament statistics ... 20
Abstrakt
Markytan är den kontinuerliga yta som bildar jordklotets yttre form. Den kristallina jordskorpan, berggrunden, kan gå i dagen eller vara övertäckt. Bergytans morfolo-giska form återspeglar en kombination av tektono-metamorfa-magmatiska processer (uppbyggande) och vittring/eroderande processer (nedbrytande). Markytans form styrs av bergytans form och fördelningen av lösa sediment.
Genom att tillämpa strukturgeologisk fjärranlys baserad på topografisk och geofysisk information, dvs. att utföra en lineamentstolkning, är det möjligt att kartlägga former som kan knytas till underliggande berggrunds strukturmönster om inte bergytans form är helt dold under lösa jordlager. Förekomst av sena rörelser i berggrunden återspeglas genom störningar i jordlager och förskjutning av markytan.
Studier av relationen mellan topografi och underliggande berggrund startade för mer an 150 år sedan. Hobbs (1903, 1912) införde det grundläggande begreppet ”linea-ment”, vilket han först beskrev som “signifikanta linjer i jordklotets yta” varefter han senare framlade att de var “lineära topografiska former som återspeglar den dolda strukturuppbyggnaden i underliggande berggrund”. När flyggeofysiska mätningar påbörjades för cirka 50 år sedan kom dessa mätningar att komplettera den topogra-fiska lineamentsanalysen för att karaktärisera berggrundens strukturmönster.
Underlagsdata vid lineamentstudier är topografisk eller flyggeofysisk information. Den topografiska avbildningen av markytan kan bestå av t.ex. topografiska kartor, flygfoton, höjddata, multi-spectraldata, laser, radar och termografisk data. Det geo-fysiska underlaget för lineamentstolkning kan bestå av t.ex. flyggeofysika mätningar av de magnetiska och elektromagnetiska fälten, strålningsmätningar samt gravimet-riska mätningar.
Resultat av en lineamentsstudie beror på områdets geomorfologi, typen av under-lagsdata, sättet att nalka sig studien och systematiken i studiens genomförande, samt skickligheten hos den som utför tolkningen. Bilder och modeller vars innehåll är beroende av ”belysningsriktning” skall studeras med minst fyra olika belysningsrikt-ningar för att eliminera skevheten som annars kan uppstå i kartläggningen av linea-ment. Vid analys av lineament skall upplösningen i underlaget utnyttjas optimalt och extrapoleringar bör undvikas vid den inledande lineamentstolkningen. För alla strukturer som kartläggs skall det finnas full täckning för i underlagsdata.
En lineamentstolkning bör göras stegvis: a. Tolkning av varje underlag (bild/
/mätdata/modell) var för sig; b. Sammankoppling av alla lineamentstolkningar till en tolkning, bastolkningen, och därefter en klassifikation av lineamenten; och c. Utgå-ende får bastolkningen arbetas tematiska kartor fram som t.ex. strukturkartor eller blockkartor. Lineament presenteras statistiskt. Generaliseringar, extrapoleringar och interpoleringar kan göras i samband med framställningen av tematiska
kar-tor/modeller.
Vid framställningen av tematiska kartor skall all föreliggande information beaktas om berggrunden och dess särdrag, geomorfologiska formers ursprung och mänsklig påverkan på området. Tolkade tektoniska strukturer bör kontrolleras i fält.
Abstract
The ground comprises the solid and continuous surface of the Earth. The crystalline crust, i.e. bedrock, is exposed or covered with sediments and vegetation. The mor-phology of the ground surface is influenced by a combination of
tectono-metamorphic-magmatic processes (building up) and denudation/erosion processes (tearing down). Landforms are related to these processes and the character of the bedrock (lithologies and structures), and the distribution of soil or other unconsoli-dated, superficial material.
By using remote-sensing techniques applied for structural analysis of the ground surface, it is possible to map features in the terrain that are related to bedrock struc-tures provided that the topography of the bedrock surface is not totally concealed below a cover of soil or other loose material. Even though the sedimentary cover is relatively thick it may be distorted and the ground surface displaced by late faulting in the basement rock.
Studies of the relation between structures in the bedrock and the topography started more than 150 years ago. Hobbs (1903, 1912) introduced the fundamental concept of “lineaments” and described them as “significant lines in the Earth‟s face” and later he concluded that they are “lines in the landscape which reveal the hidden architec-ture of the basement”. When airborne geophysical measurements started approxi-mately fifty years ago such data were used to compliment the topographical interpre-tation of basement structures.
Source data for studies of lineaments consist of information on the topography (e.g. topographical maps, aerial photos, elevation data, multi-spectral sensing, laser, radar and thermography) and geophysical data (e.g. airborne geophysical data comprising magnetic, electromagnetic, radiation measurements, and gravimetric measurements).
The outcome of a lineament study depends on the terrain in the investigated area, the source data, the approach and systematic performance in the interpretation, and the skill of the interpreter. Images and digital terrain models that display the relief of the studied area should, if possible, be illuminated in at least four directions to reduce biases regarding the orientation of structures. The resolution in the source data should be fully used and extrapolation of structures avoided in the primary interpre-tation of the source data.
The interpretation of lineaments should be made in steps: a. Interpretation of each data set/image/terrain model is conducted separately; b. Compilation of all interpre-tations in a base lineament map and classification of the lineaments; and c. Construc-tion of thematical maps, e.g. structural maps, rock block maps, and statistic presenta-tion of lineaments. Generalisapresenta-tions and extrapolapresenta-tions of lineaments/structures may be made when producing the thematical maps.
The construction of thematical maps should be supported by auxiliary information (geological and geomorphologic data and information on human impact in the area). Inferred tectonic structures should be controlled in field.
1. Introduction
In the characterization of a site that may have potential for hosting a repository for spent nuclear fuel at depth in crystalline bedrock, it is essential to understand the existent framework of brittle deformation zones in the bedrock. These zones have affect on groundwater transport and the hydrochemistry in the bedrock, and the rock mechanical properties.
The ground-surface represents a continuous surface. The topography is related to the thickness of the soft sediments that cover the bedrock, and the morphology of the bedrock head. When this is possible the character of the bedrock can “look trough” the sedimentary cover. It can be investigated by remote sensing techniques (see defi-nition below), go through surface investigations such as geological field mapping, and geophysical investigations, and may be followed up by surface-based sub inves-tigations of the bedrock (e.g. borehole invesinves-tigations) before going underground. The present study concerns structural interpretations based on remote sensing.
What do topographical features observed from a distance represent? In many cases it is an interpretation, based on “professional judgement”1
. However, the interpretation can be more or less qualified depending on the resolution of the observed object and the view (the contrast of the feature related to its surroundings), and the skill and the scientific competence of the observer to identify features.
The reproducibility of a lineament interpretation should always be checked and thereby diminish the “subjectivity” in the interpretation (cf., Wise, 1982 and 1983, Wheeler, 1983). This could be performed by comparing investigations carried out on different scales and/or when overlapping sources of information are being used. Support by an automatic “computer-based” lineament interpretation could well be used. However, a lineament study “performed by hand” is a learning exercise, to get to know the area and the type of topographical features that may have a tectonic rel-evance and how such features are geometrically related. Such experience is of im-portance when transforming a lineament interpretation into a structural map. A hand-drawn lineament is shaped by the hand and, mostly, organically follows the image in its characteristics. This involves curvature and enhances a dynamic picture and a thematic interpretation.
The objectivity of this study is twofold: 1. Review of the concept “Lineament”.
2. Present a lineament interpretation procedure.
1 Professional judgement is the ability of a single person or a team to draw conclusions, give opinions and make
interpre-tations based on experiments, measurements, observations, knowledge, experience, literature and/or other sources of information. In this definition, professional judgement is based on facts and objective evidence as well as experience, which includes some subjectivity. Professional judgement relates mainly to non-routine operations (e.g. research, product development) and it is expressed as: opinions on the technical results (merits and drawbacks), interpretation of results, and recommendations for how to use them, and guidance for improvement. (Position paper 6, Sept. 1998, Nordic Inno-vation Centre, http://www.nordicinnoInno-vation.net/_img/position_paper_61.pdf).
This study mainly discusses the basic concept of lineaments and lineament interpre-tations but only touches on the technical aspects of image processing and data codes for lineament interpretations.
This report is the result of a contract (Ref. SKI 2006/690/20060925) from SKI (Pro-ject Manager: Fritz Kautsky) for a general discussion of the lineament concept.
In Appendix 1, SKB‟s method descriptions for lineament interpretations are dis-cussed, and in Appendix 2, a short review of regional lineament interpretations per-formed in central and southern Sweden is presented.
2. General introduction of concepts and
no-menclature
Discussion of concepts may be very abstract unless the reader is not well acquainted with the used nomenclature. A presentation of the basal nomenclature and a presen-tation of the lineament concept at an early stage may help.
Topography is “the configuration of the contours of any surface, i.e., the detailed
shape of the surface. The term is used in geology for the contours of the Earth‟s sur-face”2
.
Relief is “the changes in terrain; elevations or depressions in the land” 2. “The relief
expresses the amount of deviation of the actual, physical surface of a region from the surface used as reference. The usual surface to which relief is referred is the geoid, the rotational ellipsoid (spheroid), the sphere or the plane” 3
. A plane is used for more local areas where the geoid can be approximated with a plane. This definition is used here to distinguish between relief and topography. The relief describes the general unevenness of an area.
Geomorphology is the “branch of physical geology (geography) which deals with
the form of the Earth, the general configuration of its surface, and the changes which have taken place, have a place in the evolution of land forms”3, cf. “landform”. Pro-cesses cause landforms, but landforms affect proPro-cesses.
Terrain is “a tract or region of the Earth‟s surface considered as a physical feature,
an ecological environment or a site of some planned activity of man, e.g. an engi-neering location; or in terms of military science, in „terrain analysis‟”. 4
Terrane, on the other hand, is “a fault-bounded body of regional extent,
character-ized by a geologic history different from that of contiguous terranes or bounding continents. A terrane is generally considered to be a discrete allochthonous fragment of oceanic or continental material added to a craton at an active margin by accre-tion.”4
2http://www.maps-gps-info.com/maps-gps-glossary.html 3 Glossary of the Mapping Sciences, 1994.
Landform is “(1) the shape into which the Earth‟s surface has been sculptured by
natural forces. (2) One of many features which taken together, makes up the surface of the Earth. The term includes all such broad features as hills, valleys, slopes, can-yons, arroyos, alluvial fans, terraces, and glacial deposits (e.g. eskers and drumlins). Most of these features result from erosion and resistance to erosion. The term also includes all features resulting from sedimentation and from movements within the crust”. …”Note that the definition applies not only to features on land but also to features under water, e.g. submarine canyons.” 5
Landscape is “the distinct association of landforms, especially as modified by
geo-logical forces that can be seen in a single view, e.g. landscape.” 5
A process is defined as an "action involved when a force induces a change, either chemical or physical, in the materials or forms at the Earth's surface. Two types of processes occur: a) Exogenic, - "Outside", processes working on the surface to bring it to a common level; and b) Endogenic, - "Inside," processes generally operating within a planetary body acting to displace material.” 6
Erosion is here used as “the general process or group of processes whereby the
ma-terial of the Earth‟s crust are loosened, dissolved, or worn away, and simultaneously moved from one place to another by natural agencies, which include weathering, solution, corrosion, and transportation, but usually exclude mass wasting; specifical-ly the mechanical destruction of land and removal of material (such as soil) by run-ning water (including rainfall), waves and current, moving ice or wind. The term is sometimes restricted by excluding transport (in which case “denudation” is the more general term) or weathering (thus making the erosion a dynamic or active process only). “7
Soil can be defined as: a) “ loose, unconsolidated material on the surface of the Earth
(geomorphological), b) the natural medium (weathered rock detritus) for the growth of plants (Soil Science), c) all unconsolidated materials above bedrock (Engineering/ Environmental), and d) good or bad for growing crops (water retention, resistance to erosion, nutrient content)(Agricultural).”8
Remote sensing in a general sense encompasses all the techniques used “an object
without touching the object; detecting or inferring the properties of an object without touching the object; detecting, sensing and/or inferring the properties of an object which is far from the detector or sensor.”9 In the case of structural interpretation of the bedrock the sensor is carried by an airplane or a spacecraft (the carrier is called platform). The recorded properties are generally processed and presented as models describing different characteristics of the object.
Remote sensing is somewhat related to Terrain analysis which is “a study of the natural and man-made features of an area as they may be expected to affect to mili-tary operations”.7
In other words, the military interest in producing detailed maps is
5 Glossary of the Mapping Sciences, 1994.
6 http://www.public.asu.edu/~arrows/geomorph/glg362--secondlecture.htm 7 Jackson, 1997.
8http://www.public.asu.edu/~arrows/geomorph/soilswebpage.htm 9 Glossary of the Mapping Sciences, 1994.
obvious and the lineaments represent tracks along which troop-transport can take place and they have an importance for the logistics. 10
A model is "a working hypothesis or precise simulation, by means of description, statistical data, or analogy, of a phenomenon or process that cannot be observed di-rectly or that is difficult to observe didi-rectly.” 11
Modelling comprises an initial stage of data manipulation (e.g. sorting, discrimination and classification) and organization (e.g. formatting, storage of uniform data in reference files) and a subsequent stage of correlation and extrapolation of data within the model space (Tirén et al., 1999).
In general, visualization is fundamentally a translation from computer representa-tions (such as tables and data sheets) to understandable representarepresenta-tions, including the choice of encoding techniques to maximize human understanding and communica-tion. In other words, scientific visualization is concerned with exploring data and information in such a way as to gain understanding and insight into the data. In geo-scientific work, visualization techniques are used to analyse and display large vol-umes of data to extract significant features (Tirén et al., 1999).
A lineament (defined in more detail in the following chapter) is an interpreted line (“one dimensional”) drawn in relation to linear to semi-linear terrain forms, e.g. val-leys and slopes. The general question is the geological implication of the linear ter-rain pattern displayed on a lineament map. Are the lines just surface structures, or do these surface structures relate to structures in the underlying bedrock? If the latter is the case, what are the characteristics for such geomorphologic features that reflect the structural character of the underlying bedrock? The criterion for drawing a line-ament and its location is described (see below).
Topographical data is fundamental in the mapping of lineaments. Geophysical data is usually used to support the correlation between terrain features and the character of the underlying bedrock. In general, regional geophysical data (airborne geophysi-cal measurements; started, e.g. at the Swedish Geologigeophysi-cal Survey in 1960) have a systematic and continuous area-coverage, while the bedrock is more or less covered by soft sediments. Regional geophysical data can be used as an analogue to topo-graphical information to interpret geophysical lineaments. Lineament interpretations based on both topographical and geophysical data are needed in the characterizations of a site as they compliment each other. The topographical data may consist of, e.g. topographical maps, aerial photos, laser and radar data, satellite images and elevation data. Geophysical data may consist of, e.g. airborne magnetic, electro-magnetic, radiation and gravity measurements. Complementary geophysical measurements in areas covered by the sea may consist of, e.g. echo sounding, multi-mode sonar sys-tem, reflection seismics and side-scanning sonar.
3. A short review of the concept “Line
ament”
The study of lineaments has its origin in Great Britain where systematic mapping of fractures were performed in the beginning of the 19th century. A correlation between orientation of mapped fractures and landforms was noted, and further, that faults
10 Cameron 1998. Cf. http://www.worldcatlibraries.org/search?q=su%3AMilitary+geology.&qt=hot_subject 11 Bates and Jackson, 1980.
have relatively constant orientations over large areas and the pattern of fractures has a tendency towards orthogonal symmetry.
The first to describe the relation between fracture density, faults, mineralized veins and topographical features as valleys and ridges in a “lineament map” was Hopkins in 1841. However, while mapping and classification of fractures continued, no fur-ther “lineament maps” were produced until 1879 when Daubree found good use for detailed topographical maps in geological mapping. He found that fractures control the erosion of the rock and thereby the landforms, e.g. the relation between the drainage system and the fracture configuration in bedrock. Kjerulf (1880) made the same type of direct observation of the relation between geomorphical features and the fracture pattern in the bedrock in southern and central Norway. 12
In 1903 Hobbs used a similar approach in his basic work “Lineaments of the Atlantic border regions” where he introduced the term Lineament. He described lineaments as “significant lines in the Earth‟s face” and stated that the more important linea-ments are: crests of ridges or boundaries of elevated areas, drainage lines, coast lines and boundaries of geological formations of petro graphic type or lines of outcrops. Hobbs had a few years earlier (1901) described patterns formed by the intersection of different sets of faults and how faults outline “Orographic Blocks” (rock blocks) of different orders and that larger scale blocks were subdivided by fractures into sub-blocks. The geometry (symmetry) of the blocks was found to be related to the num-ber of fracture sets and the spatial distribution of fractures of each set giving “orderly and disorderly fracture fields”.
In 1911 Hobbs reinterpreted for instance Kjerulfs observations from 1880 and in 1912 wrote”significant lines in the landscape which reveal the hidden architecture of the basement are described as lineaments”. By this, a distinction is made, be-tween a classification of surface structures reflecting the structural network in the basement rocks and others that do not. This distinction of different types of linear landform features is crucial as it implies a genetic interpretation: what processes have created the observed terrain features?
In many of the following investigations, comprising structural studies of landforms, the usage of the term lineament is defined and generally implies that landforms are related to features in the underlying bedrock (cf. El-Etr, 1974) in agreement with Hobbs definition from 1912. Several other terms related to landforms, however, such as linears, linear trends and linear features13 have been used. Most users of these terms also relate to these linear terrain forms, including alignment of outcrops, to basement structures. Dennis (1967) commented that the use of the term linear is as-sociated with an uncertainty in the origin of the feature and also that linears are of
12 The same area was later on remapped by Ramberg et al (1977).
13
Cf. El-Etr (1974) and O´Leary et al. (1976).There is also a more loosely defined concept:
form line, form-line or form line. Form lines displayed on a geological map are traces of surfaces such as the foliations in metamorphic rocks and layering in sedimentary rocks. A
form line is “a line (usually broken) on a map, sketched or drawn by visual observation, depicting the general surface configuration or shape of the terrain without regard to a true vertical datum and regular spacing and usually without indicating elevations: an uncon-trolled or interpolated contour line, or one that is not instrumentally or accurately sur-veyed..” (Jacksson, 1997)
more local extent than lineaments. The regional extent of lineaments was also em-phasized by, e.g., Hills (1972), Hobbs et al. (1976) and Ramsay and Huber (1987).
O´Leary and Friedman (1978) remark that classification of lineaments “based on size or length of linear features has the appeal of precision and high definition, but the weaknesses are considerable. The classification itself is arbitrary and until we obtain some knowledge of the geological meaning of length or size, such a classification may be misleading. Size is morphologically accidental; it has little or no genetic importance and arises from a variety of effects including climate, which cannot be evaluated or sorted out without detailed groundwork. A classification based on size is not practical since we usually can not unequally identify endpoints of linear fea-tures on images”. They presented a classification and hierarchy for:
a) a total population of lines, which may be characterized statistically by con-ventional techniques for “trend” of orientation, length and distribution, and b) well-defined sub-classes of features, defined during the mapping procedure,
which may be treated separately as geological entities.
Three classes of linear features were defined by O´Leary and Friedman (1978): 1. Lineaments: A map able (at 1:25 000 and smaller scales), simple or composite
linear feature of a surface, the parts of which are aligned in a rectilinear or slight-ly curvilinear relationship, and which differs distinctslight-ly from the pattern of adja-cent features and presumably reflects a subsurface phenomenon.
2. Alignment: An interpreted line which joins aligned linear or non-oriented fea-tures separately by relatively great distance (i.e., the spacing are equal to or greater than the length of the features) and which passes through or abuts those features, such as tributary junctures, bunched meanders, volcanoes, dikes, ridge offsets, magnetic anomalies, etc. The features in alignment are distinct from the pattern of the surrounding surface.
3. Line: A linear feature geometrically recognizable but with uncertain physio-graphic expression, i.e., possibly cultural, meteorological or, if physiophysio-graphic, defined by changes in tone or terrain pattern such as that definite placement of a border line is not possible. It may represent a zone rather than a line.
(They add that a similar scheme can be made for strongly curved features.)
The hierarchy of linear features was defined by O´Leary and Friedman (1981) as,
Known – lineament coincident with mapped structure (fault, fracture zone, contact,
dyke, etc.).
Presumed continuous – lineament coincident with mapped structures (and/or with
inferred projected structures) .
Presumed existent – lineament not coincident with mapped structures (but where
coincident with subsurface geophysical discontinuity, appropriate symbols, such as “mag.” Or “grav.” should be added).
Inferred continuous – alignment not coincident with mapped structures (but with
inferred projected structures).
Inferred existent – alignment not coincident with mapped structures (but where
coincident with subsurface geophysical discontinuity, appropriate symbols, such as “mag.” or “grav.”should be added).
subsurface geophysical discontinuity, appropriate symbols, such as “mag.” or “grav.” should be added).
Notable is that this classification considers interpreted structures based on, e.g., borehole data (coincident with mapped structures and/or with inferred projected structures). The hierarchy of a linear feature increases with increasing general knowledge of the area, i.e. when complimented with other geo-investigations such as field mapping and geophysical investigations. This is an essential point as in the early days of lineament investigations, the studies were associated with field-mapping activities. The rock is generally best exposed along cliffs and in streams, topographical features that outline lineaments. Present-day lineament interpretations are in many cases a free-standing study, restricted to the remote-sensing part of the study and often comprising analysis of both topographical and geophysical data, and the basis for the interpretative transformation of lineaments into tectonic structures may not always be transparent.
Latterman (1958), in a lineament study based on aerial photos, pointed out that it is a matter of resolution14 what type of structures shall be denoted a fracture or a linea-ment. He wrote that “after fracture traces are mapped, and individual photographs are compiled into a mosaic, some of the fracture traces may become parts of linea-ments. This is known to occur, yet does not seem a serious objection to the distinc-tion between these two terms because by far the majority of fractures do appear to be parts of lineaments”. By this Latterman indirectly pointed out that what can appear as a continuous feature on one scale may on a smaller scale appear as a set of uncon-nected fractures or a system of conuncon-nected fractures. This may be of importance for understanding observed structural features in an area, e.g. the occurrence of linear domains with increased density of tectonic features. He also pointed out that there is a distinction between direct remote mapping of discrete fracture patterns in fully exposed outcrops and mapping of structures such as lineaments (cf. classification of linear features above - differs distinctly from the pattern of adjacent features). Still, this may be a matter of scale as the vegetation in discrete fractures may consist of, e.g. grass or herbs, and in features outlining lineaments the biotope15 may differ from the surrounding areas.
It was early found (about 1900) that the lineament patterns have a somewhat univer-sal geometry with lineaments occurring dominantly in four orientations: N-S, NE-SW, E-W and NW-SE. However, it is not fully apparent if this is related to the intel-lectual preferences of symmetry related to a fix reference system (the compass rose) or not, as areas occur where the orientation of the lineament pattern is shifted/rotated east- or westwards. This relationship was more generally described as that the sur-face of the Earth‟s crust generally display two to four sets of lineaments (e.g. Gay, 1973), with angles of 45-90° between sets (Nur, 1982).
Hodgson (1974) pointed out that “Hobbs can truly be said to be the father of modern lineament studies”. What have been considerably developed since 1912 16
, are the
14 Latterman (1958) expressed that ”the term ‟fracture trace‟ is used in preference to ‟fracture‟ because, except where
bare rock is exposed and joints are mapped directly on the aerial photos, the feature mapped may be the indirect expres-sion of a joint or small fault, and not a true fracture directly”
15 “A natural region or geographical space that presents relative uniformity of physical characteristics and animal/plant
populations which inhabit it” (www.aquahobby.com/articles/e_glossary.php).
16The discussion of the relation between topography and brittle structures in the bedrock was a part of the geological
techniques to reproduce the topography and area-investigations that reveal the geo-physical character of the bedrock, and, of cause, the techniques to model and inter-pret such information.
4. Lineament interpretation
4.1 Base data /Source data
The resolution in the source data is a limitation in structural interpretation of land-forms. This limitation is related to the remote-sensing techniques used, and the auxil-iary information (e.g. geological data, maps and field observations) that can support the interpretation.
Initially the base data for lineament studies were direct observations of the landscape and topographical maps. The striving for enhancement of quality of topographical information/maps has been supported from both the community and the military17. In general, the military has been the generator and the society uses the benefits (alt-hough some military data are classified).
Initially, topographical maps were used in lineament interpretation and the quality of these maps increased with time. The introduction of aerial photos and later on satel-lite images were important steps. The remote-sensing data used in geology and engi-neering geology are, e.g. aerial photos, elevation data, topographical maps, multi-spectral sensing, laser18, radar19 and thermography (cf. Table 1). Airborne geophys-ical data comprise magnetic, electromagnetic, radiation and gravimetric measure-ments. The different remote-sensing techniques provide data of different types, dif-ferent scales or resolution and variable geometrical quality (e.g. aerial photos). In-formation such as satellite images and aerial photos give a rendering of the Earth‟s surface while geophysical measurements may display features in the ground not out-cropping at the surface but occurring at some depth. Most, if not all, remote-sensing data are, today, in digital format, Table 1 and Figure 1. The possibilities to manipu-late the base data have much improved with the digital revolution; e.g. change col-our palettes with varying resolution in different segments of a population (e.g. at different altitudes), the possibility to filter data and to enhanced certain features (e.g. gradients, edges). This implies that the different types or characteristics of the ob-ject (related to the wavelength) can be enhanced or smoothed out. This is made to get information about both small-scale and large-scale features. However, these in-creased possibilities may result in an overwhelming amount of labour which may not improve the result in proportion to the effort.
17Cf. Cameron, 1998, Collins, 1998, Elmquist et al., 2001, Sjövall, 2002.
18 E.g. Lidar (LIght Detection And Ranging) is capable of seeing through vegetation cover an thus produce high resolution
and accuracy Digital Elevation Models (DEMs). What can you do with LIDAR? – a. Measure distance, b. measure speed, c. measure rotation, and d. measure chemical composition and concentration.
19 E.g. SAR and InSAR, Synthetic Aperture Radar and Interferromentric dito. Cf. InSAR Workshop Summary Report, Oct.
Table 1. An example of the relation between scale of analysis, feature size, morph tectonic elements, type of data and ground resolution (Dehandschutter, 2001). Cf. also IAEG (vol. 24,1981, p. 185-226).
Figure 1: Main tasks associated with digital terrain modelling. In Dehandschutter (2001) after Hutchinson and Gallant (1999), to the right. Terrain models based on (right): mesh (top), ITN (irregular triangular network), pixels and voxels (bottom).
In many investigations remote studies are performed in an initial phase of a site characterization and also form the basis for the planning of further investigation.
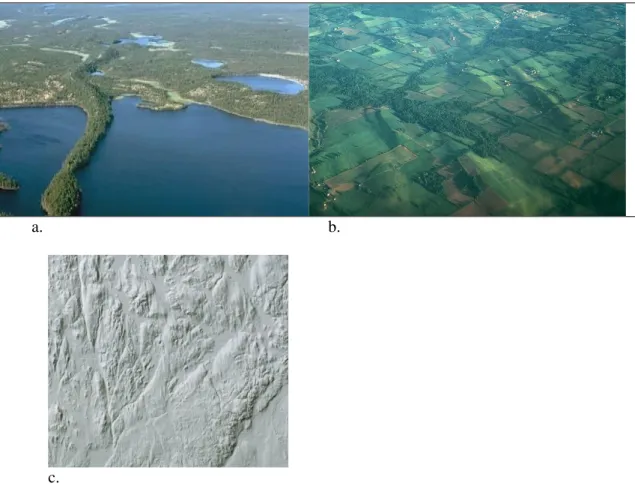
This implies that the amount of available auxiliary, supporting data as, e.g. bedrock map, petro physical data on rock types, map of the sedimentary cover, thickness of the sedimentary cover may vary strongly, etc. Even if such data are available the lineament interpretation should be checked in the field, Figure 2.
a. b. c. d. e. f. g.
Figure 2. Lineament interpreted based on four types of source data and a field check of the related basement structure (Tirén et al., in prep): a. Relief map (elevation data, grid 50m, 7.8km by 12km), b. Ekolsund area (size of map is 9.5km by 6.5km)(motorway E18 and bridges across Ekolsund) located c. 15km east of Enköping, c. aerial photo (c. 1000m by 700m), d. orientation of fractures mapped along the lineament (Schmidt net, lower hemisphere projection, N=62), e. detailed topographical map (contoured every 1m), f. three-dimensional digital terrain model; fault plane along the linea-ment in red; an example of a traceable fracture zones with no surface expression in blue, and g. approximately E-W-trending road cut (southern lane northern side) showing a vertical section (length 50m and maximum height c. 10m ) though the fault that is map able as a lineament. The arrows show the location of the lineament in a-c and e-f.
4.2 Interpretation techniques
A lineament interpretation can be made visually (which discussed in this section) or automatically (mentioned at the end of this section).
The interpretations of lineaments based on topographical elevation data and geo-physical data are in principle similar (the topography considered as a potential sur-face/field). The location of a lineament is mainly identified by:
Change in altitude/level.
Change in gradient.
Change in pattern.
Occurrence of linear minima/maxima.
Displacement of reference20 structures/surfaces.
Note that the level in a geophysical measurement e.g. magnetic or gravity measure-ments reflects a physical property of the rock.
When preparing/processing base data for lineament interpretation the general idea is to enhance the location of minima/maxima as well as changes in altitude level and gradient.
Digital elevation models (DEM constructed from elevation data; grid data or topo-graphical contour lines), digital terrain models (DTM; slope gradient, profile curva-ture and shaded relief maps) and similarly processed geophysical data are generally used in lineament studies. It is found that a full set of shaded relief models should be used, where not only the azimuth of the sun but also its inclination and the vertical exaggeration of the elevation should vary, as information in these models is depend-ent on the direction of illumination. Analogue to DTMs the lineamdepend-ent interpretations based on a single set of aerial photos have a bias due to the position of the sun. This has been verified by using different sets of aerial photos taken at different periods of the year and time of the day. However, aerial photos have a higher resolution than ordinary elevation data bases have and will therefore contribute with more detailed information. On the other hand, on aerial photos a spectrum of information is given including anthropogenic features, while each of the elevation and airborne geophysi-cal measurement data sets gives just a single physigeophysi-cal property of the ground surface or underlying bedrock; the topography, magnetic character, electro-magnetic charac-ter, density distribution, radiation etc.
20 A reference structure or marker is an easily recognizable feature in a body of rock or a rock surface that can be used to
identify distortion in the rock, e.g. slip on a fault plane. The datum plane is any arbitrary level surface used as a reference from which elevation can be reckoned. Of special interest is when a flat datum surface of a uniform age is developed; then the datum surface could be used as a marker and relative distortion of the “datum” surface during a specific time interval can be established (cf. sub-Cambrian peneplain).
Structures in the bedrock that may appear as linear features are of course the contacts between litho logical units that have a great difference in weathering resistance and the intersection between the foliation and the bedrock surface (form lines, see foot-note 15 above), Figure 3.
a.
b.
Figure 3. Examples of form lines: a. In a satellite image (eye altitude c. 59 km) showing intrinsic folding of sedimentary rocks, the more weathering resistant layers stands out as ridges in the landscape, Appalachian, Pennsylvania, USA. Note the cross-cutting minor valleys, lineaments.and b. In a relief map (c. 30x25 km) showing refolded folds in Sveco-fennian meta-sedimentary rocks at Östra Husby, south of Bråviken (bounded by a fault to the north), eastern Sweden.
There are many landforms that are specifically associated with brittle deformation zones (cf. Ramsay and Hubert, 1987), which make it possible to recognize different types of faults (Kelly and Pinter, 1996, Burbank and Andersson, 2001). Also tensile
fracture lineaments occur (Nur, 1982). In the interpretation of topographic data it is of interest to sort out surface features that are accidental and not related to structures in the underlying bedrock. This is not always an easy task. For example, there are several linear or semi-linear features that are related to glaciation such as eskers, linear kames, drumlins, marginal moraines, end moraines and terminal moraines21 , cf. Figure 4. Note that at least some of these features may follow basements struc-tures although they do not represent lineaments. The erosion caused by an inland ice and its system of sub-glacial floods may enhance or smooth out the bedrock relief. However in low and flat areas the effect of the inland ice on the geomorphology is mainly local.
a. b.
c.
Figure 4. Example of linear landforms formed during glaciation: a. Esker, b. drumlins, and c. drumlins displayed in a relief map (c. 37.5km by 32.5km). Note the „string of pearls‟ like feature in the lower left corner. It is an excavated esker. The movement of the ice was from top to bottom of pictures b and c. (For further information about landforms related to glaciation see cf. Benn and Evans, 1998.)
Despite that the direction of the ice should be considered in previously glaciated areas. Other features are anthropogenic, but again, many of these features, e.g. roads, boundary lines and ditches, may be located along topographical features that are related to basements structures.
Interpretations of lineaments are performed in many different ways since the defini-tion of lineaments involves a certain amount of interpoladefini-tion which can be
21 Liverman et al., 2006. This reference contains good examples of large-scale oriented landforms formed during
tive. For example, what separation of indications is acceptable when mapping a line-ar line-arrangement of unevenly distributed outcrops as a lineament? However, it is here preferred that lineaments are drawn as long as they coincide with observed linear or curvi-linear forms or linear arrangement of features. This, to produce a base linea-ment map that may constitute the basis for further interpretation (see section The-matic maps below). It is notable that when a lineament is drawn with good precision, e.g. just follows the linear anomaly indicating the structure, the surrounding minor order structures are enhanced. The lineament interpretation should be thoroughly performed and the full resolution in the source data should be used.
Even though repeated lineament interpretation is in part a learning exercise, memo-rizing the existence of structures, it is preferable that each source data/image22 is interpreted separately. This is done to get information about uncertainties in the posi-tion and length of the lineament. It can also be used as a basis for a classificaposi-tion of lineaments, e.g. they occur at least in five out of six interpretations or three to four out of six interpretations etc.
Lineaments can be drawn by hand on an overlay of an analogue image or on the screen of a computer. Drawing by hand has the advantage in that the lineaments are drawn more quickly and have a more “geological” form. The image can easily be turned around and viewed from different angles and the full image can be observed at the same time as details in the image are being interpreted. Drawing on the screen has the advantage of using the full resolution of the image and that the interpretation is digitalized right away. Processing the images (e.g. change azimuth and inclination of the illumination or exaggeration of the altitude in a DTM) while interpreting may result in a non-uniformly performed study of the area of interest and a lower repro-ducibility of the interpretation.
To start with, a scheme should be established showing where to draw the lineament in relation to, e.g. landforms, landform breaks and changes in the
alti-tude/topographical gradients.
The interpretation procedure is fairly simple. The thickness of the line marking the location of a lineament can be as thin as the thinnest recognizable features. One can start with the most pronounced linear or curvi-linear segments in the image/source data, pick them up and trace them. At the same time the interpreter should look for any significant cross-cutting linear structure at both ends of the traced segment, thus looking for a possible causative relationship between each pair of lines. The linea-ments related to the most pronounced structures give a reference pattern, the geome-try of structures on a large scale23 , which can be used to influence the drawing of minor lineaments. Not to their extent but to their form. This is a subjective part but it may be of importance as interpreting structures is to a great part interpreting pat-terns. This routine of structural analysis of the source data is repeated and linear structures of lower orders are added successively. Continuously the causal relation-ship to other lineaments should be observed. A good understanding of geomorphol-ogy helps to sort out accidental landforms from landforms that could be related to structures in the underlying basement rocks. This could be done by comparing the
22 An image can be defined as a “two-dimensional representation of an object, such as to give a visual impression similar
that of the original object” (Glossary of mapping sciences, 1994).
23 Scale is in geology used to denote size: regional scale – large objects, outcrop scale - small objects. In general, scale
lineament interpretation with auxiliary data giving information about geology and traces of human activities in the area.
The different sets of lineament interpretation are compiled: lineaments that line up and overlap are drawn as a single lineament and lineaments that form narrow clusters of sub-parallel lineaments are represented by a single lineament. The location of such lineaments is checked against the source data. Lineaments, or parts of linea-ments, are classified according to their frequency of appearance on the different base interpretations.
Generalizations should in most cases be based on detailed information/models (high resolution interpretation) and, if performed simultaneously as the lineament interpre-tation is performed, it is more like an interpreinterpre-tation of low resolution.
Transformation of digital elevation data into morphological images and edges-enhanced images has its basis in mathematic morphology. Automatic24 extraction of lineaments can be cost-effective and time-saving when investigating large areas. Such programmes consist of two parts mainly: shape recognition and lineament ex-traction. It is not within the scope of the present study to review such programmes. However, when used such programmes should be tested whether they manage to extract all types of structures that are relevant for the study.
4.3 Thematic maps
The term “Thematic map” is used here in a broad sense and incorporates all types of processing of the base lineament map to show statistics, special characteristics or interpretations.
To construct a thematic map additional information that is not explicitly presented in the base lineament map it is often needed. To produce, e.g. a structural map a general knowledge about the geological evolution of the site or an idea about the structural pattern in the area is essential. The more precise the auxiliary information, the better the structural map.
To help the interpretation of the structural geological history a time sequence of thematic structural maps can be constructed displaying structures (now partly mapped as lineaments) that may have been formed or reactivated in relation to the prevailing regional stress field during different periods.
A map-presentation of lineaments according to their orientation often indicates if lineaments systematically line up along straight or curved lines. Do the lineaments form, e.g. linear cluster domains with a regular separation, or outline lenses, or ir-regular clusters?
A map-presentation of length classes of lineaments may indicate
interfer-ing/overprinting structural patterns of different scales, e.g. pseudo-hexagonal and orthorhombic patterns.
24 During the last 10 years the development of automatic extraction of lineaments has developed rapidly. A browse on the
web, keywords: automatic, lineament, extraction, detection, pattern recognition, digital images, potential-field images, digital terrain model…., cf. Abarca, 2006.
Another thematic map is a rock block map. Block boundaries represent structures that potentially have low cohesion, i.e. have low tensile strength and thereby may be water conductive. In this case the base data is used together with the lineament in-terpretation and the lineaments are classified into block boundaries of different or-ders.
Rock blocks occur on all scales, i.e. large-scale rock blocks consist of many minor-scale blocks. The sub-division of the bedrock into rock blocks is based on several factors regarding:
The character of the demarcation structures/block boundaries, e.g. topographical expression such as length, width, and relative altitude of the base of erosion along these structures, and
The characteristics inside the blocks such as elevation, topographical relief and structural pattern of the ground surface/bedrock head relative to that in the surround-ing blocks.
Construction of rock-block maps is a test of the lineament interpretation in the sense that a rock block has to be circumscribed by block boundaries and thus it also tests the classing of lineaments.
The thematic maps/models should be updated as auxiliary data increase during the progress of a site study.
Lineament statistics
Lineament statistics are generally presented as:
Lineament density maps: All lineaments or selected sets of lineaments; number or total length of lineaments per defined cell area or total length of lineaments tran-secting a cell area.
Density of lineament intersections per defined cell area.
Rose diagrams25 showing the orientation of lineaments: All lineaments, lineament in sub-areas or sub-sets of lineaments.
Lineament statistics can be used to check the structural homogeneity in the rock. Lineament intersections are of general interest regarding the groundwater flow in the bedrock as they indicate the location of potential channels (intersections between two or more deformation zones). When comparing lineament statistics with fracture statistics it should be considered that resolution compared to observation scale most probably differ greatly. Lineaments are generally shorter than the structures they reflect and a lineament is generally formed by a trace of fractures.
25
“Standard rose diagrams are a favourite method of depicting orientationsbecause of their ease of comprehension, but they are known tohave two serious problems. First, arbitrary decisions aboutclass width and starting position can dra-matically alter theresulting diagram, although the degree of variation has beenunderappreciated. Second, when rose diagrams are correctly scaledto the square root of the class frequency, they can be awkwardto evaluate” (Wells,
5. Summary and conclusion
The basic concept of lineament interpretation has remained the same since it was introduced by Hobbs in 1903 and refined in 1912. What do have changed are the remote-sensing techniques and the source data: from visual interpretation of ana-logue maps to automatic interpretation of computer models describing different as-pects of the topography and the physical character of the bedrock. By this the inter-pretation of lineaments may become a still more remote study as larger areas may be included and the field control may become sparser.
The two types of source data used in lineament interpretation, topographical data and geophysical data, complement each other and enhance the quality of the interpreta-tion and the characterizainterpreta-tion of separate lineaments. However, some of the linea-ments may be indicated by only one of the two basic source data. Fore instance, sharp fractures, with restricted displacement and no alteration of the wall rock, may be hard to identify by geophysical methods but may be distinct on aerial photos. The same may hold for gently inclined fracture zones. Deformation zones with altered wall rock26 may have a distinct low-magnetic appearance in the geophysical meas-urements but may, if sealed, not appear as a negative topographic feature. Geophysi-cal measurements have a higher ability to “see through” the soil cover.
Interpretation of lineaments can contain the following elements:
1. Formulation of the approach of the lineament interpretation. 2. Presentation of data sets (parameters, data density, uncertainties).
3. Interpretation of each data set, separately. If possible the data set should be mod-elled in a sequence of sub-models as to avoid orientation
biases27 .
4. The length of a drawn lineament should be in agreement with the size of the feature indicating it.
5. Compilation of all separate lineament interpretations into a single integrated lineament map, a lineament base map. Check the compilation against source da-ta.
6. Control of lineament interpretation against auxiliary information e.g. geological and geomorphologic data and human impact on nature.
7. Classification of the lineaments according to how well and how many times a lineament or a segment of a lineament appears on separate lineament maps (cf. O´Leary and Friedman, 1978).
8. Description of the uncertainty in location and length of lineaments.
9. Display of statistical presentation of lineament data, e.g. rose diagrams, length distribution, and density maps.
10. Interpretation of the lineament base map and conversion into thematic maps, e.g. structures incorporated in the geological map, structural maps showing selected patterns, rock block maps28 .
26 Henkel and Guzman, 1977.
27 To avoid orientation biases, when using relief maps (also aerial photos), illuminations in multiple orientations and
inclinations and varied factors for exaggeration of the relief should be applied. The number of directions of illumination should be at least four, six has also been postulated (e.g. azimuths of illumination: 0, 30, 60, 90, 120, and150°/ Tripathi et al., 2000/. However, azimuths -30 and -60 can be used alternatively to avoid a change in the visual impression of the relief).
28 To construct rock block maps the study should address further characterization of relative altitude and
A lineament interpretation should be followed up by a field check and this is of im-portance for the transformation of a lineament interpretation into a structural map. The results of remote sensing studies can be updated as the general knowledge of an area progresses.
References
Abarca, M., A., A., 2006: Lineament extraction from digital terrain models, case study San Antonio del Sur Area, South-Eastern Cuba. Master of Science Thesis, International Institute for Geo-information Science and Earth observation, Enschede, the Netherlands.
Bates, R. L., and Jackson, J., A., 1980: Glossary of geology. American Geological Institute, Fall Church, Virginia, USA.
Benn, D. I., and Evans, D. J. A., 1997: Glaciers and glaciation. Arnold, London, 734.
Burbank, D. W., and Andersson, R. S., 2001: Tectonic Geomorphology. Blackwell Sciences Inc., Malden.
Cameron, C. P., 1998: Dearly bought ridges, steep access valleys, and staging ground: The military geology of eastern DMZ, central Korean peninsula. In J. R., Underwood, P. I., and Guth, P. L. (Eds), Military Geology in War and Peace. Geo-logical Society of America. Reviews in Engineering Geology, Vol. XIII.
Collins, J. M., 1998: Military geography for professional and the public. Brassey‟s edition, p. 450.
Dehandschutter, B., 2001: Study of the recent structural evolution of continental basins in Altai-Sayan (Central Asia). PhD thesis from the Free University of Brus-sels (VUB), http://users.pandora.be/boris.dehandschutter/PhDcontents.html.
Daubree, A., 1879: Geologie Exprimentale. Libraire des Corps des Points et Chausses, des Mines et des Telegraphes, Paris, 2 vols., p. 828.
Dehls, J.F. & Olesen, O. 1999: Neotectonics in Norway: Neotectonic excursion guide to Troms and Finnmark. NGU Report 99.082.
Dehls, J.F. & Olesen, O. (editors), 1999: Neotectonics in Norway: Annual technical report 1998. NGU Report 99.007.
Dennis, J., 1976: International tectonic dictionary, English terminology. American Association of Petroleum Geologists, Memoirs 7, p. 196.
El-Etr, H., 1974: Proposed terminology for natural linear features. Proceedings of the first international conference on the new basement tectonics, Utah Geological Asso-ciation publication #5. Salt Lake City, Utah, 480-489.
Elmqvist, M., Jungert, E. Lantz, F., Persson, Å., and Söderman, U., 2001: Terrain modelling
and analysis using laser scanned data. International Archives for Phothogrammetry and Remote Sensing, Vol. XXXIV-3/W4, Annapolis, MD, 22-24 Oct. 2001.
Gay, S., 1973: Pervasive orthogonal fracturing of the Earth‟s continental crust. American Stereo Map Co., Salt Lake City, Ytah, USA.
Glossary of mapping sciences, 1994. American Society of Civil Engineerings, Amer-ican Congress of Surveying and Mapping, AmerAmer-ican Society for Photogrammetry and Remote Sensing.
Henkel, H., and Guzman, M., 1977: Magnetic features of fractured zones. Geoexplo-ration 15, 193-181.
Hills, E. S., 1972: Elements of structural geology, 2nd edition. John Wiley and Sons, New York, pp. 502.
Hobbs, W. H., 1901: The Newark system of Pomperaug valley, Connecticut: 21thannual report of the U. S. Geological Survey, 1899-1900, part III, 9-62 and 83-158.
Hobbs, W. H., 1903: Lineaments of the Atlantic border regions. Geological Society of America Bulletin 15, 483-506.
Hobbs, W. H., 1911: Repeating patterns in the relief and in the structure of the land. Geological Society of America Bulletin 22, 123-176.
Hobbs, W. H., 1912: Earth features and their meaning. McMillan, New York, p. 506.
Hobbs, B. E., Means, W. D., and Williams, P. F., 1976: An outline of structural ge-ology. Wiley International Edition, John Wiley & Sons, Inc.
Hodgson, R. A., 1974: Review of significant early studies in lineament tectonics. Proceedings of the first international conference on the new basement tectonics, Utah Geological Association publication #5. Salt Lake City, Utah, 1-10.
Hopkins, 1841: On the geological structure of the Wealden district and of the Bas Boullonais. Transcription of the Geol. Society of London (2nd Ser.), Vol. VII, p. 1-51.
Hutchinson, M. F., and Gallart, J. C., 1999: Representation of terrain. In Longley, P.A., Goodchild, M. F., and Rhind, D. W. (Eds.) Geographical Information System: Principal and Technical Issues, V. 1, Wiley, New York, 105-124.
Jackson, J. A., 1997: Glossary of Geology. American Geological Institute, Alexan-dria, Virginia, USA, p. 769.
Kelly, A. E, and Pinter, N, 1996: Active tectonics: Earthquakes, Uplift and Land-forms. Printice Hall, New Jersey.
Kjerulf, T., 1880: Die Geologie des südlichen und mittleren Norwegan. Authorized German edition by Gurlt, Bonn, p. 350.
Latterman, L. H., 1958: Technique of mapping geological fracture traces and linea-ments on aerial photos. Photogrammetric Engineering, v. 24, 568-576.
Liverman, D., Batterson, M., Bell, T., Nolan, L., Marich, A., and Putt, M., 2006: Digital elevation models from shuttle radar topography mission data – new insights
into the Quaternary History of Newfoundland. Current Research (2006), Newfound-land and Labrador Resources, Geol. Survey, Report 06-1, 177-189.
Nur, A., 1982: The origin of tensile fracture lineaments. Journal of Structural Geolo-gy, vol. 4 No. 1, 3-40.
O´Leary, D.W., and Friedman, J. D., 1978: Towards a workable lineament symbolo-gy. Proceedings of the third international Conference on the new basement tectonics, Basement Tectonics Committee Publication #3, Basement Tectonic Committee, Inc., Denver, Colorado, 29-31.
O´Leary, D.W., Friedman, J. D., and Pohn, H. A., 1976: Linear, lineation, lineation: some proposed new standards for old terms. Bull of the Geological Society of America, v. 87. 1463-1469.
Ramberg, I., Gabrielssen, R. H., Larsen, B. T., and Solli, A., 1977: Analysis of frac-ture pattern in southern Norway. Geoloie en Mijnbouw 56(4), 295-310.
Ramsay, J., and Huber, M. I., 1987: The techniques of modern structural geology. Volume 2: Folds and fractures. Academic Press Inc. (London) Ltd.
Sjövall, M., 2002: Object and feature recognition in a digital model. Swedish De-fence Research Agency (FOI), Scientific report FOI-R- -0499- -SE.
Tirén, S. A., Askling, P., and Wänstedt, S., 1999: Geologic site characterization for deep nuclear waste disposal in fractured rock based on 3D-data visualization. Engi-neering Geology 52, 319-346.
Tirén, S. A., Geier, J., Sträng, T., and Wedholm, K., in prep: Field study of fracture zones in two adjacent road cuts in granitic rock: Comparison with interpreted linea-ments and characterization of internal structural variability. Ekolsund/Grillby area, Uppland, south-central Sweden. Swedish Nuclear Inspectorate, report SKI 07-XX.
Tripathi, N. K., Gokhale, K.V.G.K, and Siddinqui, M. U., 2000: Directional morpho-logical image transforms for lineament extraction from remote sensed images. Inter-national Journal of Remote Sensing, Vol. 20, Issue 17, 3281-3292.
Wells, N-A., 2000: Are There Better Alternatives to Standard Rose Diagrams? Jour-nal of Sedimentary Research; January 2000; v. 70; no. 1; p. 37-46
Wheeler, R., 1983: Linemanship and the practice of linear geo-art. Geol. Soc. Am. Bull., v. 94, 1377-1378.
Wise, D., 1982: Linemanship and the practice of linear geo-art. Geol. Soc. Am. Bull., v. 93, 886-888.
Wise, D., 1983: Linemanship and the practice of linear geo-art. Reply. Geol. Soc. Am. Bull., v. 94, 1379.
Appendix 1: Lineament mapping of central and
south-ern Sweden, a review
In 1897 Svedmark presented an “orographic study of Roslagen” (eastern part of Up-pland), which actually is a lineament map outlining the location of, e.g. the “Singö fault” and the “Forsmark fault”. At that time there was an on-going discussion about the relation between structures, block faulting, and location of, e.g. large lakes (cf. Nathorst, 1897).
In the early nineteen hundreds DeGeer presented maps of landforms in southern (1910) and central Sweden (1913). He outlined several horst and graben structures, e.g. the regional E-W trending Sörmland Horst, and the N-S trending horst and gra-ben systems around lake Vättern, and he also displayed the occurrence of tilting of large-scale rock blocks.
The first regional map showing the relation between fracturing of the bedrock and the morphology in Fennoscandia was presented by Sederholm (1910).
Asklund (1923) discussed block-faulting in Östergötland (eastern Sweden, northern Götaland) and presented a rock-block map covering south eastern Sweden from Os-karshamn to Norrtälje (upto where Svedmarks map continues northwards). Asklund in maps and profiles showed both vertical displacement of the peneplained bedrock surface and tilting of separate blocks. A similar map outlining the block configura-tion in Sommen-Åsunden was produced by Björnsson (1937).
Nordenskjöld (1944), in his morphological study of central and northern Småland, outlined the existence of large-scale blocks and the existence of gently inclined frac-ture zones.
Röshoff and Lagerlund (1977) presented a tectonic analysis of southern Sweden based on interpretation of aerial photos and satellite images. They also discussed indication of post-glacial faulting.
Erhenborg (1984) presented a lineament map of Sweden based on interpretations of satellite images. The southern part of this map was presented by Röshoff (1979) in an article discussing the tectonic pattern in southern Sweden.
Eriksson and Ronge (198x) presented lineaments of Scandinavia based on satellite images displaying a regular spacing of extensive lineaments indicating a rhombic block pattern.
The first structural interpretations based on digital elevation data and digital terrain models were presented by Tiren et al., (1987) and Tirén and Beckholmen (1989). These publications considered lineament patterns and rock-block configurations in southeastern Sweden. Tirén and Beckholmen (1992) presented a lineament map of southern Sweden and discussed the appearance of earthquakes in relation to sharp lineaments. In 1990 Tirén and Beckholmen presented a lineament map of central Sweden, and a detailed lineament map of Bergslagen in
Kornfält and Larsson (1987) presented lineaments of southern Sweden based on relief maps (position of light source from one direction) in a compilation of geologi-cal maps and cross-sections.
In the National Atlas of Sweden, Geology (1994), the pattern of fracture and fault zones in the Swedish continental shelf and on the main land were summarised by Nordling and Lidmar-Bergström29, respectively. More detailed information regard-ing the Baltic Sea are presented by, e.g. Flodén (1980) and Axberg (1980), and for Skagerak by Flodén (1973).
29 Lidmar-Bergström has published several papers regarding geomorphology, cf.
References
Asklund, B., 1923: “Űbersicht der geologischen Stellung der Bruckspaltung Südost-schwedens”, Geologiska Föreningens i Stockholm Förhandlingar (GFF), 45, 249-285
Axberg, S., 1980: Seismic stratigraphy and bedrock of the Bothnian Sea, northern Baltic. Acta Universitatis Stockholmiensis Stockholm Contributions I Geology Vol XXXVI:3, p. 240.
Bates, R. L., and Jackson, J. A., 1980: Glossary of geology. Second edition. Ameri-can Geological Institute, Falls Church, Virginia, USA.
Björnsson, S., 1937: Sommen - Åsundenområdet. En geomorgologisk . Meddelande från Lunds universitet, Geografiska institutionen, Avh IV.
De Geer, J., 1910: Karta över mellersta Sveriges Landformer. Sveriges geologiska undersökning, Ba 9.
De Geer, J., 1913: Karta över södra Sveriges Landformer. Sveriges geologiska un-dersökning, Ba 9.
Erhrenborg, J., 1984: Lineament map of the southern part of Sweden Lineament map of the northern part of Sweden. Sveriges geologiska undersökning, Serie Ba 33.
Ericsson, L. O., and Ronge, B., 198X: Location of caverns according to permeability of tectonic elements.
Glossary of mapping sciences, 1994. American Society of Civil Engineerings, Amer-ican Congress of Surveying and Mapping, AmerAmer-ican Society for Photogrammetry and Remote Sensing.
Flodén, T. 1973: Notes on the bedrock of the eastern Skagerack with remarks on the Pleistocene deposits. Acta Universitatis Stockholmiensis Stockholm Contributions I Geology Vol XXIV:5, 79-102.
Flodén, T., 1977: Tectonic lineaments in the Baltic from Gävle to Simrishamn. Kärnbränslesäkerhet (KBS), KBS TR-59.
Flodén, T., 1984: Der Structurbau im Seegebiet von Sweden. Zeitschrift für An-gewante Geologie 30, 1-16.
Flodén, T., 1980: Seismic stratigraphy and bedrock geology of the central Balic. Acta Universitatis Stockholmiensis Stockholm Contributions I Geology Vol XXXV, p. 240.
Kornfält, K.-A., and Larsson, K., 1987:Geological maps and cross-sections of Southern Sweden. Swedish Nuclear Fuel and Waste Management Co (SKB), SKB TR 87-24.