Report number: 2009:08 ISSN: 2000-0456 Available at www.stralsakerhetsmyndigheten.se
Shear-induced Fracture Slip and
Permeability Change
Implications for Long-term Performance of a
Deep Geological Repository
Research
Authors:2009:08
Ki-Bok MinTitle: Shear-induced Fracture Slip and Permeability Change - Implications for Long-term Per-formance of a Deep Geological Repository
Report number: 2009:08
Author/Authors: Ki-Bok Min1,2) and Ove Stephansson3)
1)School of Civil, Environmental and Mining Engineering, The University of Adelaide, Adelaide, Australia, 2)Department of Energy Resources Engineering, Seoul National University, Seoul, Korea, 3)Steph Rock
Consulting AB, Berlin, Germany
Date: Mars 2009
This report concerns a study which has been conducted for the Swedish Radiation Safety Authority, SSM. The conclusions and viewpoints pre-sented in the report are those of the author/authors and do not neces-sarily coincide with those of the SSM.
SSM Perspective
Background
Opening of fractures induced by shear dilation or normal deformation can be a significant source of fracture permeability change in jointed rock, which is important for the performance assessment of geological repositories for spent nuclear fuel. As the repository generates heat and later cools the fluid-carrying ability of the rocks becomes a dynamic va-riable during the lifespan of the repository. Heating causes expansion of the rock close to the repository and, at the same time, contraction close to the surface. During the cooling phase of the repository, the opposite takes place. Heating and cooling together with the virgin stress can in-duce shear dilation of fractures and deformation zones and change the flow field around the repository.
Purpose
The objectives of this project are to examine the contribution of thermal stress to the shear slip of fracture in mid- and far-field around a KBS-3 type of repository and to investigate the effect of evolution of stress on the rock mass permeability. The first part of the study is about the evolu-tion of thermal stresses in the rock during the lifetime of the repository. Critical sections of heat generated stresses around the repository are selected and classified. Fracture data from Forsmark is used to establish fracture network models (DFN) and the models are subjected to the sum of virgin stress and thermal stresses and the shear slip and related per-meability change are studied.
Results
In the first part of this study, zones of fracture shear slip were exami-ned by conducting a three-dimensional, thermo-mechanical analysis of a spent fuel repository model. Stress evolutions of importance for fracture shear slip are: (1) comparatively high horizontal compressive thermal stress at the repository level, (2) generation of vertical tensile thermal stress right above the repository, (3) horizontal tensile stress near the surface, which can induce tensile failure, and generation of shear stresses at the corners of the repository. In the second part of the study stress paths obtained from the thermo-mechanical analysis were used as boundary conditions in DFN-DEM analysis of six DFN models at
the repository level. Increases of permeability up to a factor of four were observed during thermal loading history and shear dilation of fractures was not recovered after cooling of the repository.
Effects on SSM supervisory and regulatory task
An understanding of the stress path and potential areas of slip induced shear dilation and related permeability changes during the lifetime of a repository for spent nuclear fuel is of utmost importance for analysing long-term safety. The result of this study will assist in identifying critical areas around a repository where fracture shear slip is likely to develop. The present study is restricted to rock mass conditions found at reposi-tory level in SKB’s Forsmark site.
Project information
SSM reference: SSM 2008/358, Project 1294 Responsible at SSM has been Öivind Toverud
1
Table of Contents
Table of Contents ... 1
1 Introduction ... 2
2 Methodology... 5
3 Far-field Thermo-mechanical Analysis of a KBS-3 Type Repository... 6
3.1 Numerical codes and verification ... 6
3.2 Geometry and data used for the study... 7
3.3 Temperature evolution ...10
3.4 Thermal stress evolution ...13
3.4.1 Evolution of thermal stresses at selected points ...13
3.4.2 Evolution of thermal stresses along the selected monitoring lines ...19
3.5 Summary of thermal stress change - Identification of regions with shear slip potential ...21
4 DFN–DEM Analysis ... 25
4.1 Methodology...25
4.2 Discrete Fracture Network Generation and Data for DEM Analysis for Forsmark site ...25
4.3 Permeability Change during a Cycle of Heating and Cooling ...28
5 Conclusions ... 33
6 References ... 34
Appendix. Compilation of thermo-mechanical stress evolution of a repository at different monitoring points ... 36
2
1 I
NTRODUCTION
Various studies have shown that shear dilation of fracture can be a source of significant fluid flow in fractured rock. A field investigation by Barton et al. (1995) supported that critically stressed fractures are the ones that carry the major portion of the fluid flow, and this finding was also numerically demonstrated by Min et al. (2004a), as shown in Figure 1. While characterizing permeability is one of the most important tasks for determining the feasibility of deep geological repository for nuclear waste, it is important to recognize that the fluid-carrying ability of underground rock, i.e., its permeability, is a dynamic variable during the lifespan of a geological repository (Rutqvist and Stephansson, 2003). Heating causes expansion of the rock close to the repository and, at the same time, contraction close to the surface. During the cooling phase of the repository, the opposite takes place.
Excavation of the repository tunnel and deposition holes, along with the thermal stress generated from the heat-generating nuclear waste, are the main sources for the alteration of the stress state, and hence the permeability, of a repository. While the effect of excavation is expected to develop in the near-field, which is defined as the surrounding area that is within a few times the diameters of the repository tunnel and deposition holes, the influence of thermal stress will reach mid- and far-field areas, which can be several hundred meters from the periphery of the repository.
Rutqvist and Tsang (2008), in their analysis of the KBS-3 repository system, showed that multiple locations around near-field can undergo shear slips along discontinuities due to excavation and thermal stress. It is worthwhile to investigate whether such shear slip can be observed in the mid- and far-field areas around a repository. This potential shear slip may induce an increase of permeability that can then affect the radionuclide transport calculation. Specifically, the generated thermal stress in the repository setting is predominantly toward the horizontal direction due to the unconfined free ground surface (see Figure 2), and this high thermal stress ratio will generally act in favor of shear slip.
x = 0 MPa y = 0 MPa x = 5 MPa y = 5 MPa x = 10 MPa y = 5 MPa x = 15 MPa y = 5 MPa x = 20 MPa y = 5 MPa x = 25 MPa y = 5 MPa Direction of Flow Y X
Figure 1 Enhanced fluid flow due to shear slip from increased horizontal rock stress. Shear dilation causes the increase of permeability by a factor of six when the range of allowable change of aperture was from five microns to 50 microns (Min et al., 2004a).
3
The intent of this project is to investigate whether the increase of permeability can be observed in the mid- and far-field scale around a deep geological repository due to the heat load from the spent nuclear fuel.
Both candidate sites in Sweden, Forsmark and Laxemar, being considered by SKB (Swedish Nuclear Fuel and Waste Management Company) indicate a high stress ratio (ratio of major principal stress to minor principal stress), and this implies that many fractures at both sites are critically stressed or nearly critically stressed under the current stress state (SKB, 2006). This means that even a slight change of stress can trigger a shear slip as shown in Figure 3, so investigation is needed to determine the extent of shear slip potential and permeability change around the repository.
SKB stated that shear displacements are in general less than 1 mm and that this small shear displacement is too small to cause any significant impact on fracture transmissivity (SKB TR 06-09, p. 209). However, the study was based on elastic analysis, and a further study is required to evaluate the potential for shear failure induced by high shear stress on existing fractures. Hence, the study must consider elasto-plastic properties and the geometry of the fractured rock mass.
It was concluded by SKB that the possibility of excavation-induced fault slip doesn't need to be considered (SKB, 2006, p. 211). However, thermal stress generation due to the heat decay of nuclear waste has not been properly considered in the study.
Hökmark et al. (2006) did not consider the effect of dilation in terms of elasto-plastic analysis. Because there was an abrupt change of permeability even with a slight change of stress, a discrete elasto-plastic analysis is required. Their approach may have underestimated the effect of shear dilation, both in the near-field and far-field regions.
Figure 2. Profiles of vertical and horizontal stresses for a repository; (a) vertical stress, (b) major principal stress in the horizontal direction, (c) intermediate principal stress in the horizontal direction (Rutqvist and Tsang, 2008). Note that generated thermal stress is predominantly in the horizontal direction.
4 0 5 10 15 20 25 30 35 40 45 0 10 20 30 40 50 60
Effective stress (MPa)
Sh e ar S tr e ss (M P a) µ = 0.6 µ = 1.0
Figure 3. State of in-situ stress and Coulomb failure criteria. Black Mohr-circle indicates the initial stress state and increased stress state with the thermal stress contribution shown in red. Data for the initial state were from Hökmark et al. (2006), with the addition of pore pressure at the depth of 400 m and data for thermal stress taken from Rutqvist and Tsang (2008). Notice that failure takes place for any realistic friction coefficient (µ) of the discontinuities.
The objectives of the current study are:
- To examine the contribution of thermal stress to the shear slip of fracture in mid- and far-field around the repository
- To investigate the effect of the evolution of stress state on the permeability of geological repositories at two potential sites in Sweden
- To identify the shear slip potential through the entire lifespan of a KBS-3 type repository
This study considers mid- and far-field studies of the shear slip potential for realistic DFNs, which is an improvement and an extension from the previous study by Rutqvist and Tsang (2008) that considered only the response of near-field rock mass to heating.
Applying a full stress path of loading and unloading on fractured rock will go beyond the work by Min et al. (2004a), which considered only the generic stress ratio without considering unloading from the cooling phase. The outcome of this study will highlight the significance of the responses of mid- and far-field rock masses for the long-term performance of the repository, which will help to identify the need for longterm monitoring.
Further, three-dimensional, thermo-mechanical analyses will potentially raise issues related to the heaving of surface ground and tensile stress induced by thermal stress, which were identified to be important in a previous study (Min et al., 2005a). Importantly, the use of a full-scale, three-dimensional model of the far-field scale will ensure that no artifacts arise in calculating the thermal stress. For example, moderate tensile stresses up to 10 MPa are expected to be generated above the repository, and this observation cannot be made in the truncated modeling approach used by Rutqvist and Tsang (2008).
5
2 M
ETHODOLOGY
This study was composed of three steps, as shown in Figure 4.
In the first step, three-dimensional, thermo-mechanical analysis was conducted to obtain the full stress history in the far-field around the repository. The analysis used COMSOL MULTIPHYSICS, which is a flexible, partial differential equation solver that uses the finite element method. The size of the model was 2 km x 2 km x 0.8 km (depth) and 600 m x 600 m x 13 m (depth), for regional and repository scales, respectively. The analysis up to 10,000 years was expected to identify shear slip potential in mid- and far-field areas of the repository.
In the second stage, the stress history obtained from the first stage was used as boundary conditions using the DFN-DEM (Discrete Fracture Network- Discrete Element Method) approach (Min et al., 2004a, 2004b). DFN is constructed in selected points in mid- and far-field based on the site investigation data taken from SKB (2006). In this study, it was possible to quantify the extent of shear dilation under the specific stress state and the nature of irreversibility of permeability through the application of stress release, which was expected to occur after cooling of the spent fuel. Generic data for the stress-transmissivity relationship for a single fracture was used. For DEM calculation, the two-dimensional, distinct element code, UDEC, was used for this study.
Finally, the third stage was devoted to the integration of outcomes from the first and second stages to quantify the shear slip potential and corresponding permeability change in the mid- and far-field of a potential repository.
1. 3D Thermomechanical analysis in repository setting 2. DFN-DEM analysis in selected locations 3. Identification of shear slip potential in large scale Stress path Slip zone and quantified k y x x y y x x y 800 m 400 m 600 m 600 m 2000 m 2000 m repository 1. 3D Thermomechanical analysis in repository setting 2. DFN-DEM analysis in selected locations 3. Identification of shear slip potential in large scale Stress path Slip zone and quantified k y x x y y x x y 800 m 400 m 600 m 600 m 2000 m 2000 m repository 1. 3D Thermomechanical analysis in repository setting 2. DFN-DEM analysis in selected locations 3. Identification of shear slip potential in large scale Stress path Slip zone and quantified k y x x y y x x y 800 m 400 m 600 m 600 m 2000 m 2000 m repository
Figure 4. Three stages of the modeling work of potential shear slip.
6
3 F
AR
-
FIELD
T
HERMO
-
MECHANICAL
A
NALYSIS OF A
KBS-3
T
YPE
R
EPOSITORY
3.1 Numerical codes and verification
The thermo-elastic solution can be obtained by solving the coupled equation of elasticity (Navier equation) and the heat diffusion equation. Temperature calculated from diffusion equation is passed on to the elasticity equation with an additional thermal expansion contribution from volumetric strain. Because strain energy from elasticity is insignificant to the temperature change, the heat diffusion equation is solved independently.
The numerical code used in this study was COMSOL (2008), which is a partial differential equation solver using the finite element method (FEM). For this study, a calculation scheme for thermo-elastic stress was added.
In order to verify the implemented thermo-mechanical solution method, two verification cases on thin and thick rectangular plates were taken from existing literature (Timoshenko and Goodier, 1970, Figure 5, p. 443). The corresponding thermal stress distributions under temperature, which are only a function of height of the plate, as shown in Figure 5, can be expressed as follows:
2 0 0 2 2 1 3 x y T E T E c (1) 2 0 0 2 1 2 1 (1 ) 3 (1 ) x z T E y T E c , (2)
where α is a linear thermal expansion coefficient, T0 is initial temperature, E is the
elastic modulus, ν is Poisson’s ratio, and c is a constant. The comparison between the analytical solution above and the numerical solution obtained using COMSOL showed perfect agreement, as shown in figure 6.
Temperature distribution X
Y
Figure 5. A verification case with a thin rectangular plate with temperature distribution (from Timoshenko and Goodier, 1970). Boundaries are free to move in this verification study. Another case with a thick plate was also tested with good results.
7
Figure 6. Comparison between analytical and numerical solutions for thermoelasticity verification tests after implementation in COMSOL. Case 1 and 2 are cases on thin and thick plates, respectively. Input parameters used for these
verifications are: E = 60 GPa, T0 = 100 °C, α = 7.7×10⁻⁶, ν = 0.25, and c = 1.0.
3.2 Geometry and data used for the study
No attempt has been made in this study to explicitly model the geometry of the deposition holes and the deposition tunnels. Rather, all deposition holes and tunnels were lumped as a thin rectangular plate of uniform thickness, and the size of the rectangle was calculated considering the number of canisters to be disposed, the spacing of the deposition holes, and the separation of the deposition tunnels. The number of canisters required to accommodate the Forsmark area is 6000 (Brantberger et al., 2006). The spacing of the deposition holes is 6 m for Forsmark and the separation of the deposition tunnels is 40 m.
The equivalent area of the repository (Arep) can be calculated by the following simple
formula:
rep h t
A NS S
, (3)
where N is the number of canisters, Sh is the spacing of the deposition holes, and St is
the separation of the deposition tunnels. The calculated area for Forsmark was 1.44 km2 and the side length of the whole repository was 1.2 km. Because of the symmetry of the model, the actual side length used in this study was 600 m. The thickness of the plate repository model was 13.3 m based on the dimensions of the deposition holes and the tunnels. The geometrical model for the potential site at Forsmark is shown in Figure 7.
8
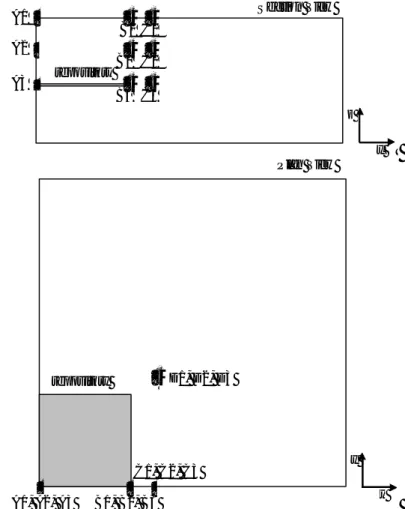
In order to monitor the evolution of important variables, such as temperature and stress, monitoring points were established in four hypothetical boreholes as indicated in Figure 8. Monitoring points were located 200 m apart in each borehole.
800 m 400 m 600 m 600 m 2000 m 2000 m x y z
Figure 7. Model geometry used for the Forsmark site in this study. A symmetric model with the size 2,000 m by 2,000 m was used. The height of the repository was 13.3 m, considering the configuration of the deposition holes and tunnels.
•
•
•
•
•
•
A1 A2 A3 C1 C2 C3 repository Section View•
•
•
B1 B2 B3 x z•
A1, A2, A3 B1, B2, B3•
•
D1, D2, D3 repository Plan View•
C1, C2, C3 x yFigure 8. Location of monitoring points. A1, A2 and A3 are located 200 m apart in vertical direction.
9
Heat decay data from the canister were taken from an existing SKB model. Each parameter can be found in Hökmark and Fälth (2003), and the heat decay curve is shown in Figure 9. 7 1 ( ) (0) iexp( / )i i P t P a t t
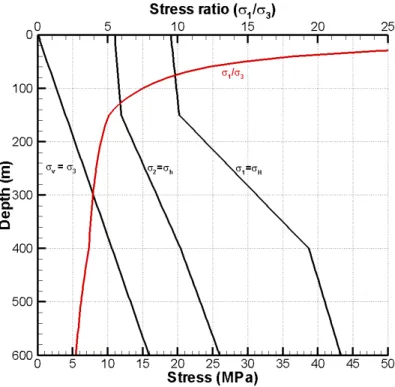
(4)Rock properties, in-situ stress, and initial temperature data are from recent reports from SKB (2006), (Table 1, Table 2, and Figure 10).
It is noted that thermo-elastic analysis was conducted for the stress-free condition first, and in-situ stress was superimposed later for boundary conditions for discrete element analysis. This allows for more efficient computation and investigation about the uncertainties of in-situ stress as found for the Forsmark site.
Figure 9. Evolution of heat power at the repository
Table 1. Rock Properties used in this study (Forsmark)
Forsmark
Density (kg/m3) 2700 Table 6-3, SKB (2007) R-07-31 Elastic modulus (GPa, rock
mass)
70 Table 5-9, SKB(2007) based on FFM01
Poisson’s ratio (rock mass) 0.24 Table 5-9, SKB(2007), based on FFM01
Thermal expansion coefficient (/°C)
7.7×10⁻⁶ Average, Thermal properties, SKB(2007) (R-07-47) RFM029 Thermal conductivity
(W/m/°C)
3.58 Table 6-1, Thermal SKB (R-07-47) RFM029
Specific heat (J/kg/°C) 796 Calculated from 2.15 (MJ/m3/°C), SKB (R-07-47) RFM029
10
Table 2. In-situ stress and temperature used in this study (Forsmark)
Vertical 0.0265*z Martin (2007) Minor horizontal 11.0+0.006*z (z < 150 m) 6.8+0.034*z (150 m < z < 400 m) 9.2+0.028*z (400 m < z < 600 m) Martin (2007) In-situ stress Major horizontal 19.0+0.008*z (z < 150 m) 9.1+0.074*z (150 m < z < 400 m) 29.5+0.023*z (400 m < z < 600 m) Martin (2007) In-situ temperature 6-0.012*z Back et al. (2007), Table 3-23
Figure 10. SKB’s in-situ stress estimation for Forsmark (Martin, 2007)
3.3 Temperature evolution
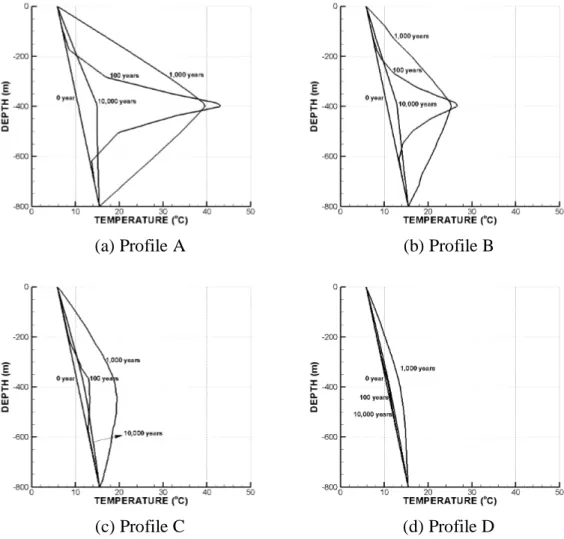
Temperature evolutions in various locations are plotted in Figure 11. The maximum temperature in the rock mass is around 42 °C for 100 to 500 years in the vicinity of repository. At mid-depth monitoring points, which are 200 m deep, the maximum temperature is about 20 °C (except right above the repository, A2), and maximum temperature at this depth is achieved at about 1,000 years. This different time for maximum temperature is an important factor in evaluating the corresponding stress changes in various locations. Figure 12 shows the temperature distributions for selected time scales, and Figure 13 shows the temperature distributions for selected profiles A, B, C, and D at selected time scales.
11
(a) (b)
(c) (d)
Figure 11. Temperature evolutions at the selected points. For the locations of each monitoring point, see Figure 8.
After 10 years After 50 years
After 100 years After 500 years
12
After 1,000 years After 5,000 years
Figure 12. Temperature evolution after emplacement of spent nuclear fuel.
(a) Profile A (b) Profile B
(c) Profile C (d) Profile D
Figure 13. Temperature distributions at selected profiles and times
13
3.4 Thermal stress evolution
3.4.1 Evolution of thermal stresses at selected points
Notable thermal stresses of the repository are presented in this section. All of the compressive, tensile, and shear thermal stresses can be generated in the present geometry of the deep geological repository, and they occur on different time scales. Figure 14 shows the evolution of stresses in the horizontal direction (mainly compressive) at various points at the repository level. The maximum compressive stress of 20 MPa was observed at the center of the repository after about 100 years. At the periphery of the repository, the magnitudes are smaller with maximum stress of approximately 10 MPa. A few comments need to be made on these observations:
The maximum horizontal compressive stress was observed in the center of the repository at repository level and both horizontal stresses are isotropic.
Notable anisotropic horizontal compressive stresses (B3 and C3) were observed near the periphery of the repository.
The time for maximum compressive stress to develop varies from 100 years to 1,000 years, depending on the location of the monitoring points.
Figure 14. Evolution of notable compressive stresses at selected points at repository level 400 m. Notice the stress anisotropy outside the border of the repository.
Figure 15 shows that significant tensile stress develops at various locations around the repository. The maximum tensile stress is in the order of 10 MPa at the surface right above the center of the repository. A few comments need to be made regarding this observation:
14
The maximum tensile stresses were observed at the ground surface, and the time for maximum tensile stress was about 1,000 years after deposition.
Transition from tensile to compressive stress occurred at about the mid-depth point, right above the repository (A2 and B2).
While tensile stresses near the surface were oriented horizontally, vertical tensile stresses were observed at the repository level in the vicinity of the repository (points C3 and D3).
(a) Tensile stress at the ground surface (b) Stresses at the mid-depth
(c) Vertical tensile stress at repository level
Figure 15. Notable horizontal and vertical tensile stresses at various locations. Horizontal tensile stress is observed from mid-depth level to ground surface level, and vertical tensile stress is observed in the vicinity of repository.
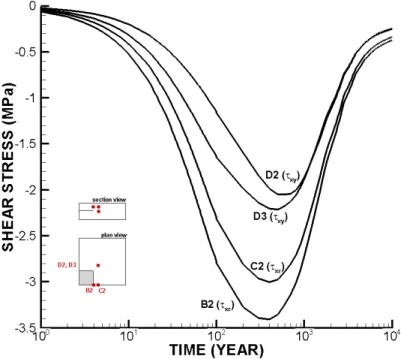
Figure 16 shows the evolution of thermal shear stresses at various points in the model. It is noted that thermally-induced shear stresses at the side of the repository (B2, C2) act in vertical planes (i.e., xz-plane or yz-plane, with z-axis as the vertical plane),
15
shear stress at the corner (D2, D3) acts in the horizontal plane. The magnitude of maximum shear stresses is in the order of 2 – 3 MPa.
These shear stresses will induce the rotation of the direction of the principal stress and cause possible shear slip of the shallow dipping fractures and vertical fractures, which are abundant in the Forsmark area.
Figure 16. Evolution of notable shear stresses at selected points in the model
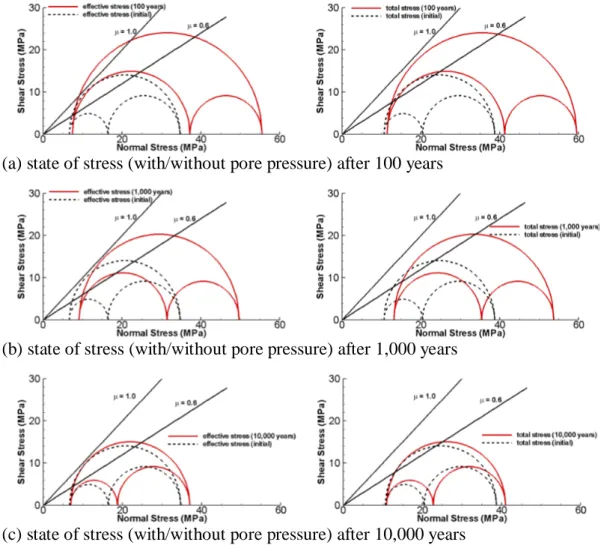
Figure 17, Figure 18, and Figure 19 show the transition of stress state with generation of thermal stress at different locations. In each Figure, two cases, i.e., with and without considering pore pressures, were plotted in terms of Mohr Circles. Because pore pressure shifts the entire Mohr Circle to the left, the possibility of fracture failure increases with the inclusion of pore pressure. The friction coefficients used for upper and lower bounds were 1.0 and 0.6, respectively.
At location A3, which is located at a depth of 400 m, the possibility of failure greatly increases after 100 years due to the comparatively high horizontal stress, as shown in Figure 17 (a). After 1,000 years, the contribution of thermal stress to the failure of fracture is less significant due to the relatively homogeneous increase of thermal stress in the horizontal and vertical directions (Figure 17 (b)). In 10,000 years, the stress state mostly returned to the initial stress state (Figure 17 (c)).
In location A2, which is located at a depth of 200 m, the possibility of failure remains the same and may even decrease. After 100 years, the horizontal stress initially decreased due to temporary generation of horizontal tensile stress, and this reduced the possibility of fracture failure, as shown in Figure 18 (a). In 1,000 and 10,000 years, the possibility of fracture failure remains largely the same as shown in Figure 18 (b) and (c).
16
A completely different mechanism dominates the fracture failure mode in location A1, which is located at the surface. Because of the high horizontal tensile thermal stress, i.e., on the order of 10 MPa, fractures are prone to tensile failure after 1,000 years, as shown in Figure 19 (b). It is important to note that this tensile failure is expected much later than the previous shear failure, which was about 100 years.
(a) state of stress (with/without pore pressure) after 100 years
(b) state of stress (with/without pore pressure) after 1,000 years
(c) state of stress (with/without pore pressure) after 10,000 years
Figure 17. State of stress after heating at location A3 (400 m deep). Stress states considering with and without pore pressure are shown after different times.
17
(a) state of stress (with/without pore pressure) after 100 years
(b) state of stress (with/without pore pressure) after 1,000 years
(c) state of stress (with/without pore pressure) after 10,000 years
Figure 18. State of stress after heating at location A2 (200 m deep). Stress states with and without considering pore pressure are shown after different times.
18 (a) state of stress after 100 years
(b) state of stress after 1,000 years
(c) state of stress after 10,000 years
Figure 19. State of stress after heating at location A1 (surface). Note that pore pressure is not considered at the surface.
19
3.4.2 Evolution of thermal stresses along the selected monitoring lines
The distribution of thermal horizontal stresses as presented in Figure 20 shows that the influence area of the tensile stress at the surface is mainly confined to the area above the repository. Outside of the repository (coordinate > 600 m), modest compressive stresses are observed.
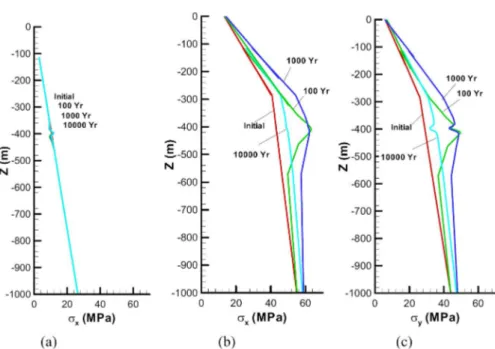
Figure 21 shows horizontal and shear stresses at selected vertical profiles. A few comments are made regarding these observations:
Maximum tensile stress of about 10 MPa appears at the ground surface after 1000 years. The extent of tensile stress can be as deep as 220 m below the surface of the ground after ca 100 years (Figure 21a).
Generated horizontal stress tends to be more anisotropic at the periphery of the repository (Figure 21b and 21c).
Shear stresses acting in vertical planes are observed in the vicinity of the repository, and the opposite sense of sign is found above and below the repository level (Figure 21d).
Maximum compressive stress at the repository level can be as late as 1,000 years in the vicinity of the repository (Figure 21e).
Severe shear stresses that act in horizontal planes are observed in the corner of the repository (Figure 21f).
It is important to note that both normal and shear stresses are subject to change by heating, as shown in these Figures. Evolutions of complete stress state at selected points are listed in Appendix A.
Figure 20. Distributions of thermal stresses at different times along the monitoring line at the ground surface
20
(a) (b)
(c) (d)
(e) (f)
Figure 21. Distributions of thermal stresses at different times for selected vertical profiles in the model
21
3.5 Summary of thermal stress change - Identification
of regions with shear slip potential
The basic mechanism of the generation of thermal stress is the expansion of the rock coupled with the constraint imposed on the rock mass; this will generate horizontal compressive stress at the repository level and horizontal tensile stress at the ground surface above the repository. However, in the case of a deep geological repository of spent nuclear fuel, more complex thermal stresses are likely because the source of heat is not uniform with respect to time, space, and geological conditions. Therefore, we analyze the changes observed in thermal stress in a more systematic manner to judge the potential for shear slip and permeability changes.
Figure 22 illustrates thermally-induced, horizontal compressive stresses, tensile stresses, and shear stresses observed in the setting of the repository.
It is noted that all three modes of stresses can increase the shear slip potential in one way or another. Importantly, the slip does occur on different time scales. Important mechanisms that affect the shear slip potential can be summarized as follows:
Increased horizontal compressive stress increases the possibility of shear slip because the vertical stress component remains mostly constant with time. Anisotropic horizontal compressive stress can increase the shear slip potential
depending on the anisotropy of the horizontal component of virgin rock stress. Horizontal tensile stress reduces total horizontal stress and can act to reduce
the potential for shear slip. However, the generation of significant tensile stress, up to 10 MPa at the surface, can cause tensile failure of fractures and deformation zones.
Vertical tensile stresses generated at the periphery of the repository at the repository level reduce the total vertical stress, and this increases the probability that shear slip may occur.
Thermally-induced shear stress can contribute to the rotation of principal stresses and can increase the shear slip potential of shallow dipping and near vertical fractures.
22 H ori z on ta l Com pre ss iv e S tre ss Isotropic Section View repository Plan View Anisotropic Section View Plan View T e ns il e S tr e ss Horizontal Section View Plan View Vertical Section View Plan View S he a r S tr e ss
Acting in vertical plane
Section View
Plan View
Acting in horizontal plane
Section View
Plan View
Figure 22. Classified regions of thermal stress change during the operation of a spent fuel repository. Stresses are defined with respect to the coordinates that are in line with the horizontal and vertical directions at the site.
23 H ori z on ta l Com pre ss iv e S tre ss Isotropic σx after 100 years Anisotropic
Differences between horizontal stresses σx and σy after 100 years
T e ns il e S tr e ss Horizontal σx after 1,000 years Vertical σz after 100 years SSM 2009:08
24 S he a r S tr e ss
Acting in vertical plane
τxz or τyz after 400 years
Acting in horizontal plane
τxy after 500 years
Figure 23. Examples of classified regions around a repository. Plots are selected for the most significant time scales. This set of figures serves to help understand the regions listed in Figure 22.
25
4 DFN–DEM
A
NALYSIS
4.1 Methodology
DFN-DEM analysis uses the discrete fracture network (DFN) as the geometry of the fractured rock and applies the discrete element method (DEM) for the analysis of mechanical and hydraulic behaviours (Min et al., 2004a). The two steps involved in the analysis are shown in Figure 24. For the generation of DFN, a two-dimensional DFN generator was used (Min et al., 2004b), and Universal Distinct Element Code (UDEC) version 4.0 was used for the DEM calculation (Itasca, 2006).
The merit of this analysis is that the effect of stress can be readily investigated by changing the stress conditions through repetition of numerical experiments. The stress values used in this study were from the sum of the thermal stress generated in the thermo-mechanical analysis and measured in-situ stress. Reference points were selected to trace the change of resultant stress, which were then used as boundary conditions.
Figure 24. Two steps of the DFN-DEM analysis. Application of stress boundary conditions and calculation of equivalent permeability in the x- and y-directions. The terms σxand σy indicate the boundary stresses applied in horizontal and vertical directions, respectively. P1 and P2 indicate the hydraulic pressure applied at the boundaries with P1 > P2 (Min et al., 2004).
4.2 Discrete Fracture Network Generation and Data
for DEM Analysis for Forsmark site
Fracture data used for the realization of fractured rock mass are listed in Table 3, 4 and Table 5. Ten DFN models with sizes of 5 m by 5 m were generated using the DFN generator in order to represent a more general behavior of fracture rock mass.
26
Figure 26 shows the generated DFN models. It is noted that the two-dimensional DFN geometry is cut in the vertical plane along the direction of the major principal stress (Figure 25), which is N145° according to the site investigation for the Forsmark site (Martin, 2007).
Intact rock and fracture properties for the DEM calculation are listed in Table 6. A linear stiffness model was used for the DEM calculation to simplify the stress- aperture change relationship. The elasto-plastic analysis used in this study ensures that the shear slip and corresponding dilation can be properly modeled in the course of stress change. Failure criteria used in this study were Mohr-Coulomb criteria with zero cohesion (see Figure 27). Initial and residual aperture was 70 µm and 10 µm, respectively, based on previous study (Min et al., 2005b).
Figure 25. Model plane for 2D DEM analysis
Table 3. Orientation of fracture data (from Table 7-1, Fox et al., 2007)
Fracture Domain
Fracture Set Trend (mean) Plunge (mean) Fisher κ (mean) FFM01 NE 314.9 1.3 20.9 FFM01 NS 270.1 5.3 21.3 FFM01 NW 230.1 4.6 15.7 FFM01 SH 0.8 87.3 17.4
Table 4. Fracture size parameters (from Table 7-4, Fox et al., 2007)
Fracture Domain
Fracture Set Size
distribution Minimum radius r0 (m) Exponent (kr) Match P32 r0 = ∞ FFM01 NE Power Law 0.66 3.02 1.74 FFM01 NS Power Law 0.06 2.78 1.29 FFM01 NW Power Law 0.59 2.85 0.95 FFM01 SH Power Law 0.82 2.85 0.63 SSM 2009:08
27
Table 5. Fracture Intensity (from Table 7-7, Fox et al., 2007)
Fracture Domain
Fracture Set Mean P32
r0 = ∞ Mean P32 (0.5 – 564 m) FFM01 NE 5.45 7.22 FFM01 NS 2.60 0.49 FFM01 NW 2.42 2.79 FFM01 SH 2.44 3.69 DFN3 DFN5 DFN6 DFN7 DFN9 DFN10
Figure 26. Tested discrete fracture network models. The sizes of the models were 5 m by 5 m.
Table 6. Rock fracture properties from Forsmark used in this study (Glamheden et al., 2007)
Forsmark Site Friction angle ( °) 37
Normal stiffness (GPa/m) 656 Shear stiffness (GPa/m) 34
Dilation angle ( °) 3.2 At 20 MPa stress level Elastic modulus (GPa, intact rock) 76 FFM01
Poisson’s ratio 0.25
28
Figure 27. Shear dilation behavior of a fracture (adapted from Itasca, 2006). Dilation occurs after fracture reaches failure by Mohr-Coulomb Failure Criteria.
4.3 Permeability Change during a Cycle of Heating
and Cooling
Numerical experiments of permeability measurements were conducted on six models of DFN using two sets of stress paths at selected locations of the repository. The selected locations were A3 and C3 at the repository level, where a reasonable probability of shear slip and permeability increases were expected. Final stresses were calculated by superimposing the generated thermal stress on the in-situ stress. Figure 28, shows the final stress path used for the numerical experiment.
Figure 29 and Figure 30 show the permeability change due to the stress changes from heating for six different realizations of DFNs. The following observations were made from these calculations:
The major mechanism of permeability change in four out of six of the models (DFN3, DFN6, DFN7, DFN10) was normal deformation (closure) of fractures without shear slip. This can be explained by the lack of optimally oriented fractures with respect to the stress orientation and poor hydraulic connectivity in these models.
All models except DFN7 and DFN10 show anisotropic permeability throughout the entire time scales.
29
Only two models (DFN5 and DFN9) showed shear slip and a permeability increases with a factor of up to four.
One interesting observation is the irreversibility of the permeability for the time scale of 10,000 years. While the permeability changes are recovered in the models for which normal closure dominated the permeability change, permeability did not actually recover in the two models in which shear slip was the dominant mechanism. This demonstrates the importance of the irreversibility of permeability once shear slip occurs.
Vertical permeability at the repository level is insensitive to stress changes due to the fact that vertical fractures are largely closed at this magnitude of stress.
Figure 31 shows the flow rate changes in DFN5, where fluid flows were increased due to the increased horizontal thermal stress and decreased vertical stress.
Figure 28. Stress path during the thermal history at monitoring points A3 and C3 located at the repository level near the periphery of the repository.
30
(a) DFN3, location A3 (b) DFN5, location A3
(c) DFN6, location A3 (d) DFN7, location A3
(e) DFN9, location A3 (f) DFN10, location A3
Figure 29. Permeability change versus time for six DFN models due to the stress change induced by heating at monitoring point A3. The sum of in-situ stress and thermal stress was used for stress boundary conditions used in these numerical experiments.
31
(a) DFN3, location C3 (b) DFN5, location C3
(c) DFN6, location C3 (d) DFN7, location C3
(e) DFN9, location C3 (f) DFN10, location C3
Figure 30. Permeability change versus time for six DFN models due to the stress change induced by heating at monitoring point C3. The sum of in-situ stress and thermal stress was used for stress boundary conditions used in these numerical experiments.
32 khorizontal kvertical 10 years σx = 39.6 MPa σy = 9.6 MPa 50 years σx = 41.9 MPa σy = 7.9 MPa 100 years σx = 43.2 MPa σy = 7.6 MPa 1,000 years σx = 45.0 MPa σy = 9.7 MPa 10,000 years σx = 39.7 MPa σy = 10.5 MPa
Figure 31. Flow rate changes with the evolution of time and stress. Stress changes were monitored at location C3 at a depth of 400 m. Models are based on DFN5, in which a moderate increase of permeability was observed due to shear slip.
33
5 C
ONCLUSIONS
In this study, the zones of fracture shear slip were examined by conducting a three-dimensional, thermo-mechanical analysis of a repository model. Stress evolutions in selected locations showed that the main mechanisms for the generation of thermal stress that are important for fracture shear slip are the following:
The comparatively high horizontal compressive thermal stress at the repository level
Generation of vertical tensile thermal stress right above the repository
Horizontal tensile stress near the surface, which can induce tensile failure of fractures
Generation of shear stress at the corners of the repository
The implications of the above mechanisms are that fractures of different orientations are vulnerable to shear slip in various locations of a geological repository. The main mechanisms used in importing stress paths were the first two mechanisms, which are expected to occur near the repository without the rotation of principal stress. However, further investigation of the third and fourth mechanisms revealed that fracture openings may occur near the surface and that rotation of the principal stress may have effects on the shear slip of fractures.
Stress paths obtained from the thermo-mechanical analysis were used as stress boundary conditions in order to investigate the effect of stress change on permeability. DFN-DEM analysis on six DFN models at the repository level showed that normal deformation dominated the closure/opening of fractures in four models and that shear dilation was the dominant factor in the remaining two models. In the latter two models, modest increases of permeability up to a factor of four were observed during thermal loading history.
Permeability change caused by shear dilation was not recovered after cooling of the repository. This is explained by the irreversible fracture shear deformation after failure. This is in contrast with the recovered permeability change for models where normal fracture closure dominates.
In this study, two locations near the repository were selected for DFN-DEM analysis. Analysis at several more locations, especially near the surface, will provide a more comprehensive understanding of the potential for shear slip in a repository setting. Also, it is noted that the statistics for only one domain in FFM01 were used for the present analysis and that additional realization of fractured rock in other domains can provide a more comprehensive analysis. Further, analysis was conducted on data from the Forsmark site, and this analysis has implications for sites that have comparatively large horizontal in-situ stresses and relatively few fractures.
34
6 R
EFERENCES
Barton CA, Zoback MD, Moos D, Fluid-Flow Along Potentially Active Faults in Crystalline Rock, Geology 1995;23(8):683-686.
Brantberger M, Zetterqvist A, Arnbjerg-Nielsen T, Olsson T, Outters N, Syrjänen P, Final repository for spent nuclear fuel. Underground design Forsmark, Layout D1. SKB R-06-34, Svensk Kärnbränslehantering AB.
Comsol Multiphysics® ver 3.5 Reference Manual, 2008.
Fox A, La Pointe P, Hermanson J, Statistical geological discrete fracture network model - Forsmark modelling stage 2.2, SKB R-07-46, 2007, Svensk Kärnbränslehantering AB.
Glamheden R, Fredriksson A, Röshoff K, Karlsson J, Hakami H, Christiansson R, Rock Mechanics Forsmark – site descriptive modeling Forsmark stage 2.2, SKB R-07-31, 2007, Svensk Kärnbränslehantering AB.
Hökmark H, Fälth B, Mechanical and thermo-mechanical discrete fracture near-field analyses based on preliminary data from the Forsmark, Simpevarp and Laxemar sites, SKB R-06-89, 2006, Svensk Kärnbränslehantering AB.
Hökmark H, Fälth B, Wallroth T, T-H-M couplings in rock – Overview of results of importance to the SR-Can safety assessment, SKB R-06-88, 2006, Svensk Kärnbränslehantering AB.
Itasca Consulting Group, Universal Distinct Element Code manual, Ver. 4.0, 2006. Martin D, Quantifying in situ stress magnitudes and orientations for Forsmark – Forsmark stage 2.2, SKB R-07-26, 2007, Svensk Kärnbränslehantering AB.
Min KB, Rutqvist J, Tsang CF, Jing L., Stress-dependent permeability of fractured rock masses: a numerical study, International Journal of Rock Mechanics & Mining Sciences; 2004a;41(7):1191-1210.
Min KB, Jing L, Stephansson O, Determining the Equivalent Permeability Tensor for Fractured Rock Masses Using a Stochastic REV Approach: Method and Application to the Field Data from Sellafield, UK, Hydrogeology Journal, 2004b;12(5):497-510. Min KB, Rutqvist J, Tsang CF, Jing L, Thermally-induced mechanical and permeability changes around a nuclear waste repository - a far-field study based on equivalent properties determined by a discrete approach, International Journal of Rock Mechanics & Mining Sciences, 2005a;42(5-6):765-780.
Min KB, Stephansson O, Jing L, Effect of stress on mechanical and hydraulic rock mass properties - application of DFN-DEM approach on the data from Site Investigation at Forsmark, Sweden, EUROCK 2005, Brno, Czech Republic, 2005b: 389-395.
35
Morris A, Ferrill DA, Henderson DB, Slip-tendency analysis and fault reactivation, Geology, 1996;24:275-278.
Back P-E, Wrafter J, Sundberg J, Rosén L, Thermal Properties - Site descriptive modelling Forsmark – stage 2.2, SKB R-07-47, 2007, Svensk Kärnbränslehantering AB.
Rutqvist J, Stephansson O, The role of hydromechanical coupling in fractured rock engineering. Hydrogeology Journal, 2003;11:7–40.
Rutqvist J, Tsang CF, Review of SKB’s work on coupled THM processes within SR-Can, Swedish Nuclear Power Inspectorate SKI 2008:08.
Svensk Kärnbränslehantering AB, Long-term safety for KBS-3 repositories at Forsmark and Laxemar – a first evaluation, Main Report of the SR-Can project, SKB TR-06-09, 2006.
Svensk Kärnbränslehantering AB. Final repository for spent nuclear fuel – Underground design Forsmark, Layout D1, SKB R-06-34, 2006.
Timoshenko SP, Goodier JN, Theory of Elasticity, 3rd Edition, McGRAW-HILL Book Co, 1970, Singapore, 567p.
36
A
PPENDIX
.
C
OMPILATION OF THERMO
-MECHANICAL STRESS EVOLUTION OF A
REPOSITORY AT DIFFERENT MONITORING
POINTS
Figure 1. Thermal stress evolutions at selected locations (hypothetical borehole A and B).
37
Figure 2. Thermal stress evolutions at selected locations (hypothetical borehole C and D).
Strålsäkerhetsmyndigheten Swedish Radiation Safety Authority
SE-171 16 Stockholm Tel: +46 8 799 40 00 E-mail: registrator@ssm.se Solna strandväg 96 Fax: +46 8 799 40 10 Web: stralsakerhetsmyndigheten.se