Teknik och samhälle
Datavetenskap och medieteknik
Examensarbete 15 högskolepoäng, grundnivå
Interpretable Superhuman Machine Learning Systems: An
explorative study focusing on interpretability and detecting
Unknown Knowns using GAN
Tolkbara övermänskliga maskininlärningssystem: En explorativ studie med fokus på tolkbarhet och detektering av Unknown Knowns med GAN
Adam Hermansson
Stefan Generalao
Examen: Kandidatexamen 180 hp
Huvudområde: Data och Informationsveten-skap
Program: Informationsarkitekt
Datum för slutseminarium: 2020-06-01
Handledare: Lars Holmberg Examinator: Yuji Dong
Sammanfattning
I en framtid där förutsägelser och beslut som tas av maskininlärningssystem överträffar människors förmåga behöver systemen att vara tolkbara för att vi skall kunna lita på och förstå dem. Vår studie utforskar världen av tolkbar maskininlärning genom att designa och undersöka artefakter. Vi genomför experiment för att utforska förklarbarhet, tolkbarhet samt tekniska utmaningar att skapa maskininlärningsmodeller för att identifiera liknande men unika objekt. Slutligen genomför vi ett användartest för att utvärdera toppmoderna förklaringsverktyg i ett direkt mänskligt sammanhang. Med insikter från dessa experiment diskuterar vi den potentiella framtiden för detta fält.
Abstract
In a future where predictions and decisions made by machine learning systems outperform humans we need the systems to be interpretable in order for us to trust and understand them. Our study explore the realm of interpretable machine learning through designing artifacts. We conduct experiments to explore explainability, interpretability as well as technical challenges of creating machine learning models to identify objects that appear similar to humans. Lastly, we conduct a user test to evaluate current state-of-the-art visual explanatory tools in a human setting. From these insights, we discuss the potential future of this field.
Contents
1 Introduction 1
2 Related Works 1
2.1 Machine Learning . . . 1
2.2 Interpretability . . . 3
3 Motivation and Contribution 4 4 Method 4 4.1 The Plates . . . 4
4.2 Research through Design . . . 5
5 Progress and Results 6 5.1 First Prototype . . . 6
5.2 Further Prototyping and Verifying Model Performance . . . 7
5.3 Explainable Machine Learning . . . 10
5.3.1 Interpretable Machine Learning, User Testing . . . 14
5.4 The Other-element . . . 19
6 Discussion 22 6.1 Design Implications for Future Interpretable Systems . . . 22
6.2 Trust . . . 23
6.3 Applied Knowledge Quadrant . . . 23
7 Conclusion 24
1
Introduction
The core of machine learning consists of fitting computational models to some data set. These tasks are often closely related to solve societal, personal and industrial problems and includes recommender systems, image classification and autonomous cars. Machine learning systems are capable of learning and making decisions based on large amounts of data which are often at an incomprehensible level for humans.
Machine learning models are often seen as a black box solution, meaning we as humans struggle to understand why they come to a certain decision. As these systems becomes ubiquitous, it is important for us to understand their decision making in order to establish trust into future systems.
Machine learning as a discipline of engineering is often valued in quantifiable per-formance metrics such as accuracy and loss. However, the domain of evaluating tools for interpreting machine learning models in a direct human setting is currently under-researched.
In our work we explore the realm of interpretable machine learning by studying the task of identifying similar objects and letting the machine explain why it came to a certain conclusion by using visually explanatory tools. We also study the human interpretation of a specific explanatory tool in a setting where human and machine collaborate.
2
Related Works
2.1 Machine Learning
Although machine learning can be applied in many different fields our work only focuses on the field of computer vision. In the field of computer vision, a computational inter-disciplinary field of making computers acquire high-level conclusions from digital images and videos, convolutional neural networks (CNNs) have been used as the cutting-edge choice of technique for solving complex image classification tasks. Using CNNs in the task of image processing has become state of the art in recent years. CNNs has been proven to produce astonishing result, even compared to a human baseline, on several different types of computer vision issues such as object detection [16], image classification [22, 17], image captioning [37, 5, 12, 20], semantic segmentation [25], visual question answering [1, 14, 26, 29] and visual dialog [7, 8, 9]. However, they are hard to interpret because of their complex nature [23]. Nevertheless, a fair amount of research projects has been done in the works of visualizing the predictions made by CNNs [31, 32, 33, 38, 13], thus giving us insights about the machine learning systems “visual thinking”.
An example of a visually explanatory tool for CNNs is a project by Selvaraju et al. [31] called Grad-CAM. This technique gives us a visual explanation by highlighting parts of the input data which are considered as meaningful for predictions from a model. Thus given it great implications of being a working tool for identifying failures and showing transparency.
Overfitting and underfitting are two commonly used terms in the field of machine learning. Where a model is fitted to the training set with low training loss and at the same time validating with high loss on the validation data the model is considered overfit. Having a model performing with lower training loss than validation loss is in most cases
considered a bad outcome as the goal of the majority of supervised learning is to create a model that classifies data unseen during the training session, i.e. generalized learning. Underfitting on the other hand is simply when learning is not or only partly achieved by the model. Some causes of underfitting includes inadequate data, not enough training or simply an unsuitable model architecture for the problem.
Generative Adversarial Networks (GAN) consists of two fundamental parts: The gen-erator and the discriminator. It is the framework of letting the gengen-erator and discriminator outperform each other even though they have separate tasks. In an image processing task the discriminator is a classifier fitted to recognize a real or synthetically augmented image. The task of the generator is to synthesis data with the goal of fooling the discriminator. Depending on given parameters the generator and discriminator may be fitted sequentially or within the constraint of rules.[15, 2]
ResNet was introduced the year of 2015 and was at the point able to outperform all competitors in the ImageNet challenge [17, 10]. ResNet is by this day still comparable to the current state of the art. Tweaking the weights of the model using transfer learning with ResNet fitted to the ImageNet-database will in many cases achieve state of the art results in other domains than those presented by ImageNet, e.g. medical purposes [28, 35]. When a predictive model is presented data which is not included in the training set it is expected to predict incorrectly or with high loss. This kind of error is also known as
Known Unknowns or Unknown Unknowns. Detecting that data is outside of the training
set is a challenge itself and has seen multiple different approaches. Designing a Unknown Unknowns-detector is valuable in industries such as autonomous vehicles [39, 3, 24].
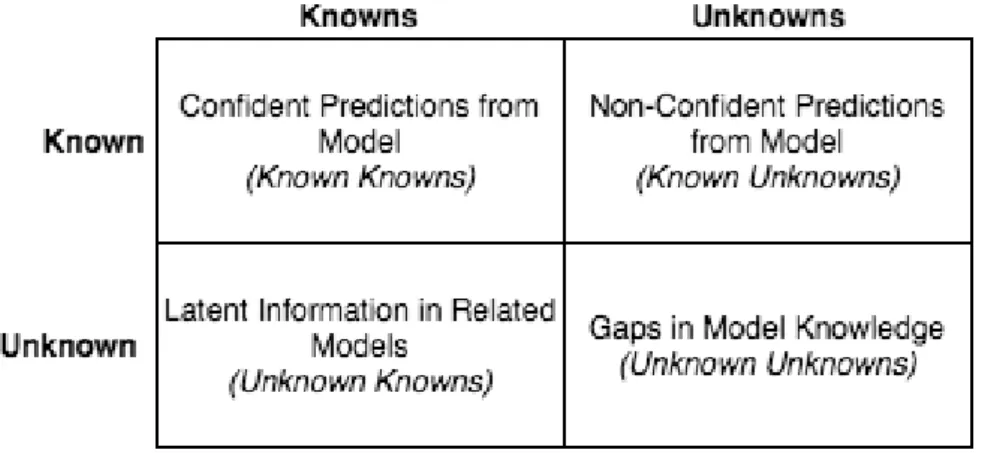
Figure 1: Munro’s Knowledge Quadrant for Machine Learning
Model knowledge may be represented in a Knowledge Quadrant as seen in Figure 1, stated by Robert Munro [27]. Known Knowns are confident predictions whereas Known Unknowns are non-confident predictions. Known Knowns and Known Unknowns differs from Unknown Knowns and Unknown Unknowns which is closely related and completely unrelated data respectively to which the model has been fitted to. Given a fitted dog/cat-image classifier Known Knowns are high confident predictions from an input dog/cat-images of cats or dogs while non-confident predictions of images of cats and dogs are Known Unknowns. Unknown Knowns are for example input images of foxes since they share some traits to cats and dogs while input images of plants are categorized as Unknown Unknowns because
they share few or no traits. In theory, this would mean that a machine learning system may gain the ability to express things such as: “This looks like a dog because of the nose, ears and fur. However, the tail makes me think it’s neither a dog or cat.”
2.2 Interpretability
The definition of interpret is, according to the Merriam Webster dictionary, to explain
or tell the meaning of something and present it in understandable terms.1. However, as needed for the context of interpretability in machine learning applications, a rephrased definition could be The degree to which a human can understand the cause of a decision
made by a machine learning application.
There are a lot of debates in the machine learning community about the terminology and definitions to describe any sort of explainable ML. Nonetheless, in this paper we will talk about interpretable machine learning systems as of when there is an attempt to machine-to-human communication. Simply put, a machine learning system is doing an attempt to present the decisions in a, to humans, interpretable form. We will use
explainable when talking about methods, tools and techniques used by machine learning
systems in order to become interpretable. For instance, a system could visualize it’s decision making process (try to explain) but there needs to be a human perception of the explanation involved in the process in order for us to talk about interpretability.
The importance of interpretability is especially important in situations of which the decision to be made can have severe consequences. An example of this is a pneumonia risk prediction case study conducted by Caruana et al. [4] which discusses the trade-off machine learning practitioners often has to make between accuracy and interpretability. This showed that an interpretable machine learning model could uncover surprising and important patterns in the data that a more complex model would neglect [4].
Recent (2016) regulations from the European Union, called “Right to Explain”,
re-quires decision making algorithms that has a “significant effect” on users to provide an
explanation if the decision was made on user-level predictors [6]. Thereby, motivating further research into this area. Uninterpretable machine learning systems are currently a great trust issue in domains such as health-informatics, since they often cannot provide answers of why they came to a certain decision [18].
With that being said, not all predictive or decision making systems has to be inter-pretable. Ribeiro et al., means that for instance if a model with “hundreds or thousands of features significantly contribute to a prediction, it is not reasonable to expect any user to comprehend why the prediction was made, even if individual weights can be inspected” [30]. This because explanations should be easy to understand and the features used by the model prohibits this since the input variables for the explanation might have to be different than the used features. Furthermore, Doshi-Velez et al. follows up this statement by saying that “Ad servers, postal code sorting, air craft collision avoidance systems - all compute their output without human intervention. Explanation is not necessary either because (1) there are no significant consequences for unacceptable results or (2) the prob-lem is sufficiently well-studied and validated in real applications that we trust the system’s decision, even if the system is not perfect”.
1
3
Motivation and Contribution
Ever since machine learning systems have become omnipresent in human decision making the importance of interpretability in these systems have increased [36]. If we want to pursue a future with machine learning systems in various parts of our society it is important that we’re able to trust the predictions and decisions they do. One way to build trust is to create systems that are interpretable. We imagine the evolution of machine learning systems in a “three-step analogy”.
Step one Predictions and decisions made by machine learning systems are not better
than humans can do. Interpretability is needed to identify failures.
Step two Predictions and decisions made by machine learning systems are equal to
hu-mans. Interpretability is needed to maintain trust.
Step three Predictions and decisions made by machine learning systems are better than
humans. Interpretability is needed in order for us, as humans to learn from machines. Interpretability is needed for us to understand.
Based on this analogy, our work aims to contribute to this field by simulating the third step and further examine how current state-of-the-art explanatory techniques performs.
4
Method
In this section we will describe our choice of methodology, why that specific methodology is suitable for our research questions as well as our working process.
4.1 The Plates
The plates shown in Figure 2 are our reference objects that we’ve been working with throughout the entire project. As we are studying objects that appear very similar but yet different these plates are sufficient since they are just that. They are all hand crafted and painted plates created at Gustavsbergs Porslinsfabrik, a Swedish porcelain factory. They all have the same design but there are notable differences in the painted lines. The characteristics of the plates that differs are things such as the length of the lines, thickness of the lines, texture of the lines and “dirt-stains” of paint on various parts of the plate. The plates from Spisa Ribb represent an appropriate artifact for exploring the field of machine teaching.
The first thing we did upon deciding to use them was to mark them with an individual number, which is shown in Figure 2. This number is put on a note glued to the backside of the plate.
Figure 2: Spisa Ribb hand-painted plates
These objects are interesting for our choice of research since the use case of identifying similar objects is something that we proved was a challenging task for humans while also proving that machine learning algorithms solves it well. It also gives us a domain of focus to maintain throughout the project.
4.2 Research through Design
The methodology we’ve had working on this project is an approach called Research through
Design (RtD) - a methodology that suits exploratory research very well. It is exploratory
in the sense that research is done in dialog with a prototype you design with the purpose of gaining insights about your research area. More specifically, a qualitative approach with the goal of creating new knowledge (hence research). The knowledge is acquired by designing a series of prototypes/artifacts which are used to get a deeper understanding in relation to your research area. This could be parts or aspects of a research question, a phenomena or similar considerations related to a field of research. The insights gained from studies in dialog with prototypes/artifacts is what steers the research projects into it’s next direction.
A key component when working with such a methodology is documenting all progress including decisions that’s been made at different stages of the project. This will be de-scribed in greater detail in the next section. Zimmerman et al. argues that the risk of embracing RtD might be the lack of scientific rigor due to a romanticizing view of design process which not always works as systematic and rigorous as classical research methodologies [40].
This methodology was particularly suitable for our research since our initial research question was to examine the limits of CNN’s capabilities and how they work in the task of distinguishing details in pictures that humans find very similar. We were also initially uncertain about our capabilities and how we could contribute with the demand of new discoveries, an explorative approach was therefore settled. We knew that this starting question is very broad and it would take several iterations to come closer to a more specific question where we could contribute with new knowledge. This is the main reason that we chose this methodology rather than traditional approaches such as DSRM which is less explorative and more strict.
In the following section, we aim to present the progress of our research as detailed as possible in a chronological order. The details that we strive to describe are more specifically the central insights we’ve gotten throughout this project. To clarify, with this approach you often do not know during the work process when the big insight comes.
Those decisions insights that in retrospect added knowledge, changed course of the project gave new insights. Pieter Jan Stappers describes this approach:
“The designing act of creating prototypes is in itself a potential generator of knowledge (if only its insights do not disappear into the prototype, but are fed back into the disciplinary and cross-disciplinary platforms that can fit these insights into the growth of theory).” [34]
The upcoming section will describe and go into further detail about the research ques-tions we’ve investigated, the insights we’ve gotten, how we got those insights, the choices we had to make and why we decided to make them.
5
Progress and Results
In this section we present our study in a chronological manner, as suggested by RtD. It’s divided into several sections which all represent major areas of research that we have been working on. Each section will contain a description of the specific area, results and analysis.
5.1 First Prototype
We started off with experimenting to create a model with the task of being able to distin-guish objects that look very similar, but are unique. The objects we used for this are the hand painted plates shown and described in section 4.1. We decided to start off here since whatever type of sub-field within machine learning we might lean into, the common factor for the domain of which we are studying is objects that looks similar but are different.
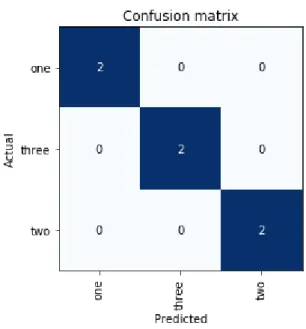
For building our prototype, i.e. the image processing neural network, we were suggested by our supervisor to use the Python library FastAI [19]. The library has experienced academic and industrial successes in recent years. Implementing transfer learning with FastAI is less challenging compared to other popular libraries according to our supervisor. At this stage we only had three plates available. Using transfer learning with ResNet-50 [17] we managed to get the following results:
Figure 3: Confusion matrix of the validation data of the first prototype. Three classes of plates was used all of which was correctly predicted by the model.
The confusion matrix shows an error rate of 0.0 but can not be conclusive due to the small amount of validation data (N=6). The main insight from this experiment was a confirmation for us to go deeper into this domain but more validation data is needed for the forthcoming steps. The initial question if we would be able to create an image processing model that would be able to identify objects that we, as humans, find very similar was partially confirmed at this stage.
We deliberately overfitted our model as it may indicate that the model has sufficient complexity for the problem. If we were not able to overfit our model using few training images it would indicate that we should use a more complex model while taking for granted that the data was qualitative enough. Disabling the built-in regularizers in ResNet to induce overfitting is a reasonable alternative but we chose to induce overfitting by using a small training set instead as it’s the less tedious alternative. However, overfitting to prove sufficient complexity of the model is not necessarily true which led us to the next step.
5.2 Further Prototyping and Verifying Model Performance
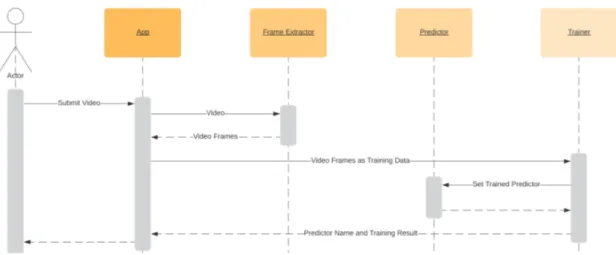
For the experiments described in this section, our artifact was further developed with the intent of being a tool to streamline rapid iterations of experiments. The architecture of the artifact at this stage was according to the sequence diagram at Figure 4.
Figure 4: Sequence diagram representing the state of the artifact used for prototyping.
We executed an experiment of when we shot a video of each plate in a homogeneous environment, meaning they were placed in front of the same background. The reason we did this was to investigate the quality of training data produced by a video shot from a mobile phone2. We shot the video from various angles of each object to include as much information as possible. An example of such a video can be found here3. This experiment
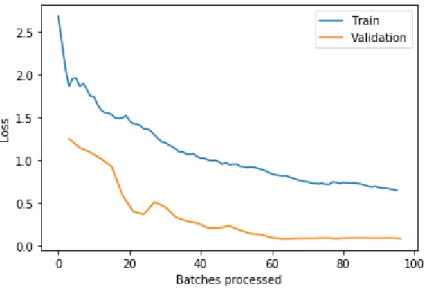
consisted of three parts using ResNet-50 with a batch size of 16 and a total of 60 images. In the first of three parts the training data consisted of 48 images and 12 for validation, i.e. validation split of 0.2. In order to secure the fitting of model was working accordingly we tried to induce under and overfitting for the second and third part.
At the end of the first part the trained model was evaluated with 0.0 error rate. According to the following loss history graph the validation loss was at around 0.1 and the model didn’t seem to be overfitted since the validation loss was kept below the training loss.
2
We used a OnePlus 6
3
Figure 5: Training and validaton loss over number of training batches, part 1.
In the second sub-experiment we tried to confuse the model and induce underfitting. We did this by re-label each training image to a random class, in other words corrupting the label-image pair. By doing so zero rule performance can be expected, i.e. error rate of approximately 0.667 or 2/3 incorrect. The model was then re-trained. After 96 processed batches the error rate was at 0.50 and according to the following loss history graph the validation loss was around 1.55.
Figure 6: Training and validaton loss over number of training batches, part 2.
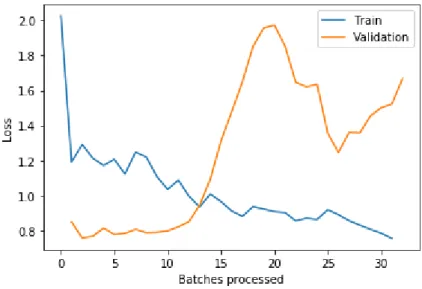
In the third experiment we went back to the initial data (non-shuffled images). We changed the validation split from 0.2 to 0.9, meaning 6 images for training and 54 for validation instead of 48 and 12 respectively. In this experiment we expected a rough overfitting. After 60 epochs the error rate was at 0.382 and the loss history graph clearly
indicates overfitting.
Figure 7: Training and validaton loss over number of training batches, part 3.
A suspicion we had after running these experiments was that hidden overfitting due to data leakage was not being shown in the loss graphs. Data leakage in this context means that training and validation images might be too similar since they are extracted from the same video. Determining whether this was the case or not, we validated the model using new images taken from slightly different environments, i.e. using backgrounds that differs from the training data. This affected the loss of the model marginally negatively confirming that data leakage might have been an issue. Although the accuracy was still very high (100% accuracy) it can’t be concluded that the model suffers from overly op-timistic validation accuracy due to data leakage. From this experiment we learned that caution while selecting data must be considered. The actions we took included steps in the data collection protocol that the images of the training set and validation set must not be extracted from the same video.
5.3 Explainable Machine Learning
The insights we gained from the previous series of experiments is what would determine in what direction we would move forward with our research. We were satisfied with the functionality of the application and it’s potential. However, we felt that we were currently roaming in a very broad space, in the sense that there were many different aspects to focus on.
CNN’s used for image identification and classification is nothing new. This is what led us into explainable machine learning and experimenting with state-of-the-art explainability tools for computer vision. We narrowed down the questions to:
• How can an image identifying/classifying CNN explain the decision it makes when
identifying an object?
• If the ML system performs better than us - can we enhance our human performance
by learning from the ML system?
To examine these questions we needed to incorporate visual explanatory techniques into our model. Class Activation Map (CAM) is a highly successful and easily interpretable strategy of extracting predictive information from a CNN. Through backpropagation of the network response from a prediction a heatmap can be generated. In other words, the heatmap will visually light up areas of interest by the predictive model.
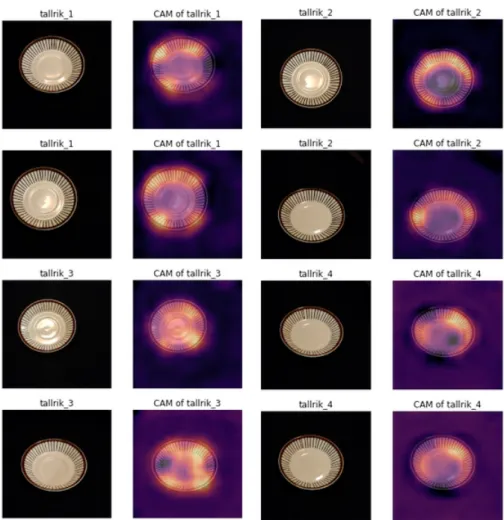
To push the boundaries of the model at this stage, the amount of data was increased to 192 images for training and 64 images for validation evenly distributed across four plates. Our first implementations of CAM resulted in cluttered results as seen in Figure 8. Grad-CAM is a further development of the initial CAM. Implementations of Grad-CAM showed improved results as seen in Figure 12. Using Guided Grad-CAM was considered but we found it harder to interpret.
Figure 8: Samples from validation data and its corresponding CAM result generated from the trained model.
From this experiment we learned that we had to increase the size of our input images since the size of 299x299 pixels was simply too small and not compatible to generate
a comprehensible CAM result. Therefore the size of the input image was increased to 640x640. This also showed to have a positive effect to the training process by decreasing the number of training epochs in order to reach the error rate goal.
Figure 9: Confusion matrix of validation data of our trained model using 64 validation images.
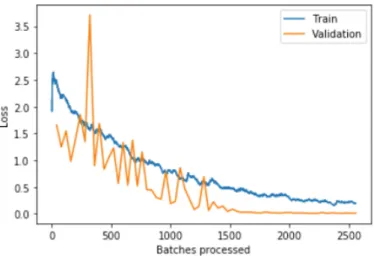
Figure 10: Training and validation loss over N training batches.
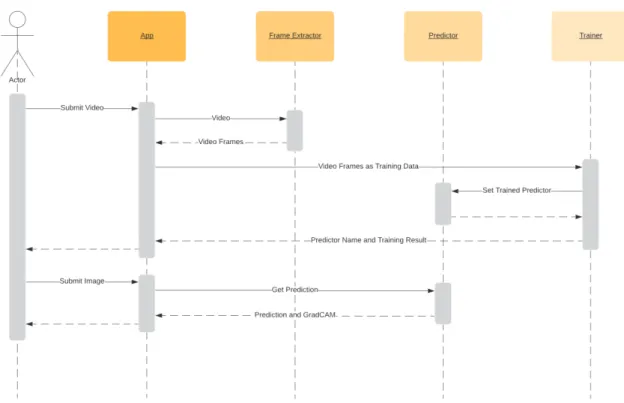
At the current stage the architecture may be explained by the sequence diagram at Figure 11.
Figure 11: Sequence diagram representing the procedure of submitting video to predict image.
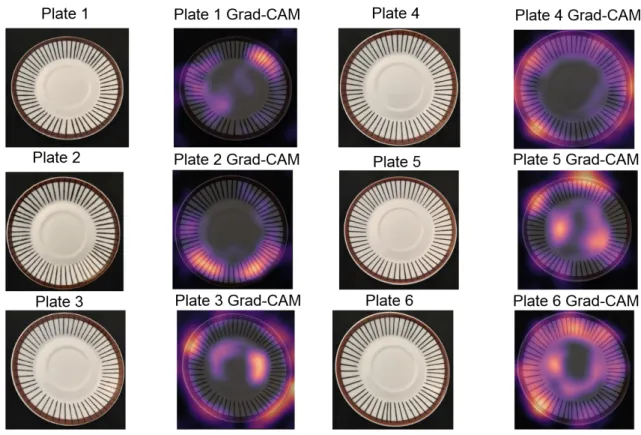
Figure 12: Original and generated Grad-CAM for each plate.
As we explored these explanatory tools for CNN’s we managed to finalize the end destination of where this study would go. When we were experimenting and researching we found a, to our knowledge, under-researched area. An angle of which we could conduct a controlled experiment [21] and hopefully contribute to something of substance. The angle we found possible with our system was to examine that, given a situation of when a machine learning system outperforms humans on a given task and are able to produce an explanation of it’s performance - can it be used to improve human capabilities? How well does the current state of the art visual explanatory tool work in such a situation? More specifically, we could not find any studies of where tools of such had been studied in a
machine teaching situation.
5.3.1 Interpretable Machine Learning, User Testing
In this experiment we simulate a machine teaching scenario according to the third phase of ML system development described in section 3. That is, when a ML system outperforms a human on a given task but has the ability to explain it’s decision. More specifically, what we are researching in this experiment is how well does the current state of the art visual explanatory machine learning tools work in a teaching scenario. The goal of this experiment is to analyze the human interaction with an explanatory state-of-the-art tool from a qualitative approach. We want to study the human perception of collaborating in a learning scenario with such a tool, rather than measuring the actual accuracy of the technique. What we mainly looked at were aspects such as how the human trusts the ML
system explanation, interprets the explanations and whether the human prefers using a tool like Grad-CAM or not.
We do this by comparing human participants to our trained model. The task of the experiment is to learn to identify the six plates described in section 4.1. Our trained model is able to do so at an accuracy rate of almost 100%. The human accuracy rate, what we call human baseline, is measured in order to prove that our model has superhuman abilities to perform this task. The reason we increased the number of plates from four to six at this stage was to increase the complexity of the task, pushing the boundaries of the model.
To evaluate the explainability of Grad-CAM an experiment was conducted with a control group and a test group. Both groups are used to measure the human baseline and will conduct the first part of the experiment. By isolating a control group we compare the test group who have access to the Grad-CAM images extracted from our trained model to the control group that doesn’t. We wanted to see both if there is a difference between the performance of the groups and how the group who performs the task with the Grad-CAM images experiences the explanations in order to see how they are perceived as beneficial for the given task.
What we chose to do is to have a homogeneous group in order to get a good under-standing of an isolated population. All 8 participants of this experiment are people in the age of 20-30 and are all, or have been within the past 2 years, students at the fac-ulty of Technology and Society at Malmö University. The gender of the participants were completely mixed, meaning that gender was not considered when selecting participants. The quantitative part of the data collection in this experiment is to define the human baseline and to check for significant differences between the control and test groups. How-ever, interviewing each participant about the experience of using such a technology in this specific context, is what would generate the most insightful answers for our research question. More specifically, is the CNNs explanation in the form of a Grad-CAM image useful/insightful for a human performing the same task?
Phase 1 - Learning Phase In this initial phase the participant will study the plates
with the goal of learning how to identify them. The participant will have a clear view of all the plates in correct order with their corresponding number. Empty paper notes will be placed together with the plates (one note for each plate). On these paper notes the participants will take notes about what they find to be characteristic traits for identifying the specific plate. Participants are allowed to take notes in any way they want, in order to have documented their train of thought. We will then collect the notes. The time allocated for this phase is 5 minutes.
Phase 2 - Test Phase: Single Plate In this phase the participants will be given a task
to identify single plates. We will place a plate on the table in front of the participant and the participant will infer which plate (number) it is. We have a predetermined sequence of numbers that determines in which order the participant will see a specific plate to ensure that all experiments will be identically executed. All participants will see the plates in the same sequence. The six plates will be shown three times at a total of 18. The participant is allowed to inspect however he/she wants without looking at the bottom of the plate, since the correct number is there. Participants does not have access to their notes in this phase.
Phase 3 - Test Phase: Multiple Plates This phase will present the participant with
another task. The task is also a plate identifying task. However, the participant will be given a pile with all the six (6) plates and shall place them to the correct number. The pile of plates will be shuffled, but the shuffled order is predetermined to ensure that all participants tasks are identical. This phase is done once. Participants does not have access to their notes in this phase.
Phase 4 - New Learning Phase In this phase half of the participants will get their
notes back to supplement them with new notes and/or drawings. The other half will, instead of their own notes, get a visual explanation in the form of Grad-CAM images for each picture. The pictures given is how our ML system explains where it looks to identify the plates. Participants are encouraged to make notes in these pictures as well. Just like in phase 0, the plates will be available for inspection during this phase. Time allocated is 5 minutes.
Phase 5 - Tasks This phase repeats phase 2 and phase 3. Even though the experiments
focus is mainly to record qualitative results, we still want to be able to catch quan-titative factors that may prove a significant difference between the groups. Also this stage is needed to record the experience of the tasks after Grad-CAM interaction.
Interview Questions After we perform the tasks with the participants we hold a
semi-structured interview in order to get some qualitative data about their experience.
• Describe your memory strategy.
• Did you find the ML system explanation useful? Please elaborate.
The quantitative results of each participant are presented in Table 1 and Table 2 while the average improvements are presented in Figure 13. The average improvement from session 1 to session 2 in the control group was 34% while it was 44% in the test group. At the end of session 1, the control group performed slightly better than the test group but at the end of session 2, both groups performed with around the same accuracy. The variance of the control group is substantially higher compared to the test group.
Participant Session 1 Session 2 1 0.83 0.89 2 1.00 1.00 3 0.33 0.44 4 0.22 0.83 Average 0.59 0.79
Participant Session 1 Session 2 5 0.38 0.78 6 0.61 0.78 7 0.56 0.83 8 0.61 0.72 Average 0.54 0.78
Table 2: Test group, single plate human experiment.
Figure 13: Average accuracy single plate human experiment. Control versus test group across first and second session.
While focusing on the average improvement between session 1 and 2 it seems like the test group was improving better than the control group. Worth noting is that the control group had higher average accuracy at session 1 which therefore led to a more challenging score to improve. However, as the experiment targeted qualitative aspects rather than quantitative these results are not to be taken conclusively.
One interesting thing we noticed in retrospect of conducting the user testing was that all participants seemed to have an impression that our CNN had the ability to flawlessly identify all the plates, even though we never mentioned anything about its performance. We believe that this raises interesting questions about trust. More specifically, in our case for an explanatory ML system it raises questions about how much the explanation provided by the ML system justifies a blind trust. Evaluating trust between human and machine was not in the scope for our experiment. We do, however, believe that this would be an important scope for future studies. Understanding how people establish trust for such a system could be very insightful regarding design principles for a machine teaching system. From a research through design-perspective, this would be a highly suitable next experiment.
The interviews we held with participants who got to study with Grad-CAM resulted in interesting insights about their interpretation of the explanations given. Several par-ticipants phrased that they interpreted that Grad-CAM was looking at very small details of which it presented as important highlights. The participants was under the impres-sion that their memory strategy was very different from our models since they were often
looking at different parts of the plate. One participant argued that it felt like he used a general heuristic-based memory strategy, compared to the model who is able to spot very subtle distinctions details in the plates. This might be true, but in any case it still raises interesting questions about how the model conveys its explanation. The same participant who raised this issue also said that “if there is a strategy the model is trying to teach me - I’m not understanding it”. He then proposed that a text complement with explanations would be very beneficial. For instance “I’m looking here because of this...”. However, to clarify, this specific participant did not find the explanations useful in order to incorporate his own strategy as a whole, but did give him insights about details that he could look for - but chose not to because it did not fit his memory strategy. Another participant got very interested in studying the details presented by Grad-CAM. While she was doing it she felt that it was sometimes beneficial but sometimes confusing during the training phase. What is especially interesting with this participant is that when she later was given the single plate task, after studying with Grad-CAM is that she felt that she could notice new details and reminisce them, making a connection to the Grad-CAM explanation.
Furthermore, other participants felt that when the Grad-CAM explanation was looking at the same part of a plate it boosted the their confidence in their strategy. Especially one specific participant (#7) who had a graphic memory strategy. As she was studying the plates she drew images of the plates and what she found to be a characteristic trait of the given plate. When she was given the Grad-CAM explanations and the images looked similar to her own, she felt that the model confirmed her strategy, leading to an increased confidence in the task. When Grad-CAM presented a highlight of a plate that she hadn’t observed, she felt that it was easy to incorporate the explanation into her own notes. She felt that the Grad-CAM explanations overall had a positive effect on her memory strategy. One notable result is the accuracy rate of participant #2 who scored each and every plate correctly. When we interviewed her afterwards we found out that she was an actual domain expert who was not only well known to these specific plates, but hand painted designer plates in general. What is specifically interesting about her results is that her memory strategy was not unique compared to the other participants. However, she did have a deeper knowledge of hand painted designer plates which in this case means that she had a good understanding of different type of traits to distinguish between the plates. When she found something to be unique she was very confident in her strategy, answering the identification tasks almost immediately whereas other participants would inspect the plates for a longer time to find their answer. Looking at her results raised ideas about how this type of experiment could be done in a setting where all participants are domain experts for the given context. Nonetheless, this will be further discussed as future work.
The quantitative parts of our user test gave us rough understanding about the learning rate of the participants. However, the number of participants and narrow target group is not enough to make general judgements.
The user testing was conducted in a qualitative manner and we got satisfying answers from the questions we asked. Approaching similar user testing quantitatively, therefore excluding the interview, would produce interesting results as well. Compared to qualitative testing, a quantitative study might answer questions such as accurate conclusions about Grad-CAM being an efficient method in a machine teaching environment and the number of participants using Grad-CAM as a learning tool.
1 and 2 from our qualitative experiment. The participants will not be able to touch the plates but will be presented images instead. Like our experiment the test group will be presented Grad-CAM for the next phase of the experiment while the control will not. By the end of the quantitative experiment the participant will be asked to answer structured questions compared to our qualitative experiment where the participant was asked to answer semi-structured questions.
5.4 The Other-element
During this stage we experimented with the stability of the model. At this stage we used a model fitted on four classes. Testing the model with random noise as input we expected a distribution between the predicted classes, i.e. 25% for class one, 25% for class two and so on using four classes. However, the model always predicted one certain class instead of an even distribution. These results seemed to be true for multiple tests using different kinds of noise. Figure 14 and 15 shows examples of testing grayscale and colored noise inputs.
Figure 15: Prediction and Grad-CAM from colored noise as input.
Instead of testing noise we tried using other plates that was not included in the training data set. For these plates the model made the same predictions as the noise inputs. We believe that the model is fitted to recognize features of three of the classes, if no features are found then the model predicts the input to likely belong to the fourth class. This error is commonly known as unknown unknowns[24]. As discussed by Anthony Liu et al. this kind of problem occurs when there exists a blind spot due to missing data in the training set. The goal of this step was to investigate a new approach to detect unknown unknowns. We believed that one way of solving the problem is to augment data representing any other class outside the training data, we call this class the Other-element. The strategy of augmenting data to represent the other-element is plausible since the images of the training set was taken in a homogeneous environment compared to the study conducted by Anthony Liu et al. where they tried to detect unknown unknowns in a general context. We fitted a Wasserstein GAN-architecture (WGAN) [2] to the data set with the intent of generating images similar, but not identical, to the data set. In a successful case the generated images will represent the other-element which the image classifier could then be trained on. The initial image classifier would then be able to predict classes plate_1 to plate_4 and an additional class representing the other-element. However, our WGAN could not generate images qualitative enough for fitting the image classifier nor could they be a substitute for the other-element as presented in figure 16.
Figure 16: Samples of generated images from our WGAN.
Solving the problem of detecting data which is outside of the training data space using CNNs holds great value. The effects of such solution may solve problems where only one class is known. For the particular problem of only one class, a model would be able to detect whether a test object is included in the training set or not. For agricultural purposes a model may be fitted to wanted crops, e.g. corn, and let anything other than the wanted crop be predicted as unwanted plants, e.g. weeds. The gain of using a Other-element approach is that the training set may not require unwanted plants to be included.
Applying the solution of the Other-element in multiple class environments may be valuable too. In our example we wanted to find plates that deviated from the training set in order to create a class representing similar, but not identical, data points as those found in the training set. Our initial approach to augment suitable data representing the Other-elements was using WGAN. Early results as seen in figure 16 did not convince us that WGAN is optimal and more research is needed. We did not find literature solving this problem using synthetically augmented data generated from GAN but we believe it may have potential to be a major step towards stable image processing algorithms using deep neural networks.
6
Discussion
6.1 Design Implications for Future Interpretable Systems
In section 5.3.1 we described how we conducted a user testing experiment to gain qual-itative insights concerning the experience of using an explanatory tool in a simulation of a machine teaching scenario, according to the three-step analogy described in section 3. One key finding from that experiment was that the more a participant could relate the Grad-CAM explanation to his or her own memory strategy, the more positive of an experience the participant had. The finding itself may not be that surprising, however, it does raise interesting questions about the design of explanations for other type of use cases. What we tested was rather the possibility of machine teaching for one very specific case - to identify hand painted plates which looks similar but are unique, unknowingly of how well our participants would accomplish the task. However, consider the case of which we conduct a similar experiment where we know that each participant is a domain expert. We believe that this would be an interesting step forward in this research, as we could research domain specific elements for further design implications in various domains.
Figure 17: Illustration made by Dudley and Kristenssons, displaying structural breakdown of a generic interactive machine learning system [11]
In Dudley and Kristenssons comprehensive study A Review of User Interface Design for
Interactive Machine Learning they suggest the structural composition of a generalised IML
interface [11]. Reviewing a system from their point of view, we believe that our approach of evaluating explanatory tools, such as Grad-CAM, could contribute with valuable insights. More specifically, a composition they call Model inspection which is an interface that provides users an inspection of a model. The inspection itself can take various forms, such as accuracy and confidence, but is not limited to that. What we believe that our work can contribute to their framework is a suggestion of an approach to evaluate explanatory techniques that would foster model inspection. As visualized in Figure 17, Dudley and
Kristensson selves suggest that that a visualization of the data and the model is the
central component for the interface. This gives us further motivation to suggest continuous work on evaluating explanatory techniques for machine learning models from different perspectives as they are multifaceted. What we mean by that is there are several different aspects to be evaluated in a direct human setting. The possible fields of research that emerges here are very broad, we imagine questions such as cultural differences in attitude or trust towards machine explanations to more cognitive detailed approaches.
6.2 Trust
As mentioned in the results of our user testing, we never mentioned to the participants how well our model could perform the task that they were to do. However, all participants were under the impression that it had a flawless identification ability. This means that they displayed a blind trust to our model. As discussed earlier, a motivation for interpretable ML is to establish trust and we find these trust levels very interesting. However, when discussing these results it is important to point out our homogeneous demographic of students from the faculty of Technology and Society at Malmö University. Our ability to gain deeper insights surrounding this question in regards to our study is limited as it is was an “accidental” result, something we happened to pick up during the interviews but did not gather further information about as it wasn’t in the scope of the current study. For a future study, we’d suggest adopting a structured approach to gaining deeper insights about how participants establish trust for an interpretable model.
6.3 Applied Knowledge Quadrant
As described in section 5.4 we were faced by the issue of detecting plates outside of the training data space. As stated earlier it’s a common error also known as Unknown Knowns. Applying our context in Munros Knowledge Quantrant could look like following:
Known Knowns: Confident predictions of our plates. Known Unknowns: Non-confident prediction of our plates.
Unknown Knowns: Input images of plates outside of the training data set. Unknown Unknowns: Unrelated input images, e.g. noise.
Our model works as expected when challenged with Known Knowns as well as Known Unknowns. However, in the case of introducing a previously unseen but similar plate to our collection would result in Unknown Knowns-errors. Given a scenario of a plate-collector you want the model to be able to say that the data given is an Unknown Known, i.e “This plate looks similar, but I have not seen it before”. We believe this would be an interesting issue to solve, as we believe a model that is able to do so could potentially be the basis of improved interpretability. It is of course a matter of definition what is similar and in the case of an Unknown Known error it is interesting if the system can communicate what it constitutes as similar in an interpretable fashion. What constitutes the border between Unknown Known and Unknown Unknowns is also a matter of definition around what is not similar and consequently the system not can produce any interpretation for.
Research has approached the problem of solving Unknown Unknowns for images un-related to the training data set. Images closely un-related but not identical to the training set, i.e. Unknown Knowns, is currently missing in the literature. Our work indicates that one promising approach is to synthesize data from the training set, e.g. using generative adversarial networks as stated in section 5.4.
7
Conclusion
Our work set out to explore two aspects within the context of machine learning. (1) The ability of ResNet-50 to identify objects within the same class that humans finds similar. (2) Implications for design principles of interpretable machine learning systems. Through an explorative approach we design prototypes to help us evaluate technical details as well as insights from user testings. Our work shows that there is a potential for current state-of-the-art visual explanatory tools in a machine teaching scenario, however, further work has to be put in for direct human interaction, which is discussed in greater detail in the discussion section. However, to summarize what we suggest is adopting explanatory techniques in direct human settings of different context in order to gain deeper insights about the experience of usage in a real world scenario.
A missing part of the literature that we discovered is about the Other Class as discussed in section 5.4. For future work, we suggest exploring ideas to augment data representing Unknown Knowns using generative adversarial networks. We initially thought WGAN fitted to the data space would generate images outside the data space, therefore solve the issue, but our augmented data was not qualitative enough.
References
[1] Stanislaw Antol, Aishwarya Agrawal, Jiasen Lu, Margaret Mitchell, Dhruv Batra, C Lawrence Zitnick, and Devi Parikh. Vqa: Visual question answering. In Proceedings
of the IEEE international conference on computer vision, pages 2425–2433, 2015.
[2] Martin Arjovsky, Soumith Chintala, and Léon Bottou. Wasserstein gan. arXiv preprint arXiv:1701.07875, 2017.
[3] Gagan Bansal and Daniel S Weld. A coverage-based utility model for identifying unknown unknowns. In Thirty-Second AAAI Conference on Artificial Intelligence, 2018.
[4] Rich Caruana, Yin Lou, Johannes Gehrke, Paul Koch, Marc Sturm, and Noemie El-hadad. Intelligible models for healthcare: Predicting pneumonia risk and hospital 30-day readmission. In Proceedings of the 21th ACM SIGKDD international
confer-ence on knowledge discovery and data mining, pages 1721–1730, 2015.
[5] Xinlei Chen, Hao Fang, Tsung-Yi Lin, Ramakrishna Vedantam, Saurabh Gupta, Pi-otr Dollár, and C Lawrence Zitnick. Microsoft coco captions: Data collection and evaluation server. arXiv preprint arXiv:1504.00325, 2015.
[6] Council of European Union. Council regulation (EU) no 679/2016, 2014. http://data.europa.eu/eli/reg/2016/679/2016-05-04.
[7] Abhishek Das, Satwik Kottur, Khushi Gupta, Avi Singh, Deshraj Yadav, José MF Moura, Devi Parikh, and Dhruv Batra. Visual dialog. In Proceedings of the IEEE
Conference on Computer Vision and Pattern Recognition, pages 326–335, 2017.
[8] Abhishek Das, Satwik Kottur, José MF Moura, Stefan Lee, and Dhruv Batra. Learn-ing cooperative visual dialog agents with deep reinforcement learnLearn-ing. In ProceedLearn-ings
of the IEEE international conference on computer vision, pages 2951–2960, 2017.
[9] Harm De Vries, Florian Strub, Sarath Chandar, Olivier Pietquin, Hugo Larochelle, and Aaron Courville. Guesswhat?! visual object discovery through multi-modal dialogue. In Proceedings of the IEEE Conference on Computer Vision and Pattern
Recognition, pages 5503–5512, 2017.
[10] Jia Deng, Wei Dong, Richard Socher, Li-Jia Li, Kai Li, and Li Fei-Fei. Imagenet: A large-scale hierarchical image database. In 2009 IEEE conference on computer vision
and pattern recognition, pages 248–255. Ieee, 2009.
[11] John J Dudley and Per Ola Kristensson. A review of user interface design for interac-tive machine learning. ACM Transactions on Interacinterac-tive Intelligent Systems (TiiS), 8(2):1–37, 2018.
[12] Hao Fang, Saurabh Gupta, Forrest Iandola, Rupesh K Srivastava, Li Deng, Piotr Dollár, Jianfeng Gao, Xiaodong He, Margaret Mitchell, John C Platt, et al. From captions to visual concepts and back. In Proceedings of the IEEE conference on
[13] Chuang Gan, Naiyan Wang, Yi Yang, Dit-Yan Yeung, and Alex G Hauptmann. De-vnet: A deep event network for multimedia event detection and evidence recounting. In Proceedings of the IEEE Conference on Computer Vision and Pattern Recognition, pages 2568–2577, 2015.
[14] Haoyuan Gao, Junhua Mao, Jie Zhou, Zhiheng Huang, Lei Wang, and Wei Xu. Are you talking to a machine? dataset and methods for multilingual image question. In
Advances in neural information processing systems, pages 2296–2304, 2015.
[15] Ian J Goodfellow, Jean Pouget-Abadie, Mehdi Mirza, Bing Xu, David Warde-Farley, Sherjil Ozair, Aaron Courville, and Yoshua Bengio. Generative adversarial networks. In Annual Conference on Neural Information Processing Systems (NeurIPS), pages 2672–2680, 2014.
[16] Ian J Goodfellow, Jonathon Shlens, and Christian Szegedy. Explaining and harnessing adversarial examples. arXiv preprint arXiv:1412.6572, 2014.
[17] Kaiming He, Xiangyu Zhang, Shaoqing Ren, and Jian Sun. Deep residual learning for image recognition. In Proceedings of the IEEE conference on computer vision and
pattern recognition, pages 770–778, 2016.
[18] Andreas Holzinger, Markus Plass, Katharina Holzinger, Gloria Cerasela Crisan, Camelia-M Pintea, and Vasile Palade. A glass-box interactive machine learning ap-proach for solving np-hard problems with the human-in-the-loop. arXiv preprint arXiv:1708.01104, 2017.
[19] Jeremy Howard et al. fastai. https://github.com/fastai/fastai„ 2018.
[20] Justin Johnson, Andrej Karpathy, and Li Fei-Fei. Densecap: Fully convolutional localization networks for dense captioning. In Proceedings of the IEEE Conference
on Computer Vision and Pattern Recognition, pages 4565–4574, 2016.
[21] Andrew J Ko, Thomas D Latoza, and Margaret M Burnett. A practical guide to con-trolled experiments of software engineering tools with human participants. Empirical
Software Engineering, 20(1):110–141, 2015.
[22] Alex Krizhevsky, Ilya Sutskever, and Geoffrey E Hinton. Imagenet classification with deep convolutional neural networks. In Advances in neural information processing
systems, pages 1097–1105, 2012.
[23] Zachary C Lipton. The mythos of model interpretability. Queue, 16(3):31–57, 2018.
[24] Anthony Liu, Santiago Guerra, Isaac Fung, Gabriel Matute, Ece Kamar, and Walter Lasecki. Towards hybrid human-ai workflows for unknown unknown detection. In
Proceedings of The Web Conference 2020, pages 2432–2442, 2020.
[25] Jonathan Long, Evan Shelhamer, and Trevor Darrell. Fully convolutional networks for semantic segmentation. In Proceedings of the IEEE conference on computer vision
[26] Mateusz Malinowski, Marcus Rohrbach, and Mario Fritz. Ask your neurons: A neural-based approach to answering questions about images. In Proceedings of the
IEEE international conference on computer vision, pages 1–9, 2015.
[27] Robert Munro. Human-in-the-loop machine learning. Manning Publications, 2019. [28] Maithra Raghu, Chiyuan Zhang, Jon Kleinberg, and Samy Bengio. Transfusion:
Un-derstanding transfer learning for medical imaging. In Advances in Neural Information
Processing Systems, pages 3342–3352, 2019.
[29] Mengye Ren, Ryan Kiros, and Richard Zemel. Exploring models and data for image question answering. In Advances in neural information processing systems, pages 2953–2961, 2015.
[30] Marco Tulio Ribeiro, Sameer Singh, and Carlos Guestrin. Why should i trust you? explaining the predictions of any classifier. In Proceedings of the 22nd ACM SIGKDD
international conference on knowledge discovery and data mining, pages 1135–1144,
2016.
[31] Ramprasaath R. Selvaraju, Michael Cogswell, Abhishek Das, Ramakrishna Vedan-tam, Devi Parikh, and Dhruv Batra. Grad-CAM: Visual explanations from deep networks via gradient-based localization. International Journal of Computer Vision, 128(2):336–359, October 2019.
[32] Karen Simonyan, Andrea Vedaldi, and Andrew Zisserman. Deep inside convolutional networks: Visualising image classification models and saliency maps. arXiv preprint
arXiv:1312.6034, 2013.
[33] Jost Tobias Springenberg, Alexey Dosovitskiy, Thomas Brox, and Martin Riedmiller. Striving for simplicity: The all convolutional net. arXiv preprint arXiv:1412.6806, 2014.
[34] Pieter Jan Stappers. Doing design as a part of doing research. In Design research
now, pages 81–91. Springer, 2007.
[35] Chuanqi Tan, Fuchun Sun, Tao Kong, Wenchang Zhang, Chao Yang, and Chunfang Liu. A survey on deep transfer learning. In International conference on artificial
neural networks, pages 270–279. Springer, 2018.
[36] Kush R Varshney. Engineering safety in machine learning. In 2016 Information
Theory and Applications Workshop (ITA), pages 1–5. IEEE, 2016.
[37] Oriol Vinyals, Alexander Toshev, Samy Bengio, and Dumitru Erhan. Show and tell: A neural image caption generator. In Proceedings of the IEEE conference on computer
vision and pattern recognition, pages 3156–3164, 2015.
[38] Matthew D Zeiler and Rob Fergus. Visualizing and understanding convolutional networks. In European conference on computer vision, pages 818–833. Springer, 2014.
[39] Yu-Jie Zhang, Peng Zhao, and Zhi-Hua Zhou. Exploratory machine learning with unknown unknowns. arXiv preprint arXiv:2002.01605, 2020.
[40] John Zimmerman, Erik Stolterman, and Jodi Forlizzi. An analysis and critique of re-search through design: towards a formalization of a rere-search approach. In proceedings