Road Safety and Simulation
International Conference
RSS2013
October 23-25, 2013
Rome, Italy
Realism of overtaking situations in motion based driving
simulators
Fredrik Bruzelius
Researcher, PhD
Swedish National Road and Transport Research Institute/ Chalmers University of Technology
Box 8072, SE-402 78 Gothenburg, Sweden
fredrik.bruzelius@vti.se, +46 31 750 2605
I.C.MariAnne Karlsson
Professor
Chalmers University of Technology SE-412 96 Gothenburg, Sweden
mak@chalmers.se, +46 31 772 1108
Bruno Augusto
Research assistant
Swedish National Road and Transport Research Institute Box 8072, SE-402 78 Gothenburg, Sweden
ABSTRACT
The credibility of the research results of driving simulator studies is highly dependent on the realism that the simulator is capable of producing. A key component is therefore how realistic the driving is perceived by the drivers (test subjects). Overtaking is a frequently occurring traffic situation (as well as one of the highest risk manoeuvres). The aim of the present study was to enhance the perceived realism of overtaking situations in a motion-based driving simulator by introduce aerodynamic forces and moments. An earlier developed real time model of the aerodynamic forces and moments was been implemented and tested in a study with test drivers. With an appropriate scaling of the forces and torques it was shown that the perceived realism can be enhanced by the introduction of these effects.
Keywords: Overtaking, aerodynamic forces, perceived realism, driving simulators.
INTRODUCTION
Driving simulators offer a highly repeatable environment for studying vehicle and driver interactions. The credibility of the research results of driving simulator studies is highly dependent on the realism that the simulator is capable of reproducing. This is confirmed in a number of validation studies such as Alm (1997) and Jamson (2011). A key component is therefore how realistic the driving is perceived by the drivers (the test subjects).
The realism perceived is connected to the fidelity of the driving simulator, in terms of sound, graphics, etc. (see e.g. Alström et al., 2012). Motion-based driving simulators represent a class of high fidelity simulators where the forces and accelerations that a vehicle driver experiences can be simulated by a moving platform. A study by Alm (1997) showed that motion based driving simulators offer a higher perceived realism compared to a fixed-base simulator, i.e. where there are no simulation of accelerations and forces by a moving platform.
The motions of the platform in a motion-based driving simulator are controlled and generated by a set of algorithms that can be divided into two major groups; motion cueing algorithms and models of the vehicle and the physical environment. The vehicle dynamics model and models of the physical environment are designed to mimic real environments and real vehicle characteristics with a focus on the accelerations and forces that are impacting the vehicle. The motion cueing algorithm (e.g. Fischer et. al., 2010; Fischer et. al., 2011) is responsible for actuating the forces and accelerations that the vehicle dynamics model is generating via motion of the platform. The objective of the actuation is not necessarily always to actuate the forces and accelerations with a one to one scaling. The algorithm needs to respect the motion limitations of the platform, i.e. limited stroke of the linear motions, limited acceleration capabilities etc. There are studies that show that some motions in the simulator need to be scaled down in order to not be perceived as exaggerated by drivers (e.g. Jamson, 2010).
Overtaking is a frequently occurring traffic situation, as well as one of the highest risk manoeuvres present in ordinary traffic environment (see e.g. Clarke et. al. 1998). It is therefore a situation that is important to study also in simulator studies. However, in order to do so it is
imperative to ensure that drivers perceive the situation as realistic and, hence, to introduce the relevant aerodynamic forces and moments.
The aim of the present study was to enhance the perceived realism of overtaking situations in a motion-based driving simulator by introducing aerodynamic forces and moments. There are, however, no reference measures available of how large these forces and moments are in a real overtaking situation. Hence, the objective of the study was to tune the levels according to driver perception.
EARLIER RESEARCH
Crosswind and aerodynamic effects of crosswinds on the interaction between driver and vehicle have been studied in driving simulators, for instance by Maruyama and Yamazaki (2006) who used an aerodynamic coefficient to determine the forces and moments of the vehicle. In Juhlin (2009) the effects of crosswind on buses were studied and the crosswind forces and moments were played sequences in the driving simulator. However, aerodynamic force and moments in an overtaking situation have not yet been explored in a driving simulator setting.
Effects of aerodynamic forces and moments in overtaking situations have been studied experimentally in wind tunnels by Noger et al. (2005) and Noger and Grevenynghe (2011) and numerically by Corin et al. (2008) and Uystepruyst and Krajnovi´c. (2013) using Navier-Stokes equation. These studies show that the two most important forces and moments generated by aerodynamic interaction in terms of magnitude and importance for driver and vehicle trajectory are the lateral force and the yawing moment. It is also clear that the combination of a car overtaking a truck is among the most interesting scenarios as it produces the highest level of aerodynamic interaction between the vehicles and the largest impact on the overtaking car. Hence, the scenario of a car overtaking a truck was selected in the present study. From the literature we can also conclude that all set-ups (wind tunnel and numerically) were carried out on downscaled size vehicles. Furthermore, there is, to the authors’ knowledge, no study conducted on real scale vehicles in this context.
The tools to simulate and reproduce aerodynamic forces and moments, i.e. Navier-Stokes equations, are not suited for real time computation. In a driving simulator environment there is an inherent requirement for real time computation as the driver is included in the response. Hence, in Bruzelius et al. (2013a) a simplified approach was used to simulate the forces and moments by the use of pressure distributions and simple convolution between vehicles. This approach was implemented for the present study, and the vehicle dynamics model developed in Bruzelius et al. (2013b) was used to produce the motion of the vehicle.
A NEW AERODYNAMICS MODEL
Here, the main results in Bruzelius et al. (2013a) are presented and discussed along with the implementation. The computational complexity of this application outweighs the required accuracy of the force and moment. Hence, a simplified model was derived based on steady state pressure distributions. The assumption that all pressure interactions obey superposition, i.e. linear effect and that the vehicles’ pressure distributions do not change with the interaction between them, leads to a model that uses pressure distribution of the truck’s side to generate the
pressure imbalance of the overtaking car. This leads to a convolution between the truck’s pressure distribution and a square wave representing the vehicle for the side force and a saw tooth wave representing the lever for the moment. In experiments it has been shown that the dependence of lateral spacing between the vehicles as well as the relative speed between them can be expressed as a scaling exponential function. The overall model can be expressed as
∫
∫
where the is the air density, is the relative longitudinal distance between the two vehicles, the marginal pressure coefficient of the truck, the normalized spacing, the truck speed, the relative speed and and the distance to center of gravity of the car in the longitudinal direction. The two convolution integrals can be implemented in discrete distance using finite impulse response filters, which have implementation/computational advantages over direct numerical implantation of the convolution integrals.
The simple model described by the integrals above uses a so called marginal pressure distribution coefficient which could be obtained by solving the Navier-Stoke equations. The side pressure as a function of the longitudinal position of the truck can be used while driving in an isolated environment without surrounding vehicles in steady state. Hence, each vehicle overtaken in the simulator needs to have one fixed pressure distribution associated to it. The pressure coefficient is then taken as the normalized pressure according to
where is the surrounding background pressure. This normalization is used in the model to express the speed dependence of the overtaken truck. The force and moment are often expressed in normalized coefficients (see e.g. Noger and Grevenynghe 2011) as for instance for the car
where is the frontal area of the car and is the wheelbase of the car. These coefficients are used to scale the force and torque to real size vehicles from the dimensions used in e.g. Bruzelius et al. (2013a).
EXPERIMENTAL SETUP
In order to tune the levels according to driver perception, a simulator study was set up. More specifically, the overall objective of the study was to tune the “strength” of the influence of the aerodynamic force and moment in the overtaking situations and determine the increase of perceived realism by introducing these quantities in the simulator environment. The study, with a
total number 20 test subjects (13 men and 7 women, mean age 44.8 (±5.3) years, with a driving experience of on average 26.9 (±3.5) years and driving on average more than 18 000 km/year), was broken down into three consecutive sub-studies (Tests I, II, III) due to insights during the experiments described below.
The experiment design was based on an initial thought to use the scaling proposed in previous section to obtain a force and a moment that correspond to real size overtaking vehicles. The “strength” or intensity to be tuned in the test was then the scaling of the motion cueing algorithm. It should be noted that the motion cueing only affected the driver’s perceived forces and moments and not the vehicle dynamics and vehicle response to the overtaking. The magnitude of the forces and torques was determined by the normalized coefficients describe in previous section.
However, all test subjects experienced a highly exaggerated force and motion of the vehicle, independently of the motion cueing scaling. The motion of the vehicle is only connected to the motion cueing indirectly, through the driver. Hence, it was concluded that the scaling suggested by normalized coefficients in the previous section was overestimating the force and moment. Consequently a redesign of the experiment was made, where this first part with motion cueing scaling was cut out (Test I). A Test II was therefore designed to tune a scaling of the force and moment while the motion cueing parameters were held constant to a “normal” level used daily in the simulator. The resulting setting, the most promising one in the second test, was then used in Test III. The main purpose of this third test was to evaluate the realism of a scenario with the aerodynamic effects compared to without and to study the drivers’ overtaking behaviour.
In all three tests, the subjects were asked to drive as normal as possible on a motorway with the speed limit of 110 km/h. In order to keep this speed they were forced to overtake other vehicles. They were not informed of the specific purpose of the study, only that they were to rate the realism of the drive in general. During their drive they were therefore asked to rate their perceived realism of various aspects such as sound and graphical environment. However, when a truck overtaking was completed some specific questions were asked regarding the perceived realism of the overtaking, but not explicitly on the motion and the forces. The driver rated perceived realism with a scale from 1 to 10 where 1 corresponds to totally unrealistic while 10 corresponds to totally realistic. A complementary, longer interview was conducted with all participants after each completed drive.
In each test, six trucks were overtaken by all test subjects and each truck overtaking represented a scenario (Table 1). Tests I and II included three scenarios repeated twice while Test III included only two scenarios. The order by which the scenarios were presented was balanced.
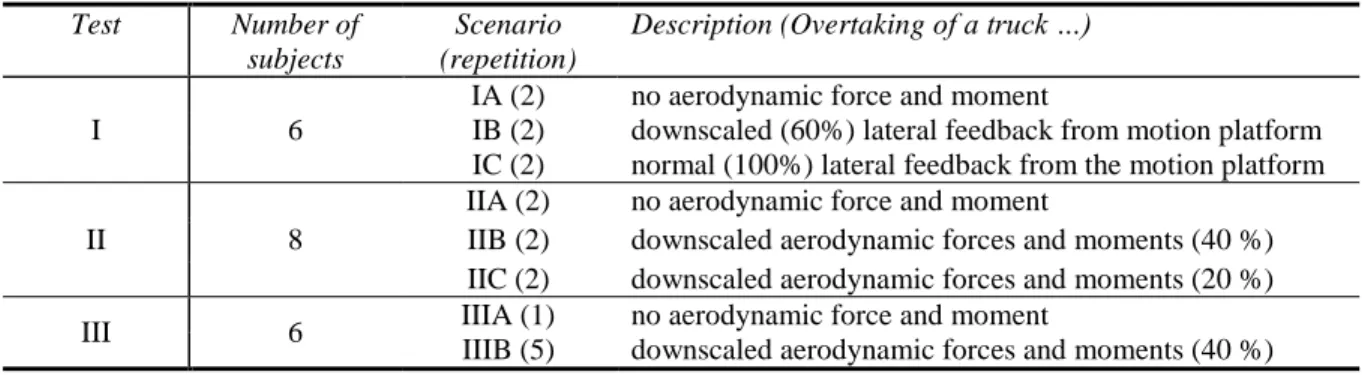
Table 1 The scenarios of all three sub-studies and their corresponding number of participants
Test Number of subjects
Scenario (repetition)
Description (Overtaking of a truck …)
I 6
IA (2) no aerodynamic force and moment
IB (2) downscaled (60%) lateral feedback from motion platform IC (2) normal (100%) lateral feedback from the motion platform
II 8
IIA (2) no aerodynamic force and moment
IIB (2) downscaled aerodynamic forces and moments (40 %) IIC (2) downscaled aerodynamic forces and moments (20 %) III 6 IIIA (1) no aerodynamic force and moment
IIIB (5) downscaled aerodynamic forces and moments (40 %)
RESULT AND ANALYSIS
In Test I (Table 2), scenario IA was rated as the most realistic but the difference between the scenarios was very small. In addition, when considering the average rating the scenario without aerodynamic force and moment was rated the most realistic but also resulted in the largest standard deviation, which could indicate a larger uncertainty. More information was found in the comments made by the subjects. Regarding scenario IA, several of the subjects mentioned the lack of a ‘wind gust’. Examples of comments were “I felt no wind gust. That could increase” and “OK but actually not enough wind gust”. Regarding scenarios IB and IC, the wind gusts were noted: “I felt the wind gust” but they were not perceived as realistic by all. Regarding scenario IB there were those that subject that said that the car “shook a little bit too much” and addressed what can be interpreted as though the vehicle was moved due to the aerodynamic force and moment in an exaggerated manner, for instance “I felt a sharp movement sideways – as you do
… but not as sharp” and “The car moves too much in the beginning and in the end (of the overtaking)”. Regarding scenario IC the motion cueing appeared exaggerated: “Too much….. Wow …” and “A little bit more than what I am used to.”
Table 2 Rating of scenario realism on a scale from 1(totally unrealistic) to 10 (totally realistic). (N=6)
Scenario
IA IB IC
Mean SD Mean SD Mean SD
6.83 1.95 6,71 1.14 6,67 1.07
In Test II the ratings of perceived realism increased (Table 3) but also in this test the differences between the scenarios were small. This time, however, the scenarios with aerodynamic force and moment were overall rated as being more realistic than the scenario without (compare test I) but there was no difference between the two. The larger standard deviation was found for scenario IIC compared to scenario IIB which may indicate that the subjects felt more uncertain regarding scenario IIC than scenario IIB. Complementary information was found in the comments. Scenario IIA was rated lowest and was “Worse (than the others).” In scenario IIC the ‘side wind’ was still perceived as too strong by some of the subjects, revealed in comments such as “Too strong for such a small truck” and “Wow, that was of a response... it was not realistic at
all”. Scenario IIB was considered “Very realistic” and “More substantial” but there were those
subjects that the wind gust also in this case was too strong.
Table 3 Rating of scenario realism on a scale from 1(totally unrealistic) to 10 (totally realistic). (N=8)
Scenario
IIA IIB IIC
Mean SD Mean SD Mean SD
7.25 1.24 7.31 1.08 7.31 2.24
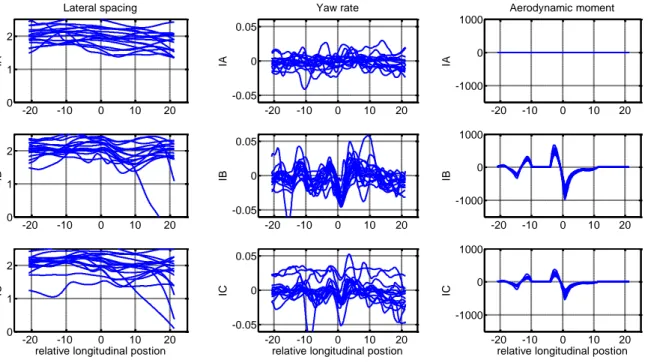
It can be noticed in figures 1 and 2 that the different settings in tests I and II did not have a substantial impact on the lane position during the overtaking. However a difference in the trajectory with and without the force can be observed for all scenarios.
In Figure 1 it can also be observed that the yawing responses of the vehicle for scenarios IA and IB are of similar magnitude, implying that the driver did not compensate differently for the two motion cueing settings. As the driver is part of the feedback loop it is difficult to discriminate between a passive or active compensation of the driver. With a passive response it is meant that the steering wheel motion is induced by the motion feedback platform while in an active response is the steering wheel motion due to driver’s intention. The different levels of motion cueing in Test I suggest that the steering compensation was intended by the driver. It can be noticed that the path after the complete overtaking (i.e. after 4-5 on the x-axis in figure 1) is aligned with the lane. This also suggests that the driver intentionally controlled the vehicle. Furthermore, the drivers’ responses without the aerodynamic force and moment in scenario IA are much more subtle or even absent.
Figure 1 The lateral spacing between the car and truck in meters (left column), the cars yaw rate in radians per second (middle column) and the aerodynamic moment in newton meter (right
column) versus the longitudinal distance between the vehicles in meter for study I. A zero relative longitudinal position is when the two vehicles fronts are aligned.
In Figure 2 it can be noticed that the yawing motion is very much dependent on the level of force and moment that the driver is exposed to during the overaking, i.e. the different scenarios. This might be interpreted as though the response is induced by the motion of the platform (passive driver) as the motion cueing is dependent on the force and moment levels. However, it is also here difficult to discriminate between the driver and the vehicle induced motion in the steering. A similar behaviour in the lane placement can be found (as in Test I), which suggests an active driver during the overtaking. The lane placement is however not substantially changed inbetween all three scenarios.
-20 -10 0 10 20 0 1 2 Lateral spacing IA -20 -10 0 10 20 0 1 2 IB -20 -10 0 10 20 0 1 2 IC
relative longitudinal postion
-20 -10 0 10 20 -0.05 0 0.05 Yaw rate IA -20 -10 0 10 20 -0.05 0 0.05 IB -20 -10 0 10 20 -0.05 0 0.05 IC
relative longitudinal postion
-20 -10 0 10 20 -1000 0 1000 Aerodynamic moment IA -20 -10 0 10 20 -1000 0 1000 IB -20 -10 0 10 20 -1000 0 1000 IC
Figure 2 The lateral spacing between the car and truck in meters (left column), the cars yaw rate in radians per second (middle column) and the aerodynamic moment in newton meter (right
column) and versus the longitudinal distance between the vehicles in meter for study II. In the third test, the test subjects were exposed to the same type of feedback for five trucks and one ‘baseline’ truck without any aerodynamic feedback. In this test the rating of realism increased to, on average 8.7 (±1.1. The difference between the ‘baseline’ overtaking and the overtaking with feedback was noted and commented on. One participant said “There was one
truck when the wind gust did not feel the same way“ and another commented “There were differences in forces, once I felt nothing at all.“ An additional comment regarding the realism of
the scenarios was: “The force was the same throughout, in reality it varies when you pass
different vehicles.”
In table 4 are shown the mean ratings of the 6 test subjects for the scenario with aerodynamic force and moment present in the overtaking, i.e. scenario IIIB. This table can be matched with Figure 3, where all test subjects lane placement is depicted.
Table 4 Rating of scenario realism on a scale from 1(totally unrealistic) to 10 (totally realistic) for Test III for all test subjects and scenario IIIB
Test subject 1 2 3 4 5 6
Rating 7 10 9 10 9 8
A hypothesis is that the rating of realism is reflected in the subject’s lane placement and how the lane placement is changed with the introduction of aerodynamic force and moment. It can be observed in Figure 3, that the trajectories of test subjects 2, 5 and 6 differ noticeably between the baseline scenario without the force and moment and the nominal scenario with the force and moment. However, the ratings of these test subjects do not stand out. In fact, there does not
-20 -10 0 10 20 0 1 2 Lateral spacing IA -20 -10 0 10 20 0 1 2 IB -20 -10 0 10 20 0 1 2 IC
relative longitudinal postion
-20 -10 0 10 20 -0.05 0 0.05 Yaw rate IA -20 -10 0 10 20 -0.05 0 0.05 IB -20 -10 0 10 20 -0.05 0 0.05 IC
relative longitudinal postion
-20 -10 0 10 20 -1000 0 1000 Aerodynamic moment IA -20 -10 0 10 20 -1000 0 1000 IB -20 -10 0 10 20 -1000 0 1000 IC
seem to be a correlation between the ratings of realism and the lane placement difference in scenarios IIIA and IIIB. This is confirmed by e.g. test subject one who did not change his/her lane placement when exposed to aerodynamic force and moment while he/she rated the realism relatively low compared to the other test subjects. On the other hand test subject 3 kept his/her lane placement and rated the realism relatively high. Furthermore, two main strategies when overtaking can be identified, one represented by test subjects 1, 2 and 4 and the other by test subjects 3, 5 and 6. It can thus be concluded that the lane placement is individual and so are the changes when aerodynamic force and moment are introduced. These differences cannot be used to explain differences in ratings of realism.
Figure 3 The lateral spacing between the overtaking car and the overtaken trucks for all 6 test subjects, numbered left to right. The grey area indicates one standard deviation of the lateral
position, the black curve the mean and blue curve the single truck without aerodynamic feedback.
Even though the individual variations were substantial, all test subjects rated the realism fairly high. However, as indicated in other studies (e.g. Kaptein et al. 1996), the perceived realism depended also on other cues such as motion, sound and visual system. In test III the subjects mentioned in particular noise: “The sound did not match the visual impression.” The degree to which the subjects paid attention to these other cues may partly explain the differences between them in terms of their respective ratings of realism.
-201 0 20 1.5 2 2.5 Lat eral s pac ing [m ] -201 0 20 1.5 2 2.5
Positions during overtaking
-201 0 20 1.5 2 2.5 -201 0 20 1.5 2 2.5 -201 0 20 1.5 2 2.5 Longitudinal position [m] -201 0 20 1.5 2 2.5
SUMMARY AND CONCLUSIONS
Aerodynamic forces and moments have been added in a moving base driving simulator to enhance the perceived realism of overtaking situations. A novel real time model has been implemented to obtain the yawing moment and lateral force acting on the overtaking vehicle in the overtaking situation. The effects of the force and torque have been studied in a driving simulator study with a total number of 20 test subjects.
The study was divided into three sub-tests, where the first test was used to determine a suitable the motion feedback. It turned out that the suggested model was overestimating the force and moment. This is partly explained due to a lack of reference measurements of real car overtaking forces and moments. A second test was designed to tune a level that is perceived realistic.
The third test used the settings of previous sub-studies to investigate the perceived realism and if differences in ratings could be explained by differences in the respective driver’s behaviour in terms of placement in the lane. No systematic pattern could be found in terms of how the realism was perceived and how the truck was overtaken. The trajectory appears to be more dependent on the individual variations than the presence of an aerodynamic interaction between the overtaken truck and the overtaking car.
Perceived realism of overtaking situations is a very complex mechanism, and depends on a wide variety of cues. This work improved only two of these cues, aerodynamic force and moment, but nevertheless resulted in a high rating of perceived realism.
ACKNOWLEDGEMENTS
The authors would like to acknowledge the financial support of Chalmers University and in specific the Transport Area of Advance and the competence centre SAFER within Chalmers University of Technology. Also acknowledged is the contribution of M.Sc. Helena Strömberg.
REFERENCES
Ahlström, C. Bolling, A. Sörensen, G. Eriksson O. and Andersson A (2012). Validating speed and road surface realism in VTI driving simulator III. VTI Report 745A, VTI (Swedish National Road and Transport Research Institute)
Alm, H (1997). The VTI Driving Simulator “Validation Studies”. Driving Simulation Conference, Lyon, France, September 8-9, 1997.
Bruzelius, F., J. Fernandez, B. Augusto. (2013b) A Basic Vehicle Dynamics Model for Driving Simulators. Int. J. Vehicle Systems Modelling and Simulation, submitted.
Bruzelius, F., D. Uystepruyst, B. Jacobson and S. Krajnovic (2013a). A simple real-time aerodynamic model for vehicles in overtaking situations, Int. J. Vehicle Systems Modelling and Simulation to appear.
Corin, R.J , He, L., Dominy, R. G. (2008) A CFD investigation into the transient aerodynamic forces on overtaking road vehicle models, Journal of Wind Engineering and Industrial Aerodynamics Vol. 96, pp.1390–1411.
Fischer, M., Sehammar, H. and Palmqvist, G. (2010) Motion cueing for 3-, 6-and 8-degrees-of-freedom motion systems, proceedings of the Driving simulation conference Europe.
Fischer, M., Sehammar, H. and Palmqvist, G. (2011) Applied Motion CueingStrategies for Three Different Types of Motion Systems, Journal of computing and information science in engineering, Vol. 11, No 4.
Jamson, H., (2011). Cross-platform validation issues, in: Fisher, D.L., Rizzo, M., Caird,J., Lee, J.D. (Eds.), Handbook of Driving Simulation for Engineering, Medicine, and Psychology. CRC Press, Boca Raton, FL, pp. 12:11-12:13.
Jamson, J. (2010) Motion cueing in driving simulators for research applications. PhD thesis, University of Leeds. Juhlin, M. (2009) Assessment of crosswind performance of buses. Doctoral thesis Royal Institute of Technology Sweden, ISSN 1651-7660; 2009:25
Maruyama, Y. and Yamazaki, F. (2006) Driving simulator experiment on the moving stability of an automobile under strong crosswind Journal of Wind Engineering and Industrial Aerodynamics, Vol. 94, pp.191–205.
Noger, C. and Van Grevenynghe, E. (2011) On the transient aerodynamic forces induced on heavy and light vehicles in overtaking processes, Int. Journal of Aerodynamics, Vol. 1,pp.373–383.
Noger, C., Regardin, C., Széchényi, E. (2005) Investigation of the transient aerodynamic phenomena associated with passing manoeuvres Journal of Fluids and Structures, Vol. 21, pp.231–241.
Uystepruyst D. and Krajnovic, S (2013) Numerical simulation of the transient aerodynamic phenomena induced by passing manoeuvres, Journal of Wind Engineering and Industrial Aerodynamics, Accepted.
Clarke D, Ward P, Jones J (1998), Overtaking road-accidents: differences in manoeuvre as a function of driver age, Accident Analysis & Prevention, Vol. 30, pp 455-467.
Kaptein N., Theeuwes, J., Van Der Horst, R (1996). Driving Simulator Validity: Some Considerations, Transportation Research Record: Journal of the Transportation Research Board, Vol 1556, pp 30-36.