Postadress:
Besöksadress:
Telefon:
Box 1026
Gjuterigatan 5
036-10 10 00 (vx)
551 11 Jönköping
Heat treatment of
Compacted Graphite Iron
HUVUDOMRÅDE: Materials science FÖRFATTARE: John Esho Faris HANDLEDARE:
Rohollah Ghasemi
Postadress:
Besöksadress:
Telefon:
Box 1026
Gjuterigatan 5
036-10 10 00 (vx)
This thesis work has been completed at School of Engineering, University Jönköping. The author is responsible to presented opinions, conclusions and results in this work.
Examiner: Nils-Eric Andersson Supervisor: Rohollah Ghasemi Extent: 15 hp (undergraduate) Datum: 2018-05-04
Abstract
i
Abstract
The purpose of this thesis work was to analyze the effect of austempering heat treatment process and austenitising process on CGI microstructure and hardness properties. This is important due to new regulations regarding the environment by EU and US that will take an effect year 2020. For this reason, a material that can withstand new environments that it is exposed for is of huge importance. Time and temperature were two factors that were altered during the experimental part in this project to get different result and finally compare them.
The results show how the microstructure changes with different time and temperature of the austenitising and austempering process for Unalloyed and FM Produced. The result shows how the microstructure is affected, how the microstructure is changed and how the hardness is affected.
It is concluded that for the Unalloyed, the sample with highest hardness was austenitised at 850
oC in 90 minutes and austempered at 325 oC for 120 minutes. For FM Produced, there were two
samples with equally high hardness. The first sample is austenitised at 850 oC for 60 minutes
and austempered at 325 oC for 30 minutes. The second sample is austenitised at 850 oC for 90
Sammanfattning
Sammanfattning
Syftet med detta examensarbete var att få reda på effekten av värmebehandling av CGI på mikrostrukturen men också effekten på dess hårdhet. På grund av nya lagar angående miljö som kommer att träda i kraft år 2020 så är det viktigt att komma fram med ett material som kommer att passa de nya miljöerna som materialet kommer att utsättas för. Tid och temperatur var två faktorer som förändrades under experiment-delen i projektet för att få olika resultat och slutligen jämföra dem.
Resultaten visar hur mikrostrukturen förändras med olika tid och temperatur för värmebehandlingsprocess för Unalloyed och FM Produced. Resultatet visar hur mikrostrukturen påverkas, hur kompositionen ändras och hur hårdheten påverkas.
Slutsats kan dras att för Unalloyed provet med högsta hårdhet värmebehandlades vid 850 oC i 90 minuter och härdades vid 325 oC i 120 minuter. För FM Produced fanns det två prover med lika hög hårdhet. Det första provet värmebehandlades vid 850 oC i 60 minuter och härdade vid 325 oC i 30 minuter. Det andra provet värmebehandlades vid 850 oC i 90 minuter och härdades vid 325 oC också i 30 minuter.
Table of contents
iii
Table of contents
1
Introduction ... 5
1.1 CLASSIFICATION OF CAST IRON ... 5
1.2 BACKGROUND ... 6
1.3 PROBLEM DESCRIPTION ... 6
1.4 PURPOSE AND QUESTIONS ... 7
1.5 DISPOSITION... 7
2
Theoretical framework ... 8
2.1 LITERATURE SURVEY ... 8
2.2 POTENTIAL APPLICATIONS OF AUSTEMPERED DUCTILE AND COMPACTED GRAPHITE IRONS8
3
Experimental procedure ... 10
3.1 CHEMICAL COMPOSITION/CASTING ... 10
3.2 SAMPLE PREPARATION ... 10
3.3 HEAT TREATMENT PRACTICES ... 12
3.4 POLISHING ... 14
3.5 HARDNESS MEASUREMENT ... 14
3.6 MICROSTRUCTURAL ANALYSIS ... 14
3.7 VALIDITY AND RELIABILITY ... 16
4
Results ... 17
4.1 MICROSTRUCTURE ... 17
4.2 PHASE ANALYSIS ... 20
4.3 HARDNESS ... 22
5
Discussion and conclusion ... 24
5.1 HOW DOES THE AUSTEMPERING PROCESS, AUSTEMPERING AND AUSTENITISING TIME AND TEMPERATURE, AFFECT THE MICROSTRUCTURE OF ORDINARY FULLY FERRITIC AND HIGH-ALLOYED CGI MATERIALS? ... 24
5.2 HOW DOES THE AUSTEMPERING PROCESS, AUSTEMPERING AND AUSTENITISING TIME AND TEMPERATURE, AFFECT THE MECHANICAL PROPERTIES, IN THIS STUDY HARDNESS, OF AUSTEMPERED CGI MATERIALS?... 24
5.3 ERROR SOURCES ... 25
Table of contents
5.5 FURTHER WORK ... 25Bibliography ... 26
APPENDIX I ... 27 APPENDIX II ... 29 APPENDIX III ... 33Introduction
5
1
Introduction
This thesis work will be done in cooperation with Jönköping University under supervision of Dr. Rohollah Ghasemi from Materials and Manufacturing department. The work to be done for this thesis work includes practical work as well. The practical work will be implemented in the school’s workshop. The practical work includes preparation, cutting, heat treating and other moments that needs to be carried out in order to find the information that is sought.
The work deals with the introduction of a material that is more durable in order to withstand the more and more severe regulations by the EU and US. This report is about the material CGI and it is heat treated to alter its properties and receive a material that fits the new requirements that are a result of the new regulations regarding emissions. To get an overview, the most common cast iron classes will also be presented to show the differences.
1.1 Classification of Cast iron
Different classes of cast iron can be found. The different classes are characterized mainly according to the structure of the material. The traditional way that was used and is still in use today to categorize the different types of cast iron are the following [1]:
Grey iron: This is caused by the stable eutectic solidification of both graphite and
austenite [1].
White iron: Caused by metastable eutectic solidification of cementite, Fe3C and
austenite [1].
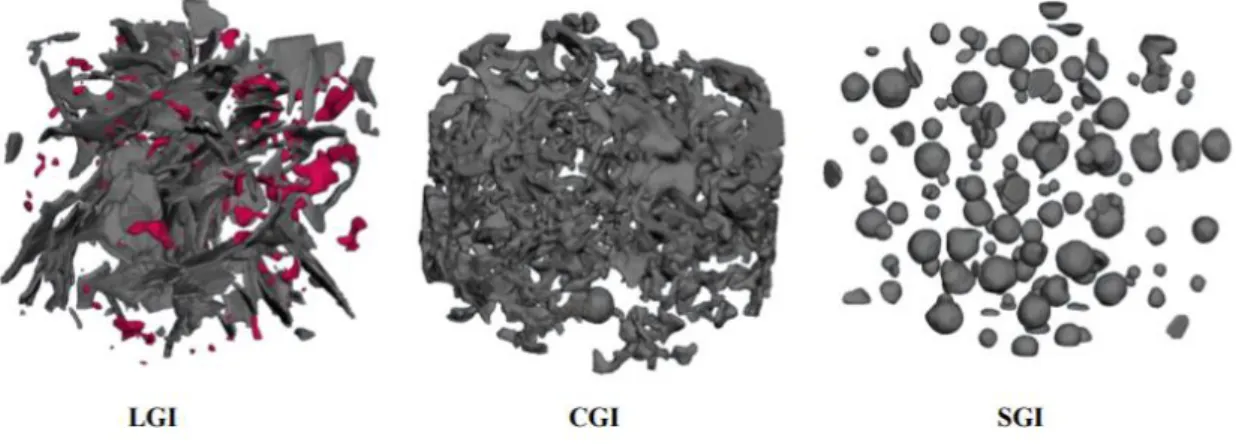
Today, another way of classification can be found. The classifications take into consideration the differences in the metallic matrix structure and the graphite morphology, in short, the differences can be found on the microstructure [1]. This has made possible by the use of new and advanced equipment that has aided the work of classification, better microscope is just one of many improvements. The most important classes are the three following that can be found in
Figure 1
:Figure 1. Three different cast iron groups based on the graphite morphology: (a) Lamellar Graphite Iron (LGI), (b) Compacted Graphite Iron (CGI) and (c) Spheroidal Graphite Iron
(SGI) [2].
1. LGI or lamellar graphite iron: As shown in Figure 1(a), in this class the graphite is shaped like flakes or lamellas. It is also known as grey cast iron. It was the first graphite cast iron that was discovered [2].
2. CGI or compacted graphite iron: The graphite here is worm-like shaped and it has more round edges, as illustrated in Figure 1(b) [2].
Introduction
3. SGI or Spheroidal graphite iron known as Ductile Iron (DI): Figure 1(c) shows a typical SGI graphite morphology, in which the graphite is shaped like nodules or spheroids [2].
1.2 Background
A material that has gained a lot of attention in recent years is compacted graphite iron (CGI), a reason for this is because of its material properties that are between those of ductile cast iron and grey iron [2]. In recent years the demand for a material that is light, economical and durable has increased. The engineers in the automotive industry are constantly looking for ways to decrease the weight. The reason that the weight is decreased is to improve things such as handling. Engineers, not only in the automotive industry, are today faced with a new problem that concerns sustainability. With more and more strict laws that constricts the emissions, engineers need to look for materials that can meet the requirements set by the EU and US. Nowadays, the conventional grey iron piston rings are being replaced by pearlitic compacted graphite iron (CGI) in modern large-bore heavy fuel diesel engines due to the better mechanical properties compared to grey irons, combined with a higher thermal conductivity, tribological performance and machinability compared to ductile irons. The high performance of CGIs is explained by its particular graphite morphology with an intermediate shape between lamellar and spheroidal form, which makes this grade of cast irons an interesting candidate for engine applications such as piston rings and cylinder liners.
However, recent studies demonstrate a significant further improvement in wear resistance of austempered cast irons compared to the pearlitic ones under sliding conditions similar to combustion chamber environment in low-speed large-bore marine diesel engines. Such an improvement is related to the transformation of the retained austenite to martensite under thermal and mechanical stress conditions, since that martensite shows higher abrasive resistance compared to pearlite and ferrite phases.
With the new restrictions, the research for more durable materials has increased and one material that the automotive industry has recognized is the CGI. The CGI which is received from heat treating ductile iron has improved mechanical properties but also thermal conductivity [3].
1.3 Problem description
In todays’ world a high demand has been put for a sustainable transportation, it is of a huge importance to reduce the emissions that are released during transportation but at the same time have a decent power output, durability be energy efficient. EU and US have brought more tough regulations to decrease the emissions released and to reduce the fuel used. By 2020 it has been requested by the EU and US to reduce the amount of sulphur content in heavy-fuels to make a marine diesel engine more sustainable [4].
By introducing a fuel with an extremely limited amount of sulphur (from 3.5 % all the way down to 0.1%) the engines will failure because of changed conditions. Consequently, the engine components especially the piston rings and the cylinder liners, needs to be improved to withstand the new conditions.
This demand for the improved components is crucial in order to meet the new regulations about the emissions. Another advantage from using materials that are more durable will decrease engine failures but also the engine downtime and the cost for maintenance, in other words a more sustainable engine will be a result of using more durable materials.
The issue is that there is a need for a material with better characteristics on the market. In this case the need of this material with improved properties is for a large marine diesel engine. By
Introduction
7
characteristics in this case we mean especially the mechanical properties and thermal conductivity as engines needs materials that can withstand huge forces and at the same time withstand all the heat that is produced when the engine is in use.
The material that is in use today is grey iron which today are being replaced by CGI (compacted graphite iron). The CGIs can through treatments such as heat treatment achieve great properties such as mechanical and thermal properties which are really important in this case.
1.4 Purpose and Questions
Main purpose of this thesis work is to develop a material that has improved mechanical properties compared to the traditional compacted graphite iron, this is done to increase the sustainability of the new generation of high-pressure heave-fuel diesel engines that will be environmentally friendly. The material that is to be developed is an austempered compacted graphite iron that is of high-performance.
The following two main research questions are tried to be investigated in the present study:
[1]
How does the austempering process, austempering and austenitising time andtemperature, affect the microstructure of ordinary fully ferritic and high-alloyed CGI materials?
[2]
How does the austempering process, austempering and austenitising time and temperature, affect the mechanical properties, in this study hardness, of austempered CGI materials?1.5 Disposition
The report starts with introduction were the background and the problem description can be found. Proceeding further in the first section, the purpose to this work can be found along with the two main questions that are to be answered. The second section is about the theoretical framework were some of the applications of ductile iron are presented. Third section explains how the experiments were made in this project in order to obtain a result. Everything from the sample preparation to microstructure analysis is explained thoroughly. In section four the results can be found. The result is divided in three smaller sections that present the results microstructure results, the results from the phase analysis and lastly the results from the hardness test. Finally, the last section contains the conclusions and the discussion about further work in the future
Theoretical framework
2
Theoretical framework
In the experiments austempering heat treatment theory is used where the CGI materials are heated up to 850 °C and kept at this temperature for various times (60, 90, 120 minutes) and then quickly quenched in salt bath to various temperatures (325 and 375 oC) and keep it there
for various times (30, 60, 90, 120 minutes).
The heat treatment is a method that is used today to alter the material properties, it can alter different types of properties such as chemical, physical or other. Briefly, the treatment involves heating or cooling down a material to extreme temperatures. The material can be hardened but also get softer, it all depends on temperature and time that it is exposed to.
2.1
Literature survey
Most of this literature survey is about ADI. The reason for this is that for ADI, much more research has been done compared to CGI.
Austempered Ductile Iron, also called ADI, belongs to a special group of iron alloys. ADI has got properties that are different because of the austempering heat process. Some important properties that has been altered by the austempering process is an improvement in strength and also improved ductility. What heat treatment does is that it alters the microstructure of the material [5].
The way of production starts off with a heat treatment in 2 steps. The first step in the process involves of austenitising in the range of 850-950 °C. The process continues with the second step which is where the material is cooled down rapidly to austenitising temperature. The temperature for the rapid cooling can be varied from 250-400 °C. The rapid cooling part can also vary in time, if the austempering time is short then the microstructure will consist of ferrite and retained austenite and some martensite. The austempering time can be increased, one property that an increased time of austempering is that austenite becomes more balanced. The time spent for the material in the second step of the process has an effect on the microstructure of the material. Depending on the amount of time that is spent on the rapid cooling, the material can acquire different mechanical properties which is because of changes in the microstructure [6].
The ordinary ductile iron is only half as strong as the ADI at the same ductility level, or it shows only half the ductility at the same level of strength. If compared with steel castings with the same strength, the price for casting and heat-treating ADI is minor. The reason for this is better cast-ability which means that the iron is less prone to porosity. Cast alloys of ADI with high strength are used today in an increased rate, one reason for this is that ADI is a more cost economical alternative if compared to steel that also is a heavier material and costs more to produce [5].
Together with the properties of high strength and exceptional wear resistance, ADI has become an interesting choice of material for engineering uses [6].
CGI has a disadvantage compared to austempered graphite iron (AGI) and it is that it has got lower thermal conductivity. The reason for the interest in CGI is because of its higher strength [4].
2.2 Potential applications of austempered ductile and compacted
graphite irons
In the automobile industry the importance of using lightweight materials is great. The engineers are constantly looking for a material that can withstand the forces that are required while at the same time be as light as possible and also increase power output. One example is the crankshaft in engines which is an important part and also expensive part. The crankshaft needs to withstand high forces and fatigue [7].
Theoretical framework
9
Three materials that have been used for a long time in the automobile industry are ductile iron, hardened steel and steel. But the austempered ductile iron, ADI, wasn’t introduced to the engineers until the 1970s. The material has since then increased in use in this industry, the combination of superior strength, fatigue and wear resistance while at the same time be lightweight and with a low production cost makes it attractive for the engineers [7].
Today, some replacements have been made were ADI has been used instead of the three traditional materials that have been used for a long time. Some examples of successful uses are crankshaft in gasoline and diesel engines. This part used to be produced using steel as a material. However, the use of ADI is not increasing in a fast rate because of different reasons, for example industries that are used to using traditional materials and it is considered as a “safe” material [7].
The admirable characteristics of austempered ductile iron has increased its applications and today it is being used in different types of industries. Some examples of ADI’s applications apart from the automotive industry is the rail and heavy engineering industries [8].
Apart from having superior characteristics, austempered ductile iron is very economic during processing. When replacing case-hardened steel forging in rear axles, it has been reported that a 50 % of savings in energy can be made when choosing ADI over the traditional steel forging. Also, the cost of machining is lower due to less tool wear. This is because of the microstructure achieved from the austempering process. In general, when replacing the forged steel in this case can give an approximate reduction in cost by up to 30 % [8].
Due to the economic advantages that can be achieved from changing to ADI, the application of this iron has increased in areas of high-performing products. In present, the use of ADI is still a small part of the iron market but by looking at the rapid growth of its use it is just a matter of time before the market for austempered ductile iron will expand [8].
Application of CGI will soon be found in the automotive industry because of the increasing interest to use it in automotive [5].
Experimental procedure
3
Experimental procedure
The procedure of how the experiments were carried out are explained here. For this work a
quantitative study was carried out. The reason to why a quantitative study was chosen is because experimental work was needed in order to achieve results for the question in the project.
3.1
Chemical composition/casting
For this thesis work the school got piston rings with different materials that are to be used in this thesis work. For this work, two different piston rings were used. Each of the two rings had different material, the materials were unalloyed compacted graphite iron (CGI) and FM produced compacted graphite iron (CGI). Two piston rings, one fully ferritic and the other fully pearlitic, were cast as 800 mm in diameter, 60 mm in height, they were to be processed and examined for this thesis work.
Both alloys consist of more than ten materials, the content of each piston ring is presented in Table 1.
Table 1. Chemical content of the used piston rings materials in the present study.
ID Materials C Si Mn Cu Mo Ni Cr P S Ti Mg
A Unalloyed 3,5 2,2 0,22 0,05 0,2 0,5 0,03 0,01 0,001 0,001 0,02
B FM produced 3,59 1,75 1,03 1,28 0,51 0,45 0,38 0,014 0,001 0,001 0,017
The piston rings were both primary made out of iron but the only thing that differed from them was the chemical composition or the microstructure. One of the material was called unalloyed compacted graphite iron (CGI) and the other material was called FM produced CGI. Throughout this whole project the unalloyed material was labeled as “A” and the FM produced was labeled as “B”, these labels were used to ease the work.
3.2
Sample preparation
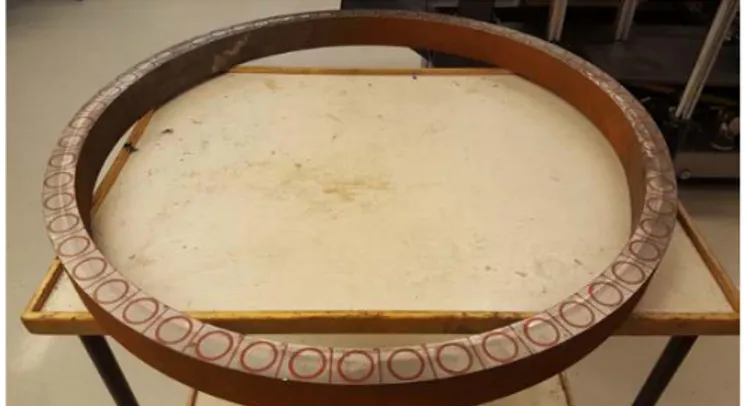
To begin with, the as-cast piston rings, as shown in Figure 2, were cut in four equally sized pieces. This means they were cut into a quarter of a circle. The reason that they were cut was because the piston rings were too big for the second machine that was going to cut them into small cubes. For cutting the piston rings, a handheld circular saw was used. It was cut by the help of my supervisor and another student that also works on his thesis work.
Figure 2. As-cast piston ring used in this work.
Once each ring was cut into four pieces (a total of eight different rings, four pieces for each material. The small pieces were then cut into cubed shapes by an automatic saw machine. The machine was already programmed by a teacher in the workshop for cutting the quarter of the ring. The quarter of the ring was still heavy and it was hard to hold it in place at first so a special tool shaped like the letter "C" was produced by the workshop personnel. This tool helped when the pieces were cut by holding it so it wouldn't drop from the other side when it was cut off the small piece. The tool that was produced was made of wood and was a good aid that made cutting
Experimental procedure
11
simple and more important, it increased the level of safety when using the automatic saw machine.
Each quarter of ring was cut into small cube-shaped pieces, from each quarter of ring approximately 15 small cubes could be made. In total from each piston ring we got approximately 60 small pieces that could be used in this work. For each cube it took about three minutes to cut. A cube from the work can be found in Figure 3.
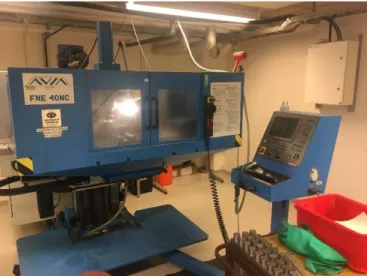
When all the pieces were cut they need to be machined by a CNC machine in the workshop. The workshop personnel made a software for the machine so that the cubed sample could be machined into a cylindrical sample. The pieces were machined by milling process. For each sample it took about seven minutes to machine with about 2400 steps in the software. The CNC that was used for this work can be found in Figure 4.
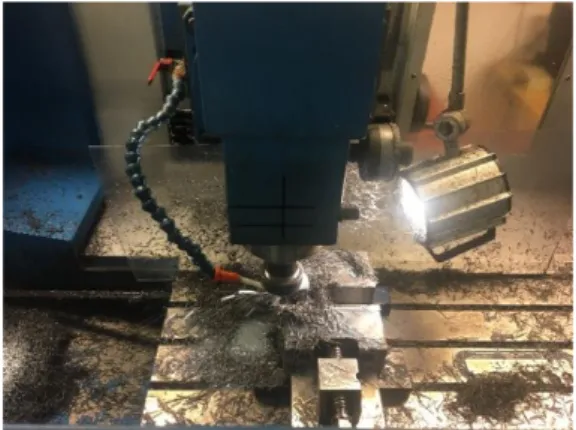
A special tool was used to hold the samples in place when they were being milled. This was important because the sample should be held in place tightly and if it were to move it would have changed the cylindrical shape that was needed for this work. Each 7-minute step cut only half of the sample because the other half was held in place so it wouldn’t move. When all the halves were milled it was time for the other half. Now we needed to use another tool to keep the sample in place because it was circle shaped now compared to the original squared shape. The same software was used for milling here as well, the only thing that was changed was the tool to hold the sample in place. In
Figure 3
the sample can be seen in the two stages of the milling process.Figure 4
shows the sample during the milling process.Figure 3. Samples that were obtained after the piston ring was cut by the automatic saw machine. Approximately 60 samples were obtained
from each piston ring
Figure 4. CNC milling machine that was used to mill the samples. Time required to cut a sample on both side
Experimental procedure
3.3
Heat treatment practices
The next step in the process after all the samples from both the piston rings were machined was the heat treatment step. The JU-cast workshop was booked by the supervisor were there were three furnaces that would be used for this step in the process. The reason to why three furnaces were used was because the first furnace was used for pre-heating the samples, the second furnace was used for the heat treatment and the third furnace was used for the salt bath. In Figure 5., the schedule for heat treating was used. By following this schedule, the work could be done easily and it was easy to keep track of what was to be done.
Figure 5. Schedule used to keep track of the samples that need to be obtained for this project work.
Austenitising Tempearture 850 oC Austenitising Tempearture 850 oC Austenitising Tempearture 850 oC
Austenitising Time 60 min Austenitising Time 90 min Austenitising Time 120 min
A unalloyed CGI A unalloyed CGI A unalloyed CGI Austempetring Time/
Tempearture 30 min 60 min 90 min 120 min
Austempetring Time/
Tempearture 30 min 60 min 90 min 120 min
Austempetring Time/
Tempearture 30 min 60 min 90 min 120 min 375 o C 375 o C 375 o C 325 o C 325 o C 325 o C
B FM produced CGI B FM produced CGI B FM produced CGI Austempetring Time/
Tempearture 30 min 60 min 90 min 120 min
Austempetring Time/
Tempearture 30 min 60 min 90 min 120 min
Austempetring Time/
Tempearture 30 min 60 min 90 min 120 min 375 o C 375 o C 375 o C 325 o C 325 o C 325 o C
Figure 3. (a) The sample after the first part in the milling process, (b) The sample after the second step in the milling process. Each of the steps took about seven minutes each.
(a)
Figure 4. Typical sample preparation during the milling process by the CNC machine, the tool keeps it from moving while it is being machined and the milling
tool is being cooled down by a coolant.
Experimental procedure
13
Figure 6. The three furnaces that were used for the project. The first furnace was used for preheating the samples. The second furnace was
used for the heat treatment, and lastly the third furnace contained molten salt that was used for
the salt treatment.
The furnace for preheating was important to use because if the samples were in room temperature and the samples would be put in the second furnace then the temperature would be affected greatly. This happens because the samples are too cold if compared to the temperature of the furnace. So, a furnace just for preheating was necessary in this case, it was used to decrease the amount of error sources and therefore give a more accurate result. In Figure 6 the furnaces that were used are shown, each furnace had a different temperature. The furnaces took some hours to get to the right temperature and therefore the temperature for each furnace was set hours prior to the time of the treatment by the supervisor. Out of all the three furnaces, the furnace used as salt bath took the most time to reach the desired temperature.
The salt bath furnace hade in total nine openings that could be used to put samples in, see
Figure 7
. To use the time wisely a certain pattern that can be seen in the picture was made. The work efficiency was highly increased by using this pattern. In each column there were four samples and with same time from the austempering process. A schedule was used during the heat treatment as can be seen inFigure 8
.Figure 7. A certain “schedule” was followed during the austempering process. Advantages of
creating and using a “schedule” is that time can be saved.
Experimental procedure
3.4
Polishing
The other half of the sample that was cut earlier, was polished in four different stages by a polishing machine that had a preset software that was used just to polish these samples. By polishing the samples, the scratches could easily be removed. Without any scratches, a clear and good picture could be taken by the microscope. The pictures that were taken for this other half were used for the micro-structure analysis.
3.5
Hardness measurement
After the austempering and austenitising process the samples were cut in half. The first half was used to measure the hardness of the material and it was done by hardness testing machine. The process involves using an indenter. In this project an indenter of the material tungsten carbide was used. A weight of 750 kg was used to make a dent on the sample surface. After this, the diameter of the dents on the surface were measured by microscope.
3.6
Microstructural analysis
After the pictures were taken by the microscope in four different magnifications, it was time for the samples to be etched. The etching process involved using an acid on the surface to show the content of the surface clearer. After this process, more pictures were taken in five different magnifications. Figure 9 shows the microstructure after the etching process, the etchant that was used is called Nital 2 %, it is a solution consisting of nitric acid and ethanol.
Figure 8. During the heat treatment a “schedule” was used to know at exactly what time the samples were ready to be taken out of
the salt bath. By writing what time a sample need to be taken out, time could be saved by not
Experimental procedure
15
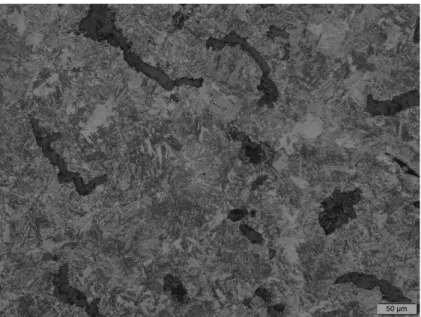
Figure 9. A typical microstructure of austempered CGI matrix representing graphite and ausferrite matrix (etchant Nital 2%, 20X).
3.6.1
Phase analysis
This time an extra ten pictures were taken in the maximum magnification (100x) for use later on in the project.
The ten pictures that were taken with 100x magnification were used for phase analysis. By using a software, different parts of the picture could be colored to show the content in percentage.
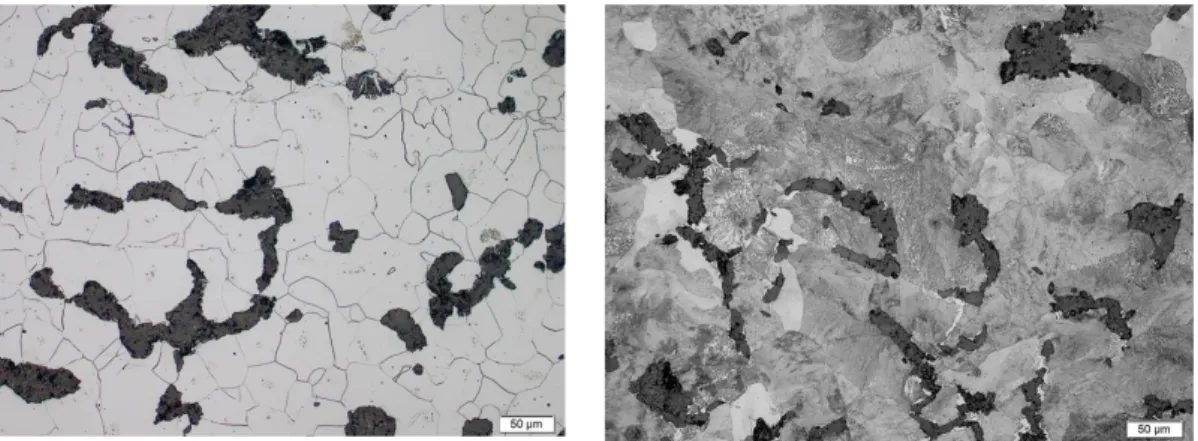
Figure 10
shows the microstructure before the phase analysis andFigure 11
shows the microstructure after the phase analysis.Figure 11. After phase analysis, the structure is clearly displayed. The software
used also tells what percentage each color is. Red color represents the acicular ferrite
and the green color represents the high carbon saturated austenite Figure 10. Before phase analysis, the
picture is grey and is not too much help. The “needles” represent the ferrite while
Experimental procedure
3.7 Validity and reliability
The validity and the reliability of this project has been taken into account in order to achieve accurate and legitimate results. By performing a quantitative study for this work, results could be achieved for this work. The experimental work was necessary in order to answer the questions.
3.7.1
Validity
To achieve valid results for this project, certain measures were taken throughout the whole experimental process. There are many examples of measures that were taken to make sure accurate results were attained.
During the heat treatment process three different furnaces were in use. Each furnace was set to a specific temperature. Even though the furnaces couldn’t keep the exact temperature that was set, because of many factors, the temperature was monitored constantly. The frequent monitoring of the temperature was to a big help as it showed if the furnace temperature needed to be increased or decreased. With a frequent monitoring, the temperature could be kept in the desired range and therefore a more accurate and valid result could be achieved.
Another example of validity can be found during the hardness test process. In order to measure the hardness of each sample, five dents were made on the surface. However, before starting to use the machine for the samples that are to be used in this project, a test sample was used. The test sample helped in making sure the hardness test machine was in good condition and that it was ready to be used on the samples for this project.
3.7.2
Reliability
Another thing to take into consideration when writing a report is the reliability of the results. In order to make sure that reliable results could be achieved from the experiments, different measures were taken.
One of many measures that was performed was to take several pictures with the microscope, this helped for the phase analysis. Ten pictures were taken across the surface of the sample. If only one picture was taken then it could have affected the results because the picture could maybe show an area that doesn’t represent the sample as a whole. By taking ten pictures for the phase analysis, an even more accurate result could be achieved. Not only were ten pictures taken but the standard deviation was taken into account as well when measuring the content in percentage. The standard deviation adds to the reliability and shows for the reader that the result is spread in a certain deviation that is stated.
Another way for reliable results was to clean the equipment and samples. For example, if a sample was not clean before the pictures were taken then the picture would disturb the content. Even scratches affected the pictures as they were visible in the microscope and affected the picture. It was of huge importance to be careful and observant during the polishing process, but also to cover the polished sample surface with a plastic piece so as it would not get scratched.
Results
17
4
Results
The results are presented under three different headings. Starting with the microstructure then the phase analysis and finally the hardness.
4.1
Microstructure
4.1.1
As-cast microstructure
Figure 12 (a) and (b) show the as cast microstructure of the fully ferritic and high-alloyed fully pearlitic CGI materials respectively, used in this study. The compacted graphite particles are visible in the microstructure.
Figure 12. As-cast microstructure (a) fully ferritic CGI, (b) high alloyed fully pearlitic CGI.
4.1.2
Unalloyed sample, austenitised at 850
oC for 60, 90 and 120
minutes and austempered at 325
oC for 30, 60, 90 and 120 minutes
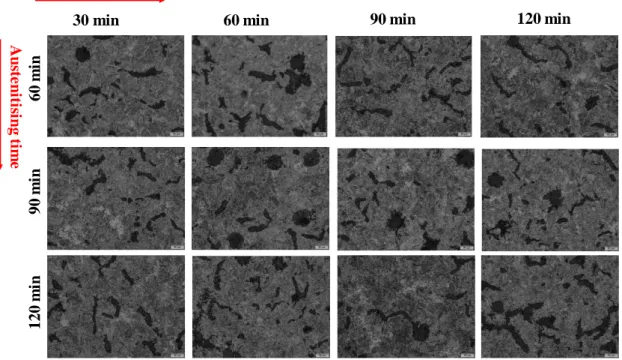
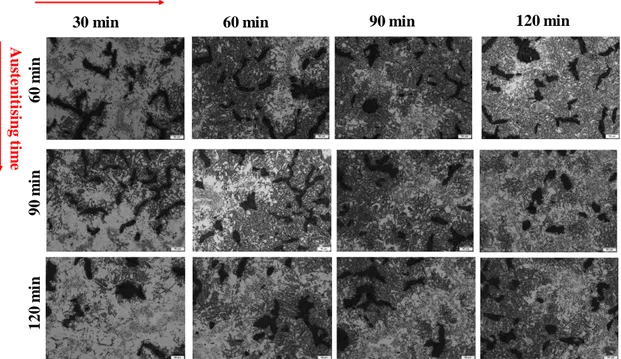
Figure 13.The effect of austenitisation and austempering time and temperature on resulted
microstructure of unalloyed CGI material, 325 oC. (Magnification 20X)
60
m
in
90
m
in
120
m
in
90 min
120 min
Austempering time
30 min
60 min
A
u
ste
n
iti
si
n
g
ti
m
e
Results
As we see clearly in all heat-treated samples, presented in Figure 13, under various austenitising and austempering temperatures and times, the ausferrite matrix were evolved however, for 30 minutes austempering time there exists some areas which the austenite did not converted or transformed to the acicular ferrite and carbon-rich austenite. The amount of acicular ferrite will increase by austempering holding time. More closely the ausferrite formed matrix shows a coarse ausferrite needles would be resulted (austempering time of 120 minutes) which would be the consequence of the diffusion of the carbon and acicular growth phenomenon due to longer austempering time as observed inFigure 23.
4.1.3
Unalloyed sample, austenitised at 850
oC for 60, 90 and 120
minutes and austempered at 375
oC for 30, 60, 90 and 120 minutes
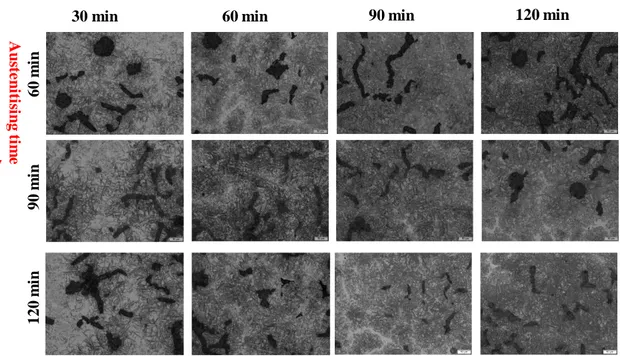
Figure 14. The effect of austenitisation and austempering time and temperature on resulted
microstructure of unalloyed CGI material, 375 oC. (Magnification 20X)
As can be seen in Figure 14, with changed time and temperature for austempering and austenitising, the amount of acicular ferrite and austenite doesn’t seem to change to significantly. However, by austenitising and austempering the sample for 120 min respectively, the acicular ferrite increased. This can also be seen in Figure 24.
60
m
in
90
m
in
120
m
in
90 min
120 min
Austempering time
30 min
60 min
A
u
ste
n
iti
si
n
g
ti
m
e
Results
19
4.1.4
FM Produced sample, austenitised at 850
oC for 60, 90 and 120
minutes and austempered at 325
oC for 30, 60, 90 and 120 minutes
Figure 15. The effect of austenitisation and austempering time and temperature on resulted
microstructure of unalloyed CGI material, 325 oC. (Magnification 20X)
From Figure 15 it can be seen that the acicular ferrite increased by increased austempering and austenitising time. The acicular ferrite grows slowly, austenite can still be seen in all of the sample even if it does decrease by increasing time of both processes. In Figure 25 it is clear that the acicular ferrite increases, however there is still a lot of austenite left in all samples even though it decreases by increasing the time for austempering and austenitising.
60
m
in
90
m
in
120
m
in
90 min
120 min
Austempering time
30 min
60 min
A
u
ste
n
iti
si
n
g
ti
m
e
Results
4.1.5
FM Produced sample, austenitised at 850
oC for 60, 90 and 120
minutes and austempered at 375
oC for 30, 60, 90 and 120 minutes
Figure 16. The effect of austenitisation and austempering time and temperature on resulted
microstructure of unalloyed CGI material, 375 oC. (Magnification 20X)
Figure 16 shows that the austempering and austenitising time is not enough, even for 120 min for both processes. The acicular ferrite grows very slowly and almost not noticeable from some of the samples. The austenite is left in the sample and it is clearly noticeable, the heat treatment processes did not give a significant effect on the samples. From Figure 26 it can be seen that the most noticeable stage is from 30 min to 60 min of austempering time, after that the acicular ferrite grows very slow.
4.2
Phase analysis
The phase analysis, performed on etched samples as shown in Figure 10 and Figure 11Error!
Reference source not found., shows clearly the amount of each phase in percentage. For
each sample the phase analysis results are represented in bar chart. The bar charts show the amount of ferrite and austenite in percentage.
60
m
in
90
m
in
120
m
in
90 min
120 min
Austempering time
30 min
60 min
A
u
ste
n
iti
si
n
g
ti
m
e
Results
21
4.2.1
Phase analysis Unalloyed, 325
oC
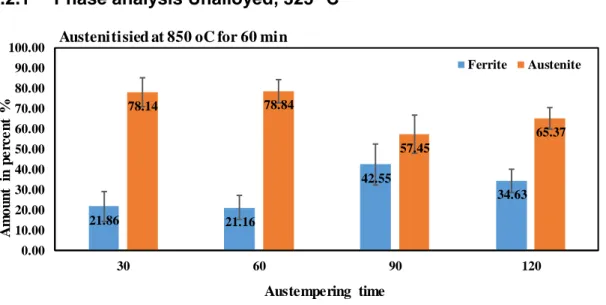
Figure 17. The amount of ferrite is much lower than the amount of austenite.
Figure 17 shows that most acicular ferrite can be achieved by austempering for 90 minutes, it then decreases to a lower value. Looking into Figures 27 and 28 the vary of austempering and austenitising time does not give a too significant change. In Figure 27, for 30 minutes of austempering time, it is obvious that the percentage of the acicular ferrite will increase by increase of the austenitising time. But then it stays at about the same level only to drop to lower value at 120 min.
4.2.2
Phase analysis Unalloyed, 375
oC
Figure 18. The content of both is almost identical and a change in austempering time does not give a dramatic change in content.
Figure 18 shows that the values of both acicular ferrite and austenite only increases or decreases in small values, so it is not a huge change that can be seen here. Figure 29 shows that most acicular ferrite can be achieved after 60 minutes of austempering. In Figure 30 the acicular ferrite reaches the maximum value after 90 minutes of austempering and then decreases again.
21.86 21.16 42.55 34.63 78.14 78.84 57.45 65.37 0.00 10.00 20.00 30.00 40.00 50.00 60.00 70.00 80.00 90.00 100.00 30 60 90 120 A m ou n t in p e rc e n t % Austempering time
Austenitisied at 850 oC for 60 min
Ferrite Austenite 45.05 48.59 45.84 50.80 54.95 51.41 54.16 49.20 0.00 10.00 20.00 30.00 40.00 50.00 60.00 70.00 80.00 90.00 100.00 30 60 90 120 A m ou n t in p e rc e n t % Austempering time
Austenitisied at 850 oC for 60 min
Results
4.2.3
Phase analysis FM Produced, 325
oC
Figure 19. The figure clearly shows that by increasing the austempering time, the amount of ferrite is increasing whilst at the same time the amount of austenite is decreasing.
In Figure 19 a clear pattern can be seen. The acicular ferrite increases with austempering time, at the same time the austenite is decreased in the same but opposite pattern. Figure 31 doesn’t show a similar pattern just like Figure 19, Figure 32 shows a similar pattern like Figure 19. The acicular ferrite increases with increased austempering time.
4.2.4
Phase analysis FM Produced, 375
oC
Figure 20. Figure shows a not so significant increase in amount of ferrite.
Figure 20 shows that for increased austempering time the ferrite is increased slightly. In Figure 33 this trend can be seen until 90 minutes of austempering and after that the acicular ferrite decreases. Figure 34 shows that the acicular ferrite increases and then lands at a stable value from 90 minutes of austempering and after.
4.3 Hardness
For reference and comparison, the hardness values (HBW) of the untreated samples can be found below: Unalloyed: 138 FM Produced: 251 37.77 47.59 57.79 66.42 62.23 52.41 42.21 33.58 0.00 10.00 20.00 30.00 40.00 50.00 60.00 70.00 80.00 90.00 100.00 30 60 90 120 A m ou n t in p e rc e n t % Austempering time Austenitisied at 850 oC for 60 min
Ferrite Austenite 19.66 25.04 29.45 29.97 80.34 74.96 70.55 70.03 0.00 10.00 20.00 30.00 40.00 50.00 60.00 70.00 80.00 90.00 100.00 30 60 90 120 A m ou n t in p e rc e n t % Austempering time Austenitisied at 850 oC for 60 min
Results
23
4.3.1
Unalloyed
Figure 21. Not a significant change of increase is achieved.
In Figure 21 it can be seen that the samples that were austempered for 325 oC had a higher value
for hardness than the samples that were austempered at 375 oC. This can also be seen in Figure
35 and Figure 34.
4.3.2
FM Produced
Figure 22. Both bars decrease with increased austempering time.
In Figure 22 it can be seen that the hardness increased to begin with only to decrease again for every sample after 30 minutes of austempering, this is for both 325 oC and 375 oC. Figure 37
and Figure 38 also show that the hardness has increased. By austenitising for 90 minutes and 120 minutes it can be noticed that they follow the same pattern as the samples that were austenitised for 60 minutes, this applies for both austempering temperatures.
269 264 270 286 241 236 234 246 200 210 220 230 240 250 260 270 280 290 300
30 min 60 min 90 min 120 min
H ar d e n ss ( H B W ) Austempering time
Austenitisied at 850 oC for 60 min
325 375 420 349 329 340 406 328 296 299 200 250 300 350 400 450
30 min 60 min 90 min 120 min
H ar d e n ss ( H B W ) Austempering time
Austenitisied at 850 oC for 60 min
5
Discussion and conclusion
5.1 How does the austempering process, austempering and
austenitising time and temperature, affect the microstructure of
ordinary fully ferritic and high-alloyed CGI materials?
With increased amount of acicular ferrite, the higher the hardness will be. The high carbon saturated austenite decreases the hardness of the samples. The austempering and austenitising time and temperature affects the content of acicular ferrite and carbon saturated austenite. To achieve a sample with great hardness, meaning a sample that has a lot of acicular ferrite, the time and temperature must be ideal. If the time of the austempering is to little or not enough then the acicular ferrite will not grow. However, too much time also affects the content by increasing the size of the acicular ferrite. The longer the acicular ferrite is then the softer the material will be. So, to achieve a sample with high value of hardness it is not just to increase the time of the heat treatment because too much time also affects the hardness. This is one reason that explains why the hardness decreases with increased time. Another reason is that the grain sizes increases with increased austenitising time and there are less grains because we have bigger grains in the same space as before. The bigger the grains are then the softer the material will be.
From what is seen in results, a trend could be noticed. For example, some samples showed that for 60 minutes most acicular ferrite could be seen on the samples. This trend line was shared with some samples. This says that to achieve most acicular ferrite in the sample is not just to increase the austempering time. There is a time that is ideal to get a sample with high hardness. The austenitising time also showed that to get a sample with high hardness, an ideal time was to be found. Too little time austenitising didn’t give much acicular ferrite while too much time for austenitising was not perfect either. This says that a similar trend line as for the austempering can be seen.
5.2 How does the austempering process, austempering and
austenitising time and temperature, affect the mechanical
properties, in this study hardness, of austempered CGI materials?
What can be said here is that the heat treatment affected the hardness of all the samples. For all the samples it could be seen that the hardness increased, for some it increased a little while for others it increased a lot.
5.2.1
Unalloyed
For the unalloyed a huge increase in hardness was achieved, even for 60 minutes of austenitising, 30 minutes of austempering and 325 o C a huge leap from 138 in hardness to 269
can be read from figure 21. In the same figure the hardness for 375 o C shows a huge increase as
well if compared to non-treated sample but the increase is not as much as the 325 o C sample.
In figure 35, were the austenitising time is increased to 90 minutes, the hardness for the 325 oC samples is increased further with a top result of 300 in hardness. However, for 375 o C samples
there was not a significant change compared to figure 21.
Figure 36 shows that for sample that was austempered for 90 min in 325 o C had the highest
number in hardness. For the samples that were austempered in 375 o C, the hardness was almost
the same even for increased time of austempering.
From the figures 21, 35 and 36 a conclusion can be drawn that by austempering the samples in 325 o C, the hardness increased significantly more in all austenitising times compared to the
samples austempered in 375 o C. For the samples austempered in 325 o C, the austenitising time
of 90 minutes gave the highest hardness value. The unalloyed sample that had the highest hardness was austenitised at 850 o C in 90 minutes and austempered at 325 o C for 120 minutes.
25
5.2.2
FM Produced
The untreated sample here had a hardness value of 251. For figure 22 it can be seen that the most effective austempering time is for 30 minutes. It is effective for both austempering temperatures of 325 o C and 375 o C. The top result for 325 o C is 420 and for 375 o C it is 406.
Figure 37 shows very similar values compared to figure 38, the top results are similar with the value for 325 o C being the same at 420 and the value for 375 o C landing at 409.
In figure 22 the results do not differ much from figure 37 and 38. The top values are slightly decreased and the figures look pretty much alike each other.
With the FM Produced it can also be said, just like Unalloyed, that by austempering the samples for 325 o C a higher value of hardness was gained compared to 375 o C. For the samples that are
austempered in 325 o C, the austenitising time of only 30 minutes gave the highest hardness.
Two samples had the same and highest value of FM produced. The first sample is austenitised at 850 o C for 60 minutes and austempered at 325 o C for 30 minutes. The second sample is
austenitised at 850 o C for 90 minutes and austenitised at 325 o C for 30 minutes as well.
5.3 Error sources
No project can be implemented perfectly without any errors, this report included. The errors are usually unintentional or the sources can be difficult to control since not much control can be taken. Throughout this whole practical work for this thesis, many error sources were noticed. The first known error source was something difficult to notice. The error was found during the heat treatment of the samples, the furnace used for salt bath showed wrong temperature in the digital display. To confirm this issue, a thermometer was used to measure the temperature in the salt bath. The temperature was much lower than the temperature that was set, from start there was a difference of up to 40 degrees Celsius. After some troubleshooting the source to this error could be found. The display showed the temperature at the bottom of the salt bath instead of the average of the whole. To solve this issue, the supervisor had to start the salt bath furnace much earlier (up to four hours earlier). Even though a solution was found to this error, there was still a deviation of about 7 degrees Celsius throughout the whole experiment. This could possibly have affected the results minimally but this error source was greatly limited from the start.
Another error source could be found during the hardness test when using the hardness machine. The machine used a weight of 750kg to make a dent on the surface and the weight was placed by “pumping” a lever until all the weight was placed on the surface. However, while place the weight it was of importance to pump slowly so as to make sure not to make weights bounce up. If they do bounce up even for just a millimeter then the weights will drop hard on the surface and affect the size of the dent. This could be easily avoided if the process is performed slowly and controlled.
5.4
Conclusion
What can be said from the results gained is that the hardness is affected by the heat treatment process. For all the samples the hardness increased and it varied from sample to sample how much it did increase. For some samples it increased more than the others. Another thing that can be said about the hardness is that it always reaches a top at a certain time before it decreases again, the peak of the hardness varied from sample to sample. This was explained by the length of acicular ferrite, if they were too long then the sample would be soft. Another explanation is that the grain size increased which also decreased the hardness.
5.5 Further work
For future work, to determine a sample with highest hardness with more specific result then “ideal” temperature needs to be further “investigated”. For example, if a sample achieves the highest hardness after 90 minutes then the samples could be tested for other times such as 80 minutes or 100 minutes. By doing this it can be determined more exactly at what time the sample can achieve the highest value of hardness.
Bibliography
[1] M. König, Microstructure Formation and Mechanical Properties in Compacted
Graphite Iron, Göteborg: Chalmers University of Technology, 2009.
[2] R. Ghasemi, AusCGI, Project meeting, Jönköping: Jönköping University, 2018.
[3] E. Nährström, “Relation between microstructure features,cooling curves and
mechanical properties in CGI-cylinder block,” KTH Indsutrial Engineering and
Management, Stockholm, 2014.
[4] M. Selin, in On the Microstructure and the Thermal Conductivity in Compacted
Graphite Iron, Göteborg, Chalmers University of Technology, 2009, p. 1.
[5] M. W. Mathias König, The influence of copper on microstructure and mechanical
properties of compacted graphite iron, Jönköping: Chalmers University of
Technology, 2009, p. 164.
[6] J. Southgate, “Implementation of the EC Sulphur Content of Liquid Fuels
Directive 1999/32/EC (as amended by 2005/33/EC) in the UK,” Oxfordshire,
2013.
[7] P. R. Rubin Larker, “Austempering Treatment in HIP Improves Ausferritic Steels
and Ductile Irons,” ASM International, Detroit, Michigan, 2015.
[8] M. B. Huseyin Cimenoglu, “The effect of austempering time on mechanical
properties,” Istanbul, 2001.
[9] R. E. a. N. V. M. Bahmani, “Austempered ductile iron: a competitive alternativa
for forged induction-hardened steel crankshafts,” International Journal of Cast
Metals Research, Tehran, 1997.
[10] B. R. K. P.-T. a. V. A. B. Bosnjak, “Influence of Microalloying and Heat
Treatment on the,” Springer-Verlag, 2000.
27
Appendix I
Figure 23. By increasing both austenitising time and austempering time more “flakes” were achieved. The flakes represent the acicular ferrite. (Magnification 100X)
Figure 24. Even though the ferrite increases with increased austenitising time and austempering time there is still some high carbon saturated austenite. (Magnification 100X)
60
m
in
90
m
in
120
m
in
90 min
120 min
Austempering time
30 min
60 min
A
u
ste
n
iti
si
n
g
ti
m
e
60
m
in
90
m
in
120
m
in
90 min
120 min
Austempering time
30 min
60 min
A
u
ste
n
iti
si
n
g
ti
m
e
Figure 25. The flakes are sharp and are increasing for longer austempering time, some carbon saturated austenite can still be found. (Magnification 100X)
Figure 26. The samples show a lot of high carbon saturated austenite still being left after increased time. (Magnification 100X).
60
m
in
90
m
in
120
m
in
90 min
120 min
Austempering time
30 min
60 min
A
u
ste
n
iti
si
n
g
ti
m
e
60
m
in
90
m
in
120
m
in
90 min
120 min
Austempering time
30 min
60 min
A
u
ste
n
iti
si
n
g
ti
m
e
29
Appendix II
Phase analysis Unalloyed, 325
oC
Figure 27. By austempering for 60 and 90 minutes, more ferrite than austenite is achieved.
Figure 28. Most ferrite can be found in the sample that is austempered for 60 minutes. 37.47 54.12 53.23 42.25 62.53 45.88 46.77 57.75 0.00 10.00 20.00 30.00 40.00 50.00 60.00 70.00 80.00 90.00 100.00 30 60 90 120 A m ou n t in p e rc e n t % Austempering time
Austenitisied at 850 oC for 90 min
Ferrite Austenite 44.35 51.75 36.92 45.92 55.65 48.25 63.08 54.08 0.00 10.00 20.00 30.00 40.00 50.00 60.00 70.00 80.00 90.00 100.00 30 60 90 120 A m ou n t in p e rc e n t % Austempering time
Austenitisied at 850 oC for 120 min
Phase analysis Unalloyed, 375
oC
Figure 29. Effect of austempering time on acicular ferrite/retained austenite ration for 90 minutes austenitising time.
Figure 30. Effect of austempering time on acicular ferrite/retained austenite ration for 120 minutes austenitising time. 45.98 59.20 50.00 49.93 54.02 40.80 50.00 50.07 0.00 10.00 20.00 30.00 40.00 50.00 60.00 70.00 80.00 90.00 100.00 30 60 90 120 A m ou n t in p e rc e n t % Austempering time
Austenitisied at 850 oC for 90 min
Ferrite Austenite 42.77 50.55 57.11 43.38 57.23 49.45 42.89 56.62 0.00 10.00 20.00 30.00 40.00 50.00 60.00 70.00 80.00 90.00 100.00 30 60 90 120 A m ou n t in p e rc e n t % Austempering time
Austenitisied at 850 oC for 120 min
31
Phase analysis FM produced, 325
oC
Figure 31. No sign of a clear change in percentage with increased austempering time.
Figure 32. Figure clearly shows that with increased austempering time, ferrite is increased whilst the austenite is decreased.
34.56 46.85 40.38 48.67 65.44 53.15 59.62 51.33 0.00 10.00 20.00 30.00 40.00 50.00 60.00 70.00 80.00 90.00 100.00 30 60 90 120 A m ou n t in p e rc e n t % Austempering time
Austenitisied at 850 oC for 90 min
Ferrite Austenite 49.44 58.74 64.28 70.48 50.56 41.26 35.72 29.52 0.00 10.00 20.00 30.00 40.00 50.00 60.00 70.00 80.00 90.00 100.00 30 60 90 120 A m ou n t in p e rc e n t % Austempering time Austenitisied at 850 oC for 120 min
Phase analysis FM produced, 375
oC
Figure 33. The most significant change can be found for 90 minutes of austempering time.
Figure 34. Amount of ferrite is very low compared to austenite and it does not show a huge increase with increased austempered time.
15.94 25.02 34.93 25.97 84.06 74.98 65.07 74.03 0.00 10.00 20.00 30.00 40.00 50.00 60.00 70.00 80.00 90.00 100.00 30 60 90 120 A m ou n t in p e rc e n t % Austempering time Austenitisied at 850 oC for 90 min
Ferrite Austenite 15.67 25.80 28.56 28.08 84.33 74.20 71.44 71.92 0.00 10.00 20.00 30.00 40.00 50.00 60.00 70.00 80.00 90.00 100.00 30 60 90 120 A m ou n t in p e rc e n t % Austempering time Austenitisied at 850 oC for 120 min
33
Appendix III
Hardness unalloyed:
Figure 35. The hardness is more or less the same, the increased time of austempering does not seem to have a huge effect on the samples.
Figure 36. The clearest change that can be observed is for 325 oC for 120 minutes of austempering time. 296 291 294 300 230 232 241 245 200 220 240 260 280 300 320
30 min 60 min 90 min 120 min
H ar d e n ss ( H B W ) Austempering time
Austenitisied at 850 oC for 90 min
325 375 280 280 290 265 245 241 247 250 200 210 220 230 240 250 260 270 280 290 300
30 min 60 min 90 min 120 min
H ar d e n ss ( H B W ) Austempering time
Austenitisied at 850 oC for 120 min
Hardness FM produced
Figure 37. Both bars decrease by increased time of austempering.
Figure 38. A decrease in hardness can be observed with increased time of austempering. 420 358 349 344 409 336 307 297 200 250 300 350 400 450
30 min 60 min 90 min 120 min
H ar d e n ss ( H B W ) Austempering time
Austenitisied at 850 oC for 90 min
325 375 411 354 335 358 406 335 311 297 200 250 300 350 400 450
30 min 60 min 90 min 120 min
H ar d e n ss ( H B W ) Austempering time