SPEED CONTROL EFFECT STUDY ON OPTICAL ILLUSION
DECELERATION MARKINGS
Jingmei WU1, Han HU1, Jinhai LI1
(1. Road Safety Research Center, Research Institute of Highway, M.O.T, Beijing, China; 100088)
ABSTRACT
The optical illusion deceleration marking is one of the commonly used speed control measures. In this research, the authors analyzed operating speed and trajectory of motor vehicle at intersection where optical illusion deceleration marking is installed. Quantitative and qualitative evaluation on effect of optical illusion deceleration marking is conducted. Results showed that optical illusion deceleration marking would help to reduce operating speed and average speed by 5-10km/h, to regulate motorcycle driver behavior, and to reduce speed difference, so that driving safety is ensured. Optical illusion deceleration marking is suitable for accident prone road sections on two-lane highways which main vehicle types are passenger car and motorcycle.
Key words: optical illusion deceleration marking, speed control, effect
1 INTRODUCTION
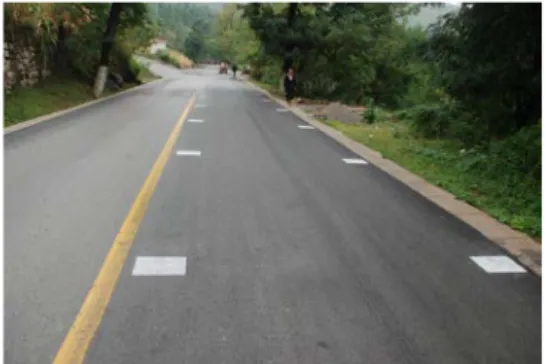
Optical illusion deceleration marking is a common road traffic enhancement measure by using human optical illusion and natural psychological reaction to warn drivers at dangerous locations to ensure driving safety[1]. While certain safety effects of optical illusion deceleration marking has been perceived in practical applications, yet quantitative safety effect evaluation is still lacking. In order to better use optical illusion deceleration marking, the authors investigated speed control effect of optical illusion deceleration marking through observing vehicle speed and trajectory collected at intersection optical illusion deceleration marking. Observed optical illusion deceleration marking is shown in Figure1-1.
Figure 1-1 Roadside optical illusion deceleration marking at intersection
2 TEST SCHEME
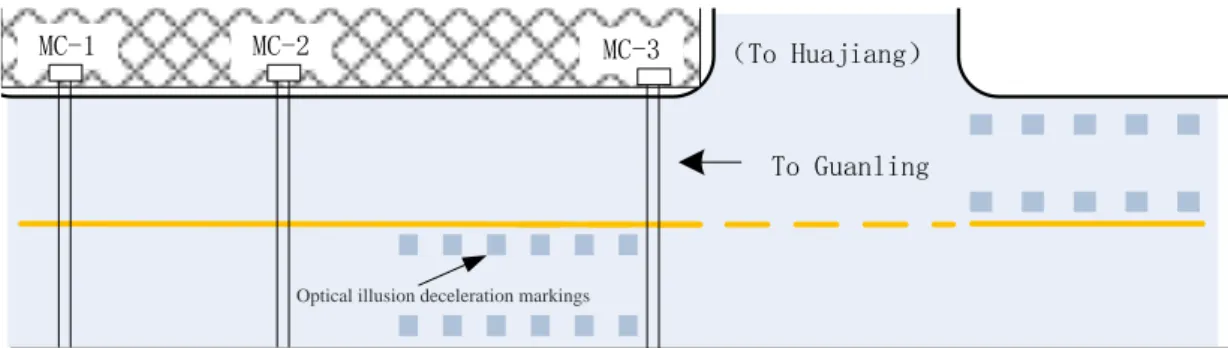
Structural dimension of observed optical illusion deceleration marking is shown in Figure 2-1. Sets of rectangular measuring 40cm×30cm are painted with equal interval at roadside. This is to provide the driver with visual and psychological illusion that there are roadside obstacles and the lane width is narrowed, so that driver can reduce speed.
This observation of roadside optical illusion deceleration marking at intersections is conducted together with engineering implementation. Detailed test scheme is as follow:
(1) Observed road: T-intersection on third class highway
(2) Observed optical illusion deceleration marking dimension: see in Figure 2-1 (3) Installed position: main line section near intersection
(4) Speed and vehicle type collecting equipment: MC5600 traffic analysis tool is used to collect vehicle speed, vehicle type, etc. Three MC units are installed on three cross-sections separately at one side of the main line intersection. The layout of equipments is shown in Figure 2-1.
(5) Vehicle trajectory observation method: vehicle trajectory is manually surveyed. Grids are populated on road perpendicular to the traveling direction of the vehicle with 50cm spacing, starting from the center of the roadway to road side. Surveyors recorded grid where vehicle left front wheel locates (front wheel for motorcycle). Through comparing grid number changes before and after marking implementation, vehicle driving trajectory changes could be investigated.
To Guanling
MC-1 MC-2 MC-3 (To Huajiang)
Optical illusion deceleration markings
Figure 2-1 Observation site map of optical illusion deceleration marking at intersection
3 DRIVING SPEED ANALYSIS
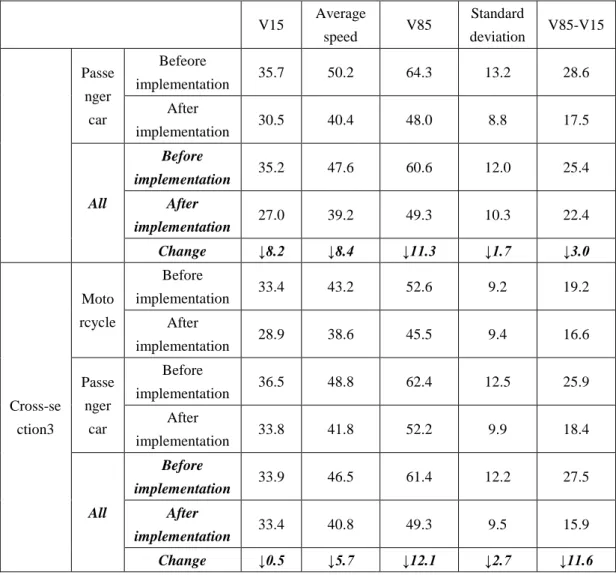
Traffic survey data demonstrate that main vehicle type at the observed intersection is passenger car and motorcycle. Therefore, implementation effect evaluation of optical illusion deceleration marking at intersection will be conducted on these two types of vehicles. Main speed indices for the three cross-sections are listed in Table 3-1[2].
Table 3-1 Speed indices of observed cross-sections before and after marking implementation (km/h) V15 Average speed V85 Standard deviation V85-V15 Cross-se ction1 Moto rcycle Before implementation 36.0 45.0 54.1 8.0 18.2 After implementation 30.7 42.2 52.7 10.5 22.0 Passe nger car Before implementation 39.3 52.7 63.8 12.4 24.5 After implementation 33.4 45.4 56.6 12.1 23.2 All Before implementation 37.5 49.8 61.8 11.2 24.3 After implementation 30.3 45.0 56.7 12.6 26.3 Change ↓7.2 ↓4.8 ↓5.1 ↑1.4 ↑2.0 Cross-se ction2 Moto rcycle Before implementation 34.6 43.5 51.6 8.5 17.0 After implementation 26.7 34.9 46.5 10.1 19.8
V15 Average speed V85 Standard deviation V85-V15 Passe nger car Befeore implementation 35.7 50.2 64.3 13.2 28.6 After implementation 30.5 40.4 48.0 8.8 17.5 All Before implementation 35.2 47.6 60.6 12.0 25.4 After implementation 27.0 39.2 49.3 10.3 22.4 Change ↓8.2 ↓8.4 ↓11.3 ↓1.7 ↓3.0 Cross-se ction3 Moto rcycle Before implementation 33.4 43.2 52.6 9.2 19.2 After implementation 28.9 38.6 45.5 9.4 16.6 Passe nger car Before implementation 36.5 48.8 62.4 12.5 25.9 After implementation 33.8 41.8 52.2 9.9 18.4 All Before implementation 33.9 46.5 61.4 12.2 27.5 After implementation 33.4 40.8 49.3 9.5 15.9 Change ↓0.5 ↓5.7 ↓12.1 ↓2.7 ↓11.6
Table 3-2 Overall speed indices before and after marking implementation (km/h) Average speed V85
Overall speed indices changes (indices in cross-section3 minus indices cross-section1) Motorcycle Before implementation 1.80 1.50 After implementation 3.60 7.20 Passenger car Before implementation 3.90 1.40 After implementation 3.60 4.40 All Before implementation 3.30 0.40 After implementation 4.20 7.40
Observed data analysis demonstrate that:
①Operating speed on cross-section1 (at which marking starts to be perceived by driver) decreased slightly from 61.8km/h to 56.7km/h, and average speed decreases by 4.8km/h after the implementation of optical illusion deceleration marking. Operating speed and average speed on cross-section2 (at which marking begins) decreased significantly with speed reduction of 11.3km/h, 8.4km/h respectively. Operating speed and average speed on cross-section3 decreased 12.1km/h, 5.7km/h respectively. Besides, the standard deviation of speed at cross-section3 decreased from 12.2 to 9.5, which indicates that vehicle operating speed at this cross-section has the tendency to be more uniformed. All data above clearly prove that operating speed decreased by 11km/h at starting marking cross-section, and 12km/h at ending marking cross-section.
②From perspective of all observation section, after the implementation of optical illusion deceleration marking, V85 changed significantly, from 0.4km/h before implementation to 7.4km/h after implementation. It can be concluded that vehicle operating speed decreased more after the implementation.
③Speed reduction of motorcycle and passenger car for each observation cross-section is: 1.4 km/h, and 7.2 km/h at cross-section1; 5.1km/h, and 16.3km/h at cross-section2; 7.1km/h, and 10.2km/h at cross-section3. Optical illusion deceleration marking has more influences on passenger car than motorcycle.
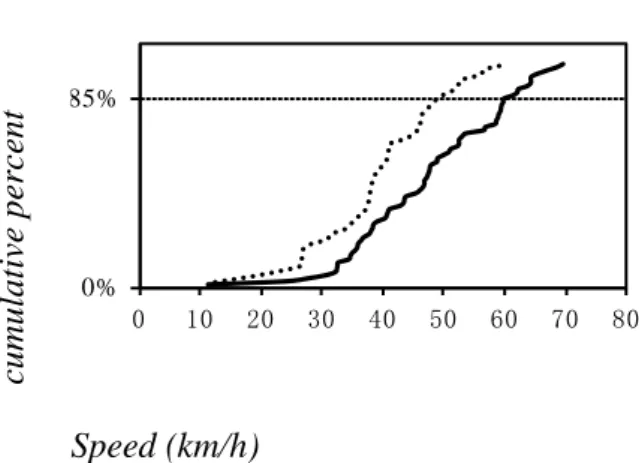
In order to describe vehicle speed variation before and after the implementation of optical illusion deceleration marking, the author made comparative analysis to vehicle operating speed distribution at three cross-sections as shown in Figure 3-1, Figure 3-2, and Figure 3-3.
before implementation after implementation cu m u la ti ve p er cen t 0% 85% 0 10 20 30 40 50 60 70 80 Speed (km/h)
Figure 3-1 Cross-section1 vehicle speed cumulative percent distribution before and after implementation
before implementation after implementation cu m u la ti ve p er cen t 0% 85% 0 10 20 30 40 50 60 70 80 Speed (km/h)
Figure 3-2 Cross-section2 vehicle speed cumulative percent distribution before and after implementation
before implementation after implementation cu m u la ti ve p er cen t 0% 85% 0 10 20 30 40 50 60 70 Speed (km/h)
Figure3-3 Cross-section3 vehicle speed cumulative percent distribution before and after implementation
From the above figures, vehicle operating speed V85 at all three cross-sections decreased significantly. Proportion of vehicle at 30km/h on cross-section1, cross-section2 increased, speed difference is reduced. Proportion of vehicle at high speed, especially at high speed of 60km/h or more, decreases at all cross-sections. Besides, proportion of vehicle at 25km/h did not change significantly. This proves that optical illusion deceleration marking at intersections has few influence to low-speed vehicles.
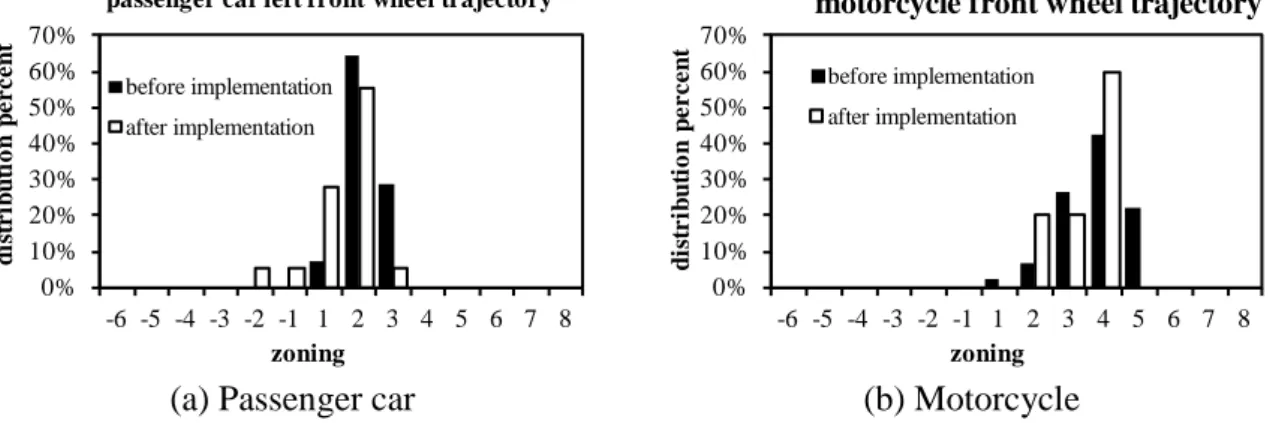
4 VEHICLE TRAJECTORY ANALYSES
Figure4-1 (a), Figure4-2(b) represent vehicle trajectory distribution for passenger car and motorcycle at K2287+200 before and after the implementation of optical illusion deceleration marking at intersections.
Figure4-1(a) shows that before marking implementation most left front wheel trajectory of passenger cars fall in zone 2 and zone 3, and there are not many passenger cars occupied opposite lane. After marking implementation, most left front wheel trajectory of passenger cars fall in zone 1and zone 2, and a few more passenger car occupied opposite lane. In overall, passenger car driving trajectory did not change significantly after marking implementation.
In Figure 4-1(b), motorcycle driving trajectory after marking implementation becomes more concentrated the center of lane, almost no motorcycle occupied opposite lane.
0% 10% 20% 30% 40% 50% 60% 70% -6 -5 -4 -3 -2 -1 1 2 3 4 5 6 7 8 di st r ibut io n pe r c e nt zoning
passenger car left front wheel trajectory
before implementation after implementation 0% 10% 20% 30% 40% 50% 60% 70% -6 -5 -4 -3 -2 -1 1 2 3 4 5 6 7 8 di st r ibut io n pe r c e nt zoning
motorcycle front wheel trajectory
before implementation after implementation
(a) Passenger car (b) Motorcycle
Figure 4-1 Vehicle trajectory distribution comparison before and after the implementation of optical illusion deceleration marking at intersections
5 CONCLUSIONS
Optical illusion deceleration markings at intersections of high passenger car and motorcycle traffic volume are analyzed, and it can be concluded that:
①Traffic observation data collected before and after implementation of optical illusion deceleration marking at intersections demonstrates that after marking implementation, overall average speed and operating speed decreased by 5-10km/h. Vehicle operating speed at starting marking cross-section decreased by 11km/h, and decreased by 12km/h at ending marking cross-section. The deceleration marking has certain effect in warning driver to reduce speed at intersections.
②Optical illusion deceleration marking at intersections effected more to motorcycle driving trajectory than passenger car driving trajectory. Motorcycle driving trajectory tended to be concentrated to the center of lane, and passenger car driving trajectory did not change significantly.
In all, optical illusion deceleration marking at intersections has significant speed reduction effect to vehicles approaching intersections, and can be recommended to accident prone road sections on two-lane highways which main vehicle types are passenger car and motorcycle. In order to enhance visual and psychological effects to drivers, markings can be painted to three-dimensional graphics, and further quantitative evaluation on the new style marking shall be further investigated.
REFERENCES
[1] Xianhua YAN., Design Study on Optical Illusion Deceleration Markings on Highway [D] . Chang'an University, Xi'an ,China ,2011.
[2]Jingmei WU.,Rural Highway Traffic Safety Prevention and Control Countermeasures Research and Demonstration of Western Mountainous area [R] .Road Safety Research Center, Research Institute of Highway, M.O.T, Beijing, China; 2012.