Sigurdur Erlingsson
Abubeker Ahmed
The Svappavaara road test sections
Field coring and laboratory tests
VTI notat 30A-2015
www.vti.se/en/publications
VTI notat 30A-2015
Published 2015
VTI notat 30A-2015
The Svappavaara road test sections
Field coring and laboratory tests
Sigurdur Erlingsson
Abubeker Ahmed
Diarienummer: 2012/0248-29
Omslagsbilder: Sigurdur Erlingsson, VTI Tryck: LiU-Tryck, Linköping 2015
Preface
This VTI note describes and gives results from the laboratory testing of specimens taken from four new instrumented test road sections that have been built on E45 close to the Svappavaara municipality in Norrbotten County in Northern Sweden. The structures are situated on road E45 close to the
intersection to road E10. The structures are instrumented with road performance and climate sensors. The structures will be monitored over the years to come.
As a part of the monitoring programme drilled asphalt specimens were taken from the road structure and tested at VTI’s material testing laboratory in Linköping. Furthermore, samples from the unbound base course have been taken and tested.
The aim of this report is to briefly describe the laboratory testing process as well as the testing results. The Swedish Transport Administration (STA) has financed the project. The contact person has been Johan Ullberg.
Linköping, November 2015
Quality review
Internal peer review was performed by Björn Kalman. Sigurdur Erlingsson and Abubeker Ahmed has made alterations to the final manuscript of the report. The research director Björn Kalman examined and approved the report for publication on 24 November 2015. The conclusions and recommendations expressed are the author’s/authors’ and do not necessarily reflect VTI’s opinion as an authority.
Kvalitetsgranskning
Intern peer review har genomförts av Björn Kalman. Sigurdur Erlingsson och Abubeker Ahmed har genomfört justeringar av slutligt rapportmanus. Forskningschef Björn Kalman har därefter granskat och godkänt publikationen för publicering 24 november 2015. De slutsatser och rekommendationer som uttrycks är författarens/författarnas egna och speglar inte nödvändigtvis myndigheten VTI:s uppfattning.
Table of content
Summary ...7
Sammanfattning ...9
1. Introduction ...11
2. The test sections ...12
3. Coring ...15
4. Laboratory test results ...17
4.1. Volumetric properties tests ...17
4.2. Stiffness tests...18
4.2.1. Indirect tensile stiffness modulus test ...18
4.2.2. Frequency sweep stiffness modulus test ...22
4.2.3. Frequency sweep shear modulus test ...24
4.3. Fatigue test ...27
4.4. Unbound granular base course ...28
5. Conclusions ...32
References ...33
Summary
The Svappavaara road test sections. Field coring and laboratory tests
by Sigurdur Erlingsson (VTI) and Abubeker Ahmed (VTI)
This report describes laboratory testing of specimens taken from four new instrumented test road sections that have been built on E45 close to the Svappavaara municipality in Norrbotten County in Northern Sweden. The structures are located about 100 km north of the Arctic Circle in a climate that is characterized by long cold winters and short mild summers.
The four test sections were built in a conventional manner. Each structure is about 200–250-metre-long with a central 100-metre-200–250-metre-long part defined as the actual test section. All structures are in total 60 centimetres in thickness resting on top of a 70-centimetre-thick old existing road. The bitumen bound part of all the four structures consists of four layers; a thin surface course layer, two binder layers and a road base layer. All structures have the same wearing course, TSK 16 with a standard 160/220 penetration grade bitumen. The main difference between the structures lies in the binder as well as the two road base layers. In structure 01 polymer modified binder were used in the binder layer as well as in both road base layers whilst in structure 02 only the binder layer was polymer modified. Structure 03 consists on the other hand of a binder layer and road base layers mixed with conventional penetration grade bitumen materials. Structure 04 has a binder layer with conventional penetration grade bitumen but the road base layers consists of a 2 × 90-millimetre-thick layers of large aggregates mixed with a cold emulsion.
As a part of the monitoring programme drilled asphalt specimens were taken in 2013 from the road structure and tested at VTI's material testing laboratory in Linköping. Furthermore, samples were taken from the unbound base course and tested. This report presents the test results for asphalt bound layers as well as for the unbound base course. For the bound layers the testing procedure included volumetric properties, stiffness modulus and fatigue tests for the different types of conventional and polymer modified asphalt mixtures. The tests were conducted in accordance with the Swedish or the equivalent European standards. For the unbound base course fundamental properties were estimated as well as stiffness and permanent deformation properties for different moisture contents.
Sammanfattning
Test sträckor på E45 vid Svappavaara – provkärnor och laboratorietestning
av Sigurdur Erlingsson (VTI) och Abubeker Ahmed (VTI)
Denna rapport beskriver laboratorieprovningar av provkroppar tagna från fyra instrumenterade vägsträckor på E45 nära samhället Svappavaara i Norrbottens kommun. Sträckorna ligger omkring 100 kilometer norr om polcirkeln i ett klimat som kännetecknas av långa kalla vintrar och korta milda somrar.
De fyra teststräckorna är byggda på konventionellt sätt. Varje delsträcka är omkring 200–250 meter lång med en central del på 100 meter som utgör den egentliga teststräckan. Alla konstruktionerna har en överbyggnadstjocklek på 60 centimeter och ligger ovanpå en gammal vägkonstruktion som uppskattas till 70 centimeter i tjocklek. Den bitumenbundna delen består av fyra lager, ett ytlager, bindlager samt två bundna bärlager. Ytlagret är identiskt på alla sträckorna TSK 16 med 160/220 standard bitumen. Huvudskillnaden i strukturerna ligger i sammansättningen av bindlagret samt de två bundna bärlagren. I struktur 01 används polymerer i bindlagret samt de två bundna bärlagren men i struktur 02 är endast bindlagret polymermodifierade. Struktur 03 och 04 är sedan helt utan polymerer. Struktur 04 har sedan ett 2 × 90 millimeter bundet bärlager som består av storstensskelett makadam blandad med kall emulsion (Viacomac från NCC).
Som en del i uppföljningsprogrammet togs på hösten 2013 borrade kärnor från alla sträckorna som sedan testades i VTI:s laboratorium i Linköping. Dessutom togs det prov från det obundna bärlagret som också testades. Denna rapport presenterar resultaten av laboratorietesterna. För de bundna lagren bestämdes sammansättning, styvhet samt utmattningsmotstånd. Alla tester utfördes enligt svensk eller ekvivalent europeisk norm. För det obundna bärlagret bestämdes några fundamentala egenskaper samt styvhet och permanenta deformationsegenskaper vid olika fuktkvoter.
1.
Introduction
Four new Long Term Pavement Performance (LTPP) pavement test structures were built in
Norrbotten County in Northern Sweden in 2012. The structures are situated on the road E45 close to the intersection to road E10 near the village Svappavaara. This is about 100 km north of the Arctic Circle in a climate that is characterized by long cold winters with short mild summers where the duration of the thawing period exceeds two months. The structures are instrumented with road performance and climate sensors. The structures will be monitored over the years to come.
The Norrbotten County is a sparsely populated area where the pavement structures usually consist of thin pavements and the traffic volume is low. In terms of traffic volume, the AADT for the sections was 1325 in the year 2010 with 14% classified as heavy vehicles. In 2012 a local iron ore operator received a special permission to transport ore along 160 km of the road network using vehicles that are 25 m long with a 90 tonnes gross weight, instead of the permissible 60 tonnes. The vehicles consist of a single wheel steering axle and three tridem axles. The axle’s weights are 1 × 9 + 3 × 27 = 90 tonnes. Thus, the individual axle loads fulfil the current legislation but as the vehicles are longer with more axles and their total weight exceeds the current legislation.
Due to this new ore transport it was deemed necessary to strengthen the local road network. As a part of evaluating pavement performances for very heavy vehicles four test structures were selected and built with the main objectives to increase the knowledge about pavement response and performance under heavy loading in cold climate with seasonal variation.
The four test sections were built in a conventional manner. All structures were in total 60 cm in thickness resting on top of an old existing road. The bitumen bound part of all the four structures consist of four layers; a thin surface course layer, a binder layer and two road base layers. All structures have the same wearing course TSK 16, a thin layer asphalt course with 16 mm maximum chipping size, with 160/220 penetration grade bitumen. The main difference between the structures lies in the structures binder and road base layers. Structure 01 has a polymer modified binder course and road base layers whilst structure 02 has the same polymer modified binder course as structure 01 over a more conventional road base layers. Structure 03 consists of conventional bound materials, with 70/100 penetration grade bitumen for the binder course as well as for the two road base layers.
Structure 04 has a conventional binder course but the two road base layers consists of a large aggregate skeleton layers mixed with a cold mix emulsion with 160/220 penetration grade bitumen. As a part of the monitoring programme drilled asphalt specimens were taken from the road structure and tested at VTI´s material testing laboratory in Linköping. Furthermore, samples were taken from the unbound base course and tested.
2.
The test sections
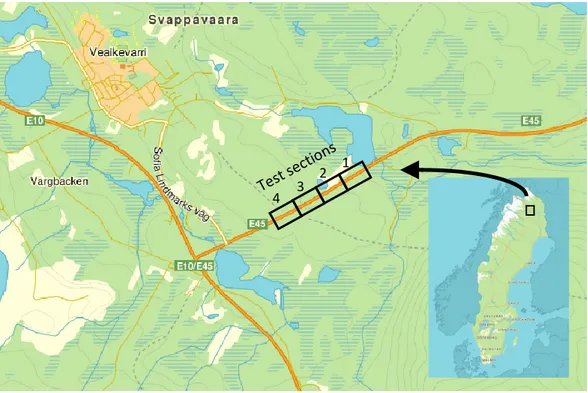
The four test sections are located on E45 close to the intersection with E10 in the vicinity of the Svappavaara village (see Figure 1). The test structures were built in the summer of 2012. The wearing course was placed in the beginning of July 2013.
Each test section is around 200–250 m long, with a central 100 m long part defined as the actual test section. In the remaining parts between the sections some overlapping of layers can occur.
Figure 1. Overview of the four test sections.
The test sections were built in a conventional manner on top of an existing road that had been rebuilt in 1975. The old pavement structure was a thin flexible structure with 5 cm AC on top of 15 cm of unbound gravelly base course over a subbase consisting of 65 cm of natural gravel. The top 15 cm of the old pavement were milled and widened in accordance with the new geometric design, leaving a sandy gravel layer on top of the native soil. The remains of the old road structure can therefore be expected to consist of approximately 70 cm of sandy gravel resting on top of the native silty sand subgrade.
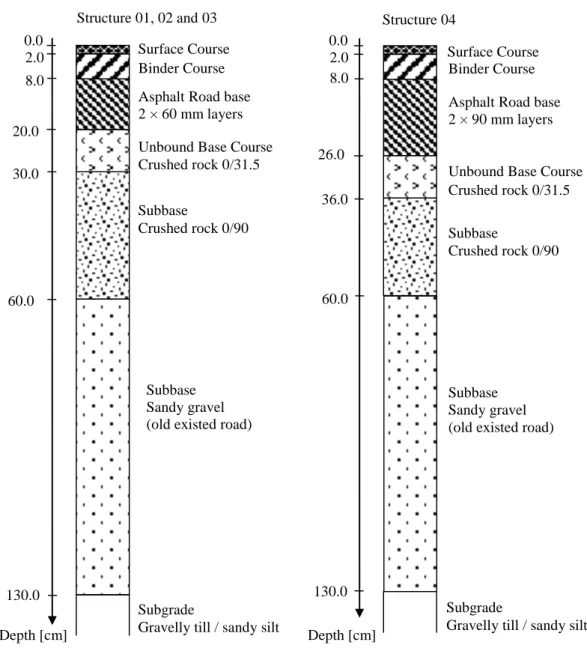
The cross sections of the four test structures are shown in Figure 2. A more detailed description of the layer composition is further provided in Table 1. The layer thicknesses of structures 01–03 are
identical but structure 04 has a thicker road base course, consisting of a cold asphalt concrete mix, and a reduced subbase thickness in order to have the same total thickness as the other structures.
The bitumen bound part of all the four structures consists of four layers; a thin surface course layer, a binder layer and two road base layers. All structures have the same wearing course TSK 16 with 160/220 penetration grade standard bitumen. Structure 01 has a polymer modified binder course as well as the two road base layers whilst structure 02 has the same polymer modified binder course as structure 01 but a more conventional road base layers. Structure 03 consists of conventional bound materials, with a 70/100 penetration grade bitumen for the binder course as well as for the two road base layers. Structure 04 has a conventional binder course but the two road base layers consists of a large aggregate skeleton layers mixed with cold emulsion with 160/220 penetration grade bitumen.
1 2 3 4
Figure 2. Cross sections of the test sections. Structures 01 to 03 have same layer thicknesses. Structure 01, 02 and 03 0.0 2.0 8.0 20.0 30.0 60.0 Depth [cm]
Unbound Base Course Crushed rock 0/31.5 Asphalt Road base 2 × 60 mm layers Binder Course Surface Course Structure 04 0.0 2.0 8.0 26.0 36.0 130.0 Depth [cm]
Unbound Base Course Crushed rock 0/31.5 Asphalt Road base 2 × 90 mm layers Binder Course Surface Course
Subbase
Crushed rock 0/90 Subbase
Crushed rock 0/90
Subbase Sandy gravel (old existed road)
Subbase Sandy gravel (old existed road)
Subgrade
Gravelly till / sandy silt
Subgrade
Gravelly till / sandy silt 130.0
Table 1. Properties of the layers for the four different test structures. Structure 01 02 03 04 Wearing course 20 mm asphalt surfacing TSK16 160/220 20 mm asphalt surfacing TSK16 160/220 20 mm asphalt surfacing TSK16 160/220 20 mm asphalt surfacing TSK16 160/220 Binder course 60 mm
ABb22 with Nypol 64-34 60 mm ABb22 with Nypol 64-34 60 mm ABb22 70/100 60 mm ABb22 70/100 Road base 60 mm AG22 40/100-75 + 60 mm AG22 90/150-75 2 x 60 mm AG22 160/220 2 x 60 mm AG22 70/100 2 x 90 mm Large aggregate AC (Viacomac 32) 160/220 Unbound base course 100 mm Crushed rock 0/31.5 100 mm Crushed rock 0/31.5 100 mm Crushed rock 0/31.5 100 mm Crushed rock 0/31.5 Subbase 300 mm Crushed rock 0/90 + 300 mm Crushed rock 0/90 + 300 mm Crushed rock 0/90 + 240 mm Crushed rock 0/90 + ≈ 700 mm Sandy gravel (old existed road)
≈ 700 mm Sandy gravel (old existed road) ≈ 700 mm Sandy gravel (old existed road) ≈ 700 mm Sandy gravel (old existed road)
Subgrade Gravelly till /
sandy silt Gravelly till / sandy silt Gravelly till / sandy silt Gravelly till / sandy silt
A more detailed description of the composition of the bound layers can be found in Erlingsson and Carlsson (2014).
3.
Coring
Figure 3 gives an overview of the test road structures.
Figure 3. The test road structures after opening the road for traffic.
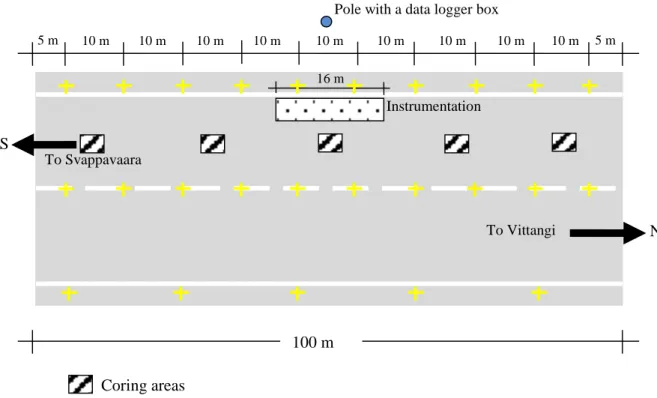
The coring took place on September 23, 2013. A specific scheme as given in Figure 4 was used for the coring. 5 m To Svappavaara 5 m 10 m 10 m 10 m 10 m 10 m 10 m 10 m 10 m 10 m N S
Pole with a data logger box
Instrumentation
To Vittangi
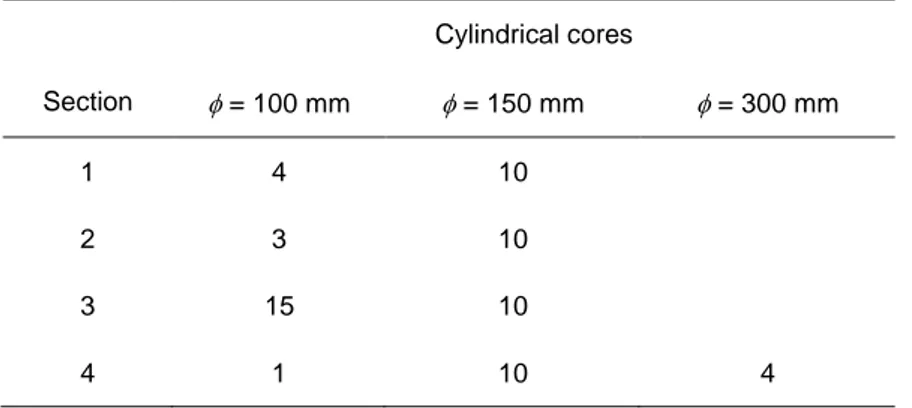
An overview of the number of cores is given in Table 2.
Table 2. Overview of the number of cylindrical cores drilled from the test roads.
Cylindrical cores Section = 100 mm = 150 mm = 300 mm 1 4 10 2 3 10 3 15 10 4 1 10 4
Besides the cylindrical cores, a disturbed sample was taken from the unbound base course.
Based on the cores, thickness of each layer was estimated. The average results are given in Table 3 and thickness of each drilled core is given in Appendix A.
Table 3. Average thickness [mm] of each layer based on the drilled cores.
Section 1 2 3 4
Wearing course 16.5 16.3 18.2 17.2
Binder course 65.8 58.7 60.9 62.3
Road base upper 63.6 56.2 63.0 93.5
Road base lower 66.6 65.6 67.2 110.6
4.
Laboratory test results
Laboratory tests were conducted on samples cored from the test structures described in the preceding sections. The laboratory tests carried out cover the volumetric properties, stiffness, fatigue and shear modulus tests of the bound layers. The stability of the large aggregate cold mix used as road base in structure 4 was poor and therefore it was not possible to carry out any testing on them. They have therefore been excluded from this report. Repeated load triaxial tests (RLT) were performed on the unbound aggregate base. The results are summarized in the subsequent sections.
4.1.
Volumetric properties tests
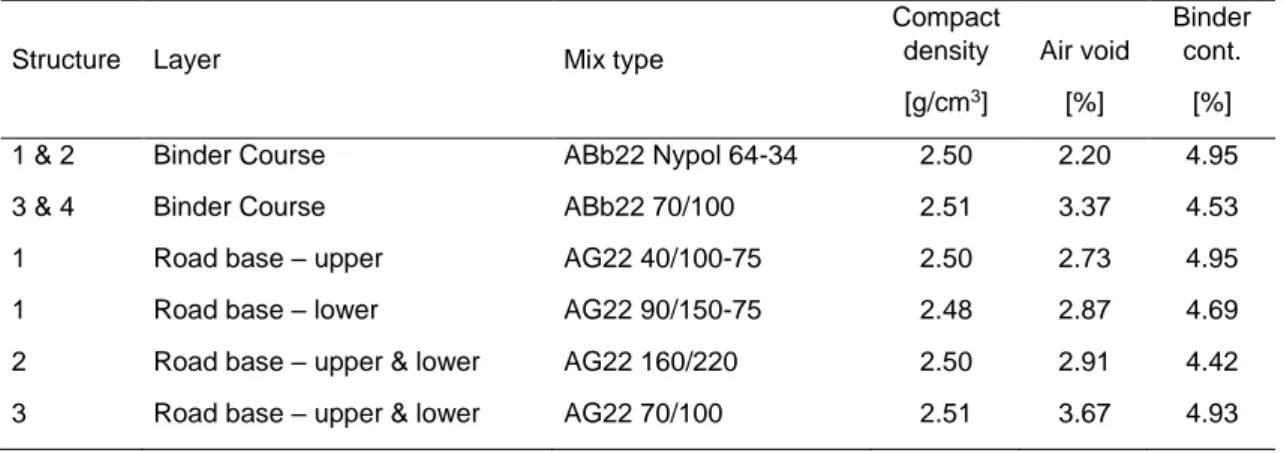
The volumetric properties of the different types of mixes used in the test sections were determined according to the European standards (SS-EN12697-5, SS-EN12697-6 and SS-EN12697-8). Table 4 presents the compact densities and the air voids of the asphalt layers of the different test structures. Figures 5 and 6 show the compact densities and air voids with their corresponding standard deviations. The binder contents of the mixes were determined using the solvent extraction method and
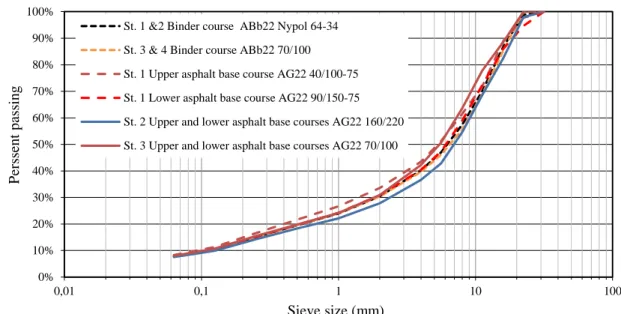
subsequently the grain size distributions of the mixes were obtained in accordance with the European standards SS-EN 12697-1 and SS-EN 12697-2, respectively. The grain size distribution curves of the different mixes are shown in Figure 7.
Table 4. Volumetric properties of the layers for the four different test structures.
Structure Layer Mix type
Compact density [g/cm3] Air void [%] Binder cont. [%] 1 & 2 Binder Course ABb22 Nypol 64-34 2.50 2.20 4.95
3 & 4 Binder Course ABb22 70/100 2.51 3.37 4.53
1 Road base – upper AG22 40/100-75 2.50 2.73 4.95
1 Road base – lower AG22 90/150-75 2.48 2.87 4.69
2 Road base – upper & lower AG22 160/220 2.50 2.91 4.42 3 Road base – upper & lower AG22 70/100 2.51 3.67 4.93
2,50 2,52 2,54
/cm
Figure 6. Air voids of the different mixes with their standard deviations.
Figure 7. Grain size distribution curves of the different mixes.
4.2.
Stiffness tests
Three different types of stiffness tests were carried out in accordance with the Swedish industry standard (FAS method), a sinusoidal indirect stiffness modulus test, a frequency sweep stiffness modulus test and a dynamic shear modulus.
4.2.1. Indirect tensile stiffness modulus test
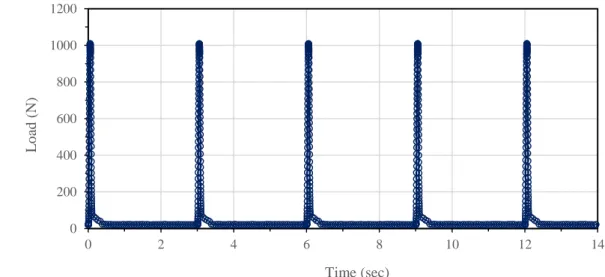
The stiffness test was carried out at three temperatures (3, 10 and 20C) in accordance with the Swedish industry standard FAS 454. Figure 8 shows the actual test setup and Figure 9 shows the load pulses. The load pulse consists of 0.1 sec loading and 2.9 sec rest period. Figures 10 and 11 present the stiffness modulus of the binder course and the asphalt road base course mixes, respectively.
0,00 0,50 1,00 1,50 2,00 2,50 3,00 3,50 4,00 4,50
ABb22 Nypol 64-34 ABb22 70/100 AG22 40/100-75 AG22 90/150-75 AG22 160/220 AG22 70/100
A ir v o id ( %) Mixture 0% 10% 20% 30% 40% 50% 60% 70% 80% 90% 100% 0,01 0,1 1 10 100 P er ss en t p ass in g Sieve size (mm)
St. 1 &2 Binder course ABb22 Nypol 64-34 St. 3 & 4 Binder course ABb22 70/100 St. 1 Upper asphalt base course AG22 40/100-75 St. 1 Lower asphalt base course AG22 90/150-75 St. 2 Upper and lower asphalt base courses AG22 160/220 St. 3 Upper and lower asphalt base courses AG22 70/100
Figure 8. Indirect stiffness modulus test setup.
Figure 9. Load pulses for stiffness modulus test.
0 200 400 600 800 1000 1200 0 2 4 6 8 10 12 14 L o ad ( N) Time (sec)
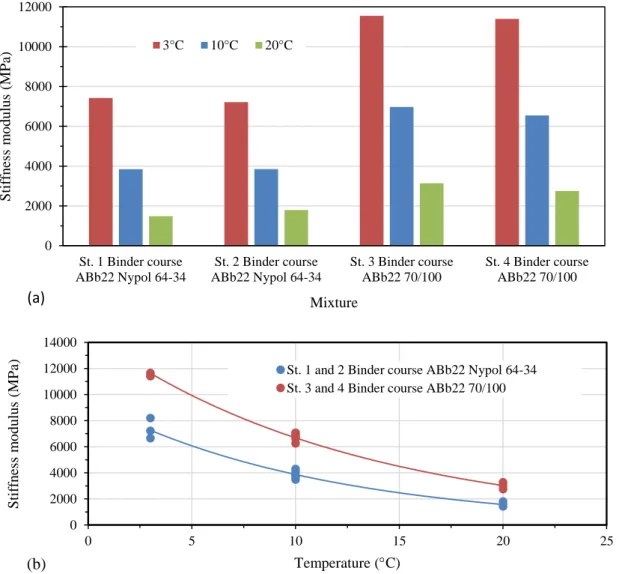
Figure 10. (a) Stiffness modulus for the binder course mixtures of the test structures at three test temperatures. (b) Curve fitted data.
0 2000 4000 6000 8000 10000 12000 St. 1 Binder course ABb22 Nypol 64-34 St. 2 Binder course ABb22 Nypol 64-34 St. 3 Binder course ABb22 70/100 St. 4 Binder course ABb22 70/100 Sti ff n ess m o d u lu s (MP a) Mixture 3°C 10°C 20°C (a) 0 2000 4000 6000 8000 10000 12000 14000 0 5 10 15 20 25 Sti ff n ess m o d u lu s (MP a) Temperature (C)
St. 1 and 2 Binder course ABb22 Nypol 64-34 St. 3 and 4 Binder course ABb22 70/100
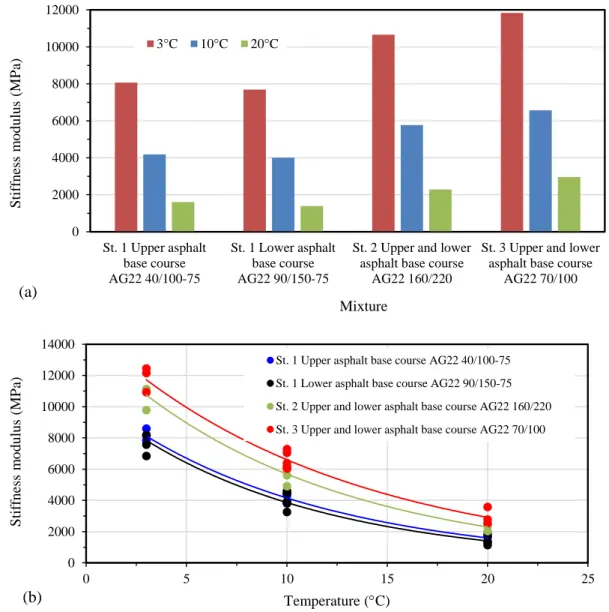
Figure 11. (a) Stiffness modulus for the asphalt base course mixtures of the test structures at three temperatures. (b) Curve fitted data.
The measured stiffness data is fitted using exponential function, shown in Equation (1). The curve fitting parameters are given in Table 5.
0 2000 4000 6000 8000 10000 12000 St. 1 Upper asphalt base course AG22 40/100-75 St. 1 Lower asphalt base course AG22 90/150-75St. 2 Upper and lower asphalt base course
AG22 160/220
St. 3 Upper and lower asphalt base course
AG22 70/100 Sti ff n ess m o d u lu s (MP a) Mixture 3°C 10°C 20°C (a) 0 2000 4000 6000 8000 10000 12000 14000 0 5 10 15 20 25 Sti ff n ess m o d u lu s (MP a) Temperature (C)
St. 1 Upper asphalt base course AG22 40/100-75 St. 1 Lower asphalt base course AG22 90/150-75 St. 2 Upper and lower asphalt base course AG22 160/220 St. 3 Upper and lower asphalt base course AG22 70/100
4.2.2. Frequency sweep stiffness modulus test
The cyclic stiffness modulus test or the cyclic indirect stiffness modulus test consists of applying a certain number of cyclic (sinusoidal) loading along the vertical diametral plane of a cylindrical specimen to achieve a constant peak tensile strain along the horizontal diametral plane perpendicular to the loading plane. The samples extracted from the test structures were tested at four temperatures (-5, 0, 10 and 15 oC) and six loading frequencies (16, 8, 4, 1, 0.5 and 0.1 Hz). A similar test setup and
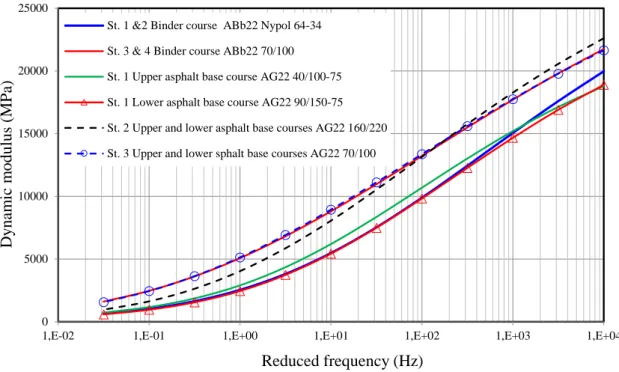
procedure as shown in Figure 8 was employed. The test results of the cyclic IDT tests are presented in Figures 12 and 13 as master curves of the dynamic modulus and phase angle at a reference
temperature of 10 oC. A fitting function shown in Equation (2) was used to fit the master curve for
phase angle and a sigmoidal fitting function was used for dynamic modulus shown in Equation (3). Arrhenius equation, Equation (4), was used as a shifting function:
2 1 1 1 b a f c e e d r e a f e a f r r
(2)
rf
E
log
exp
1
log
(3)
273 1 273 1 log ref T T T R a (4) T r Tf
f
a
(5)where is phase angle; a, b, c, d and e are phase angle master curve fitting parameters; E is the dynamic modulus, fr is the reduced frequency, fT is the frequency at temperature T; α, β, γ and δ are
sigmoidal fitting function parameters for dynamic modulus master curve; aT is the shift factor, T is the
temperature in °C, Tref = 10C is the reference temperature and R is constant.
The speed, depth and loading frequency relationship shown in Equation (5) can be used to convert speed into frequency (Said et al., 2013, Ahmed and Erlingsson, 2014):
V
z
t
0
.
5
0
.
2
0
.
94
log
log
(6)where t is the loading time in sec, z is the depth in meters and V is the speed in km/h. The frequency at reference temperature fT is given as:
t
f
T
2
1
(7)Figure 12. Master curves of dynamic modulus for different types of mixes at a reference temperature of 10C. 0 5000 10000 15000 20000 25000
1,E-02 1,E-01 1,E+00 1,E+01 1,E+02 1,E+03 1,E+04
D y nam ic m odul us ( MPa) Reduced frequency (Hz)
St. 1 &2 Binder course ABb22 Nypol 64-34 St. 3 & 4 Binder course ABb22 70/100 St. 1 Upper asphalt base course AG22 40/100-75 St. 1 Lower asphalt base course AG22 90/150-75 St. 2 Upper and lower asphalt base courses AG22 160/220 St. 3 Upper and lower sphalt base courses AG22 70/100
10 20 30 40 50 60 P h ase an g le ( )
St. 1 &2 Binder course ABb22 Nypol 64-34 St. 3 & 4 Binder course ABb22 70/100 St. 1 Upper asphalt base course AG22 40/100-75 St. 1 Lower asphalt base course AG22 90/150-75 St. 2 Upper and lower asphalt base courses AG22 160/220 St. 3 Upper and lower sphalt base courses AG22 70/100
Table 6. Fitting parameters for dynamic modulus and phase angle master curves. Fitting parameters Mixture ABb22 Nypol 64-34 ABb22 70/100 AG22 40/100-75 AG22 90/150-75 AG22 160/220 AG22 70/100 4.52 4.56 4.29 4.43 4.52 4.54 -3.38 -7.24 -2.23 -2.99 -4.41 -10.91 0.70 2.01 0.53 0.62 1.34 2.50 -0.49 -0.36 -0.73 -0.56 -0.48 -0.37 a 1.32 -0.16 0.74 -0.13 -0.78 -2.16 b 28.36 23.56 27.79 3.12 2.85 4.19 c 8.81 5.09 10.34 25.66 28.51 22.98 d 33.61 47.24 32.65 22.84 23.86 45.60 e 0.88 1.55 0.87 0.84 1.10 1.58 R 10279.82 12137.01 9975.38 9999.53 11411.17 12232.36
4.2.3. Frequency sweep shear modulus test
The dynamic shear modulus test was conducted in accordance with the method and the equipment developed at Swedish National Road and Transport Research Institute, VTI. According to this method, the two sides of a cylindrical asphalt specimen having diameter of 150 mm and thickness of ¼ of the sample diameter are glued to two steel plates using epoxy. Then the glued specimen is mounted on the shear box device where one of the plates is rigidly fixed and the other is then exposed to a vertical sinusoidal cyclic loading over a range of frequencies. Further details on the testing procedure can be found in Said et al. (2013). The dynamic shear testing procedure involves testing at four temperatures: -5, 10, 30 and 50oC, and eight loading frequencies: 16, 8, 4, 2, 1, 0.5, 0.1 and 0.05 Hz. Figure 14
shows the shear box apparatus. The master curves for the dynamic shear modulus and the phase angle are presented in Figures 15 and 16. The curve fitting parameters according to Equations (2), (3) and (4) are given in Table 7.
Figure 14. Dynamic shear modulus test setup.
Table 7. Fitting parameters for dynamic shear modulus and phase angle master curves.
Fitting parameters Mixture ABb22 Nypol 64-34 ABb22 70/100 AG22 40/100-75 AG22 90/150-75 AG22 160/220 AG22 70/100 3.65 3.71 3.71 3.67 3.65 3.67 -1.47 -1.57 -1.58 -1.41 -1.51 -1.59 0.38 1.14 0.56 0.49 0.98 1.15 -0.85 -0.64 -0.77 -0.76 -0.79 -0.70 a -0.98 -2.33 -1.24 -1.17 -1.64 -2.07 b 1.91 2.16 1.96 2.04 1.92 2.22 c 26.40 22.24 26.18 24.26 30.38 25.58 d 11.66 10.20 11.61 9.20 5.54 6.39 e 5.59 7.52 5.84 7.35 8.67 8.70 R 9714.08 10898.16 9761.96 10092.93 10980.30 10991.12
Figure 15. Master curves for dynamic shear modulus of the asphalt mixes at a reference temperature of 10C.
Figure 16. Master curves for phase angle of the asphalt mixes at a reference temperature of 10C.
0 500 1000 1500 2000 2500 3000 3500 4000 4500 5000
1,E-08 1,E-06 1,E-04 1,E-02 1,E+00 1,E+02 1,E+04
Dy n am ic m o d u lu s (MP a) Reduced frequency (Hz)
St. 1 &2 Binder course ABb22 Nypol 64-34 St. 3 & 4 Binder course ABb22 70/100
St. 1 Upper asphalt base course AG22 40/100-75 St. 1 Lower asphalt base course AG22 90/150-75 St. 2 Upper and lower asphalt base courses AG22 160/220 St. 3 Upper and lower asphalt base courses AG22 70/100
0 5 10 15 20 25 30 35 40 45 50
1,E-08 1,E-06 1,E-04 1,E-02 1,E+00 1,E+02 1,E+04
P h ase an g le ( ) Reduced frequency (Hz)
St. 1 &2 Binder course ABb22 Nypol 64-34 St. 3 & 4 Binder course ABb22 70/100
St. 1 Upper asphalt base course AG22 40/100-75 St. 1 Lower asphalt base course AG22 90/150-75 St. 2 Upper and lower asphalt base courses AG22 160/220 St. 3 Upper and lower asphalt base courses AG22 70/100
4.3.
Fatigue test
The fatigue test was conducted in accordance with the VTI notat 38-1995 or SS-EN 12697-24 Appendix E. The method involves applying a certain number of load pulses along the vertical diametral plane of a cylindrical sample thus inducing a tensile stress along the horizontal diametral plane perpendicular to the loading plane. The load pulse consists of 0.1 sec loading and 0.4 sec rest period as shown in Figure 17. Figure 18 presents the results of the fatigue tests conducted for lower asphalt road base mixes of the test structures 1, 2 and 3.
Figure 17. Load pulses for fatigue test.
0 500 1000 1500 2000 2500 0 0,5 1 1,5 2 2,5 3 Load (N ) Time (sec) 100 1000 St rai n (µst rai n) St. 1 AG22 90/150-75 St. 2 AG22 160/220
where Nf is the number of load cycle to failure, t is the initial tensile strain; K and n are regression
constants. The curve fitting parameters are given in Table 8.
Table 8. Curve fitting parameters for fatigue test results.
Parameters St 1. AG22 90/150-75 St. 2 AG22 160/220 St 3. AG70/100 n 2.61 3.15 3.62
K 4.50E+11 3.10E+12 2.80E+13
R² 0.81 0.97 0.92
4.4.
Unbound granular base course
Samples were taken from the unbound granular base course material. The material was tested in laboratory for estimation of some fundamental properties such as grain size distribution, specific gravity, Proctor test and optimum moisture content, see Figure 19 and Table 9. Further, a repeated load triaxial (RLT) test was carried out on 150 mm × 300 mm samples to evaluate the resilient and permanent deformation properties. Further details on the testing procedure can be found in Rahman and Erlingsson (2012).
Figure 19. Grain size distribution curve for the base course layer.
For the resilient testing totally seven tests on the same samples with different moisture contents were carried out in the range 2–7.5% corresponding to 26–99% degree of saturations, see Table 9. Figure 20 shows the obtained results. Further, the obtained k1 and k2 values from Equation (10) are given in
Figure 21 as a function of degree of saturation.
Table 9. Fundamental parameters for the base course material.
GS [-] Fines content (< 75 µm) [%] wopt [%] Sopt [%] wsat [%] Maximum dry density [gm/cc] Test conditions γdry [gm/cc] Range of w [%] Range of S [%] Samples tested 2.68 8.6 6.9 91.6 7.6 2.35 2.23 2-7.5 26-99 1 0 10 20 30 40 50 60 70 80 90 100 0,01 0,1 1 10 100
P
assi
ng
[
%
by
we
ig
ht
]
Sieve size [mm]
The resilient modulus MR, which is an estimate of the stiffness modulus of the specimen is expressed as: r d R
M
(9)where d is the cyclic deviator stress and r is axial resilient strain.
The stiffness is highly dependent on the state of stress and is therefore frequently expressed as a function of the bulk stress = 1 + 2 + 3. Here MR is expressed with the well known k- model
given in its non-dimensional form as:
2 1 k a a R p p k M
(10)where k1 and k2 are material parameters and pa is reference pressure taken as equal to the atmospheric
pressure, that is pa = 100 kPa.
The degree of saturation S of the specimen is related to the moisture content w of the specimen through:
1
dry w sG
w
S
(11)where Gs is the specific gravity of the specimen, w is the unit weight of water dry is the dry unit
weight of the specimen.
300 400 500 600 700 800 900 1000 il ient m odul us , MR [MPa] w = 2% w = 3% w = 4% w = 5% w = 6% w = 7% w = 7.5%
Figure 21. The parameters k1 and k2 as a function of the degree of saturation.
The permanent deformation properties were studied based on Multi Stage (MS) RLT tests. The stress levels for the tests were selected according to Low Stress Level (LSL) according to the European standard. Totally 30 stress paths were applied each with 10 thousand load repetitions, thus resulting in totally 300,000 load repetitions. Six tests were performed, see Table 10. First three tests at different moisture content at constant degree of compaction followed by three tests at constant moisture content but varying degree of compaction.
Table 10. Permanent deformation tests.
Fines content (< 75 µm) [%] wopt [% by weight] GS [-] Maximum dry density [gm/cc]
Tests performed with
w [% by weight] S [%] γdry [gm/cc] Stress level Samples tested 8.6 6.9 2.68 2.35 2 26.7 2.23 LSL 2 4 53.5 2.23 LSL 2 7 78.3 2.16 LSL 1 7 85.4 2.20 LSL 1 7 93.6 2.23 LSL 2 7 99.8 2.26 LSL 1
The results were analysed according to the model:
f bS pN
aN
S
f
ˆ
(12)where
ˆ
p is the accumulated permanent strain after N load repetitions and a and b are regressionparameters related to the material. The term Sf describes the effect of the stress conditions and is
expressed as: 0 250 500 750 1000 1250 1500 1750 0 20 40 60 80 100 k1 [-] S [%] 0 0.2 0.4 0.6 0.8 1 1.2 0 20 40 60 80 100 k2 [-] S [%]
a a f p p p q S (13)
where q is the deviatoric stress, p is the hydrostatic stress and is parameter determined using a regression analysis. A value of 0.75 gives usually a good agreement and that value has been used here. Table 11 gives the curve fitting parameters.
Figure 21. Permanent deformation development with the number of load pulses from RLT test.
Table 11. Curve fitting parameters for the permanent deformation tests of the unbound base course.
w [% by weight] Degree of saturation [%] Dry density [gm/cc] Degree of compaction [%] Model parameters Quality of fit (α = 0.75) a b R2 Correct shakedown range 0 0,02 0,04 0,06 0,08 0,1 0,12 0,14 0,16 0 60000 120000 180000 240000 300000 A cc um ul at ed per m ane nt st rai n, εˆp
Number of load cycles, N
w = 2% w = 4% w = 7% (DOC = 96%) w = 7% (DOC = 95%) w = 7% (DOC = 93.5%) w = 7% (DOC = 92%)
Sequence 1 Sequence 2 Sequence 3 Sequence 4 Sequence 5
5.
Conclusions
This report presents the laboratory test procedures and results of specimens taken from the four instrumented test road sections that have been built on E45 close to the Svappavaara municipality in Norrbotten County in Northern Sweden. The project is sponsored by the Swedish Transport
Administration. The structures are located about 100 km north of the Arctic Circle in a climate that is characterized by long cold winters and short mild summers.
Each test section is around 250 m long, consisting of a 100 m long inner part that constitutes the intrinsic test section. The structures were built and instrumented in the summer of 2012 except for the wearing course that was placed in the summer of 2013 along with the temperature sensors that are placed in the asphalt layers.
In 2013 drilled cores were taken from all bound layers and disturbed samples from unbound layers for further laboratory analysis. This report presents the test results for asphalt bound layers as well as for the unbound base course. For the bound layers the testing procedure included volumetric properties, stiffness modulus and fatigue tests for the different types of conventional and polymer modified asphalt mixtures. The tests were conducted in accordance with the Swedish or the equivalent European standards. For the unbound base course fundamental properties were estimated as well as stiffness and permanent deformation properties at different moisture contents.
The testing procedure went well without any problems except for the large aggregate cold mix layer (road base layer) in section 4. The cores were not stable and aggregates loosened while preparing the samples in the laboratory. It was therefore not possible to carry out any testing on them. They have therefore been excluded from this report.
References
Ahmed A. W. and Erlingsson, S. (2014) “Evaluation of permanent deformation model for asphalt concrete mixtures by means of extra-large wheel tracking and full scale accelerated pavement tests,”
Road Materials and Pavement Design. DOI: 10.1080/14680629.2014.987311.
Erlingsson, S. and Carlsson, H. (2014) “The Svappavaara Road Test Sections – Instrumentation,” VTI notat 12A-2014. http://www.vti.se/sv/publikationer/pdf/nya-testvagstrackor-pa-e45-vid-svappavaara--instrumentering.pdf
Rahman, S. and Erlingsson, S. (2012). Moisture Sensitivity of Unbound Granular Materials,
Proceedings of the 4th European Pavement Asset Management Conference (EPAM4), September
2012, Malmö, Sweden.
Said, S., Hakim, H. and Oscarsson, E. (2013) “Rheological characterization of asphalt concrete using a shear box,” Journal of Testing and Evaluation, Vol. 41, No. 4, pp. 602-610. DOI:
Appendix A
Table A1. Thickness of layers based on drilled cores.
Thickness [mm]
Section Drilling area Sub-test Test no. Surface course Binder layer Road base - Upper Road base - Lower Total 1 2 a 1-2a 16 68 62 66 211 1 2 b 1-2b 17 66 66 62 211 1 3 a 1-3a 16 63 65 70 214 1 3 b 1-3b 17 65 65 65 212 1 4 a 1-4a 15 70 63 70 218 1 4 b 1-4b 17 68 62 70 217 1 5 a 1-5a 19 60 64 65 208 1 5 b 1-5b 15 66 62 65 208 2 1 a 2-1a 16 58 51 64 188 2 1 b 2-1b 14 58 53 71 196 2 2 a 2-2a 15 55 53 60 183 2 2 b 2-2b 16 58 50 65 189 2 3 a 2-3a 18 60 58 67 203 2 3 b 2-3b 15 60 60 68 203 2 4 a 2-4a 17 60 60 65 202 2 4 b 2-4b 16 59 57 63 195 2 5 a 2-5a 17 60 60 65 202 2 5 b 2-5b 19 60 60 68 207 3 1 a 3-1a 17 60 62 70 209 3 1 b 3-1b 18 63 63 70 214 3 2 a 3-2a 18 61 60 64 202 3 2 b 3-2b 19 57 63 63 201 3 3 a 3-3a 20 60 65 67 212 3 3 b 3-3b 20 55 70 65 210 3 4 a 3-4a 17 60 60 67 204 3 4 b 3-4b 18 62 60 67 207 3 5 a 3-5a 18 65 64 70 217 3 5 b 3-5b 17 66 63 70 216
www.vti.se
VTI, Statens väg- och transportforskningsinstitut, är ett oberoende och internationellt framstående forskningsinstitut inom transportsektorn. Huvuduppgiften är att bedriva forskning och utveckling kring
infrastruktur, trafi k och transporter. Kvalitetssystemet och
miljöledningssystemet är ISO-certifi erat enligt ISO 9001 respektive 14001. Vissa provningsmetoder är dessutom ackrediterade av Swedac. VTI har omkring 200 medarbetare och fi nns i Linköping (huvudkontor), Stockholm, Göteborg, Borlänge och Lund.
The Swedish National Road and Transport Research Institute (VTI), is an independent and internationally prominent research institute in the transport sector. Its principal task is to conduct research and development related to infrastructure, traffi c and transport. The institute holds the quality management systems certifi cate ISO 9001 and the environmental management systems certifi cate ISO 14001. Some of its test methods are also certifi ed by Swedac. VTI has about 200 employees and is located in Linköping (head offi ce), Stockholm, Gothenburg, Borlänge and Lund.
HEAD OFFICE LINKÖPING SE-581 95 LINKÖPING PHONE +46 (0)13-20 40 00 STOCKHOLM Box 55685 SE-102 15 STOCKHOLM PHONE +46 (0)8-555 770 20 GOTHENBURG Box 8072 SE-402 78 GOTHENBURG PHONE +46 (0)31-750 26 00 BORLÄNGE Box 920 SE-781 29 BORLÄNGE PHONE +46 (0)243-44 68 60 LUND Medicon Village AB SE-223 81 LUND PHONE +46 (0)46-540 75 00