STUDY OF DEFECTS IN PV MODULES
UV fluorescence and Thermographic photography for Photovoltaics (PV) Field
Application
SOPHIE NYLUND
ZAHRA BARBARI
School of Business, Society and Engineering Course: degree project in energy system Course code: ERA403
Credits: 30 hp
Program: Master of science in energy system
Supervisor: Amir Vadiee Examinor: Jan Sandberg Costumer: Bengt Stridh, MDH Date: 2019-06-12
ABSTRACT
For a PV plant it is of fundamental importance that the operation of the PV modules is free from faults or at least that the faults can be detected early, to ensure efficient electricity production. Some defects such as cracks can be seen in visible light while microcracks and damage to the silicon material can only be seen through special lighting. This study focuses on the most common defects in photovoltaic (PV) systems. Compare the infrared (IR) technology with the new ultraviolet (UV) fluorescence image technique for PV
characterization, based on their accuracy and uncertainty factors under an experimental field investigation. In this study, first a literature study was conducted to the most common
defects in PV system and their impact on electricity generation. Then a simulation model of a PV system was created in PVsyst and exported to Microsoft Excel which was used to evaluate how different defects at different stages of the PV cell's life cycle impact electricity generation, performance parameters and economic exchange. Furthermore, experiments with UV and IR was implemented at a PV system located in Dalarna and some PV modules at MDH.
It was conducted that occurrence of snail tracks, delamination and hot spots in combination with bypass failures and non-functioning cell will affect the economic profitability in the long run and the payback time will increase since their impacts on electricity generation and performance parameters are huge. The worst case is when PV modules are affected by the fault in bypass diode and non-functioning cell which result to a payback time longer than the module's lifetime and huge amount electricity losses in different bypass diodes
configurations. Since UV and IR are two different methods that are performed in two different ways, different errors occurred during the measurements. The biggest external factor was the weather that determined if the experiment could be implemented. The IR method gave decent results and was quicker to use, but the UV method highlighted some defect which could not be seen with the IR technology.
Keywords: UV fluorescence, IR thermography, defects in PV modules, delamination,
PREFACE
In June 2019, we submitted the Master of Science thesis in energy system. This since we left an intensive research period behind us, a period that required hard work from us writers, but which also provided an incredible experience and knowledge.
We would like to thank everyone involved who made this study possible. We would like to extend our special thanks to the CEO for Vanhälls såg AB for letting us examine their PV plant, supervisor Amir Vadiee and external supervisor Bengt Stridh who has been available and supported us in the study. We also want to thank the laboratory technician Joakim Jansson with the support during the experiment in the laboratory and Fagersta’s police station for the practical support with the UV application.
Finally, we would like to thank our fellow students who have come up with constructive criticism about the study as well as our close relatives who supported us during the work. We hope that the study will be perceived as interesting and that it should contribute to motivation and inspiration to continue researching the subject.
Västerås, June 2019
SUMMARY
For a Photovoltaic (PV) plant it is important that the operation of the PV modules is free from faults or at least that they can be detected early by fast and reliable methods, to ensure an efficient electricity production and a long life, which results in a high return on investment. The goal of this thesis is to study defects in PV module and to compare infrared (IR)
technology with the new ultraviolet (UV) fluorescence technique for PV characterization by performing experimental field investigations with IR and UV imaging on some modules at MDH and the existing PV system at southern of Dalarna. In addition, simulate how different defects at different stages of the PV cell's life cycle impact electricity generation, performance parameters and economic exchange. Literature studies are performed to examine UV and IR technologies and the most common types of defects and their impact on power performance of PV modules. Furthermore, a standard model is built in simulation software “PV syst” and the system is simulated, and the result has been used for further calculations in Excel by considering three scenarios which are;
• Occurrence of different defects in some PV modules during different years • Occurrence of different defects in one PV module
• Occurrence of defect in the bypass diode and a non-functioning cell in some PV modules
In addition, suitable equipment for IR and UV imaging are obtained for the examination of outdoor and indoor experiments with IR and UV imaging and an interview with the owner of PV system at Vanhälls Såg AB is performed to become more familiar with the selected PV system.
The result from study showed that encapsulant delamination, encapsulant discoloration, hot spots, cracks, snail trails and fault in cell and interconnection ribbon are the most common defects for PV modules in the field. Occurrence of these defects in PV modules depend on a lot of factors such as pressure and vibrations during production, installation and
transportation of PV modules or environmental stress such as heavy snow, high UV
irradiation, wind etc. Using of poor-quality material, poor maintenance and processing, poor quality workmanship and design are other reasons. Improvement of production processes, using detection methods for detecting defects early in the production phase such as UV and IR, using of material with high quality, increasing the knowledge of the staff and continuous maintenance can reduce the occurrence of defects in PV modules.
In scenario 1, delamination has the highest impact on electricity production, performance parameters and economic exchange where it reduces the production to 18.8 MWh and the performance ratio to 62 % in year 30. It will not be economically viable if the PV modules are affected by delamination because the payback time increases to 28 years and the value of NPV becomes negative (-4 159 $). After delamination, occurrence of discoloration, snail trails and hot spots have a big impact on the electricity generation, performance parameters and economic exchange.
In scenario 2, the PV module is more affected by snail trails where it contributes to reduction in production to about 67 kWh in year 30 and performance ratio to 22.3 %. Payback time in this case increases to 25 years and the value of NPV ends up at – 50 $ which means that the investment will not be profitable. After snail trails, delamination and hot spots have a big impact on energy output of the PV module, performance parameters and economic exchange. In scenario 3, modules with three bypass diodes perform better compared modules with one and two bypass diodes when one cell stops working in some modules or there is defect in bypass diode. The amount of electricity losses is huge in all three bypass diodes
configuration, especially for PV modules with only one and two bypass diodes. In both cases, the investment will not be profitable because the payback times become longer than the modules lifetime and the values of NPV are negative as well.
UV and IR are two different technologies for detection of defects in PV modules. The UV-experiment was implemented during night and the IR during the day. The measurement was more flexible with IR while that was a limitation in recording with the UV. The UV lamp had a limitation in the flashlight radius, which required a closer range than the IR and could only record almost one cell at a time. The IR- technology was easier to work with, during the right irradiations from the sun, especially for detection of hot spots in PV modules. The UV light highlighted what the eyes could not see in the visible light and detected some defects which could not be seen with the IR technology. But external lights and the weather could easily make the UV application more difficult. UV could detect cracks, snail tracks, snail tracks with microcracks, scratches and maybe beginning to failure in cell such as
delamination/discoloration on the modules. But the UV method could not detect the hot spots. While the IR application on the modules could detect, hot spots, cracks and snail tracks with microcracks during the field application.
CONTENT
1. INTRODUCTION ... 1 1.1. Background ... 1 1.2. Purpose/Aim ... 3 1.3. Research questions ... 3 1.4. Delimitation ... 3 1.5. Disposition ... 4 2. METHOD ... 6 2.1. Literature study ... 6 2.2. Field Application ... 6 2.3. Simulation ... 7 2.4. Interview ... 73. THEORETICAL FRAMEWORK/ LITERATURE STUDY ... 8
3.1. Photovoltaic principle ... 8
3.2. Defects and failures in PV modules ... 9
3.2.1. Infant failures ... 10
3.2.2. Midlife failures ... 11
3.2.3. Wear out failures ... 11
3.3. Common defects and failures ... 12
3.3.1. Cracks ... 14
3.3.1.1. The impact of the cracks on the power performance of PV ... 14
3.3.1.2. Actions for minimizing cracks in PV modules ... 15
3.3.1.3. Clamps ... 15
3.3.2. Snail trails ... 16
3.3.3. Encapsulation discolouring ... 16
3.3.4. Delamination ... 17
3.3.5. Hot spots ... 19
3.3.6. Failure in conductor ribbon and joint ... 20
3.3.7. Degradation ... 20
3.4. UV (Ultra Violet) fluorescence technology... 21
3.4.1. UV-fluorescence imaging ... 21
3.4.2. Relationship between UV -F and defects ... 22
3.5. IR (Infrared) thermography ... 23
3.5.1. Relationship between IR-technology and defects ... 24
4. CURRENT STUDY ... 26
4.1. IR-technology ... 26
4.2. UV-technology ... 27
4.3. Lab set up ... 28
4.4. Field set up ... 31
4.4.1. PV characteristics for Vanhälls ... 32
4.4.2. Examined modules ... 34
4.5. PVsyst simulation tool ... 34
4.5.1. Procedure in PVsyst ... 35
4.5.2. Array constrains ... 36
4.5.3. PV field detailed losses parameter ... 36
4.6. Scenario 1 ... 38 4.6.1. Assumptions scenario 1 ... 39 4.6.1.1. Cracks in PV modules ... 40 4.7. Scenario 2 ... 42 4.7.1. Cracks in scenario 2 ... 42 4.8. Scenario 3 ... 44
4.8.1. Case 1, defect on cell ... 44
4.8.2. Case 2, defect on the bypass diode ... 45
4.9. Theoretical background ... 46
4.9.1. Capacity factor ... 46
4.9.2. Performance ratio ... 46
4.9.3. Efficiency ... 47
4.9.4. Performance losses ... 47
4.9.5. Energy output scenario 1,2 and 3 ... 48
4.9.6. Net present value (NPV) ... 49
4.9.7. Levelized cost of electricity (LCOE)... 51
4.9.8. Payback time ... 52
4.9.9. Internal rate of return (IRR) ... 52
4.9.10. System cost ... 53
4.9.11. Assessment of the economic impact of failures ... 54
5 RESULTS ... 57
5.1. Simulation result from PVsyst ... 57
5.2. Electricity generation and performance parameters for various defects at different stages of the PV Cell's life cycle ... 61
5.2.1. Result from Scenario 1 ... 61
5.2.2. Result from scenario 2 ... 65
5.2.3. Result from scenario 3 ... 68
5.2.3.1. Case 1, cell ... 68
5.2.3.2. Case 2, diode ... 70
5.3. Economical affected for various defects at different stages of the PV Cell's life cycle ... 72
5.3.1. Economic analysis, scenario 1 ... 72
5.3.2. Economic analysis, scenario 2 ... 74
5.3.3. Economic analysis, scenario 3 ... 76
5.4. Experimental result from the lab ... 77
5.4.1. Testing of UV-equipment in the laboratory ... 77
5.5. Field application in Dalarna ... 80
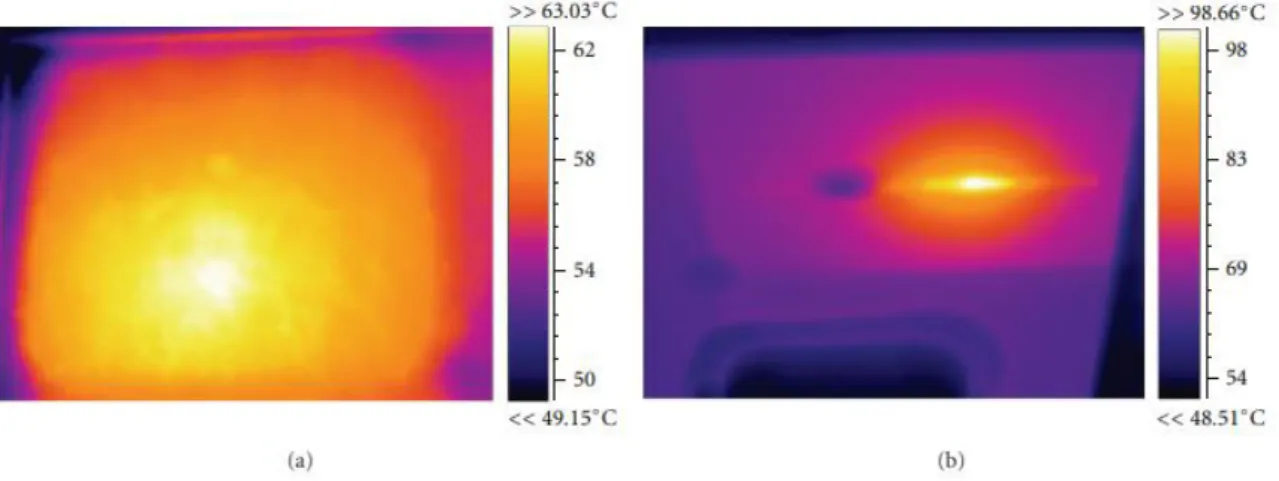
5.5.1. IR-technology application ... 81
5.5.2. UV-technology application ... 85
6 DISCUSSION ... 90
6.1. Defects in PV modules ... 90
6.2. Assumptions during simulations ... 91
6.3. Calculations ... 91
6.4. UV and IR application ... 93
6.5.1. Hypothesis about snail tracks and delamination ... 94
6.6. Cracks and hot spot in the examined modules... 95
6.7. Errors during recordings ... 95
7 CONCLUSIONS ... 97
7.1. Occurrence of defects and actions for minimizing ... 97
7.2. Production, performance parameters and economic exchange ... 97
7.3. The differences between UV and IR techniques ... 98
7.4. The impact of external factors on the result of the experiment ... 99
8 SUGGESTIONS FOR FURTHER WORK ... 99
REFERENCES ... 100
APPENDIX 1 EQUATIONS APPENDIX 2 FIGURES
APPENDIX 3 MODEL IN PVSYST APPENDIX 4 INTERVIEW
LIST OF FIGURES
Figure 1 typical I-V curve for PV cell (Köntges, et al., 2014) permission from IEA PVPS
(International Energy Agency Photovoltaic Power Systems Programme) ... 9
Figure 2 typical failures (Köntges, et al., 2014) permission from IEA PVPS (International Energy Agency Photovoltaic Power Systems Programme) ... 10
Figure 3 infant failures (Köntges, et al., 2014) permission from IEA PVPS (International Energy Agency Photovoltaic Power Systems Programme), originally from IEA but with modifications... 10
Figure 4 midlife failures (Köntges, et al., 2014) permission from IEA PVPS (International Energy Agency Photovoltaic Power Systems Programme), originally from IEA but with modifications... 11
Figure 5 distribution of failures (Köntges, et al., 2014) permission from IEA PVPS (International Energy Agency Photovoltaic Power Systems Programme) ... 12
Figure 6 Summary of PV module IR image patterns observed in outdoor measurements, their description, possible failure modes and its influence on the electrical output (Köntges, et al., 2014) permission from IEA PVPS (International Energy Agency Photovoltaic Programme, originally from IEA but with modifications ... 13
Figure 7 glass breakage (Köntges, et al., 2014) permission from IEA PVPS (International Energy Agency Photovoltaic Power Systems Programme) ... 15
Figure 8 some types of defects in PV (Köntges, et al., 2014) permission from IEA PVPS (International Energy Agency Photovoltaic Power Systems Programme), originally from IEA but with modifications ... 18
Figure 9 failures detected by UV (Köntges, et al., 2014) permission from IEA PVPS (International Energy Agency Photovoltaic Power Systems Programme) originally from IEA but with modifications ... 22
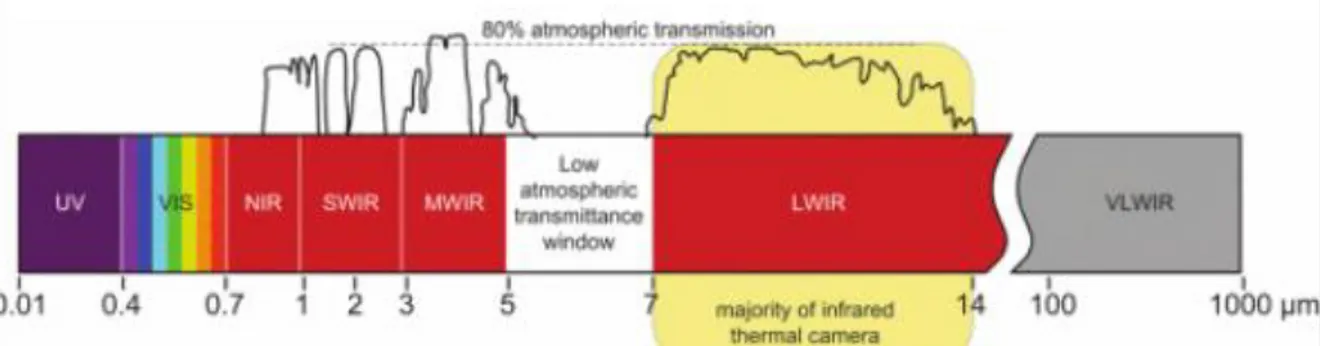
Figure 10 The infrared bands in the electromagnetic spectrum (Glavaš, Vukobratović, Primorac, & Muštran, 2017) with permission from Hrvoje Glavaš. ... 23
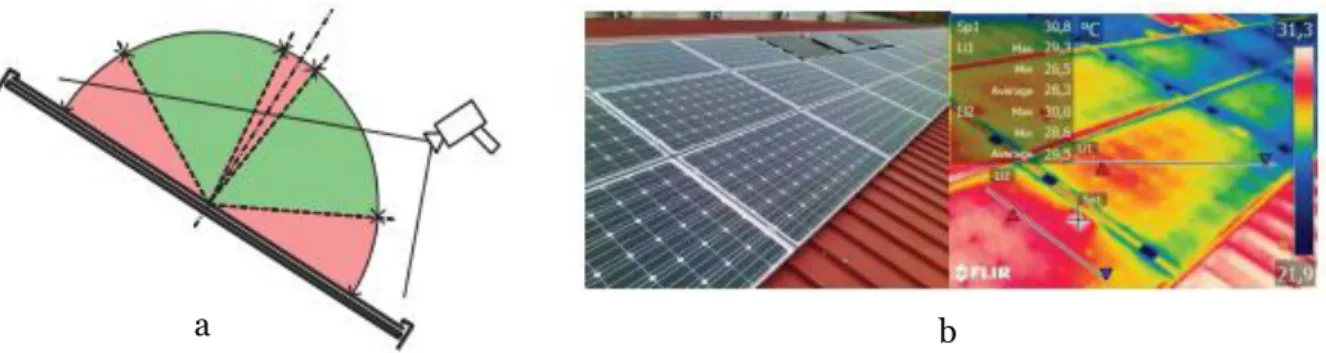
Figure 11 Preferable angle for taking readings (a) and The influence of the angle of reading at the apparent temperature (b) (Glavaš, Vukobratović, Primorac, & Muštran, 2017) with permission from Hrvoje Glavaš. ... 24
Figure 12 IR image (a) front and (b) back, of the cell (Kaplani, 2012) from Eleni Kaplani, licensed under CC BY 3.0 ... 25
Figure 13 IR-camera equipment ... 27
Figure 14 Equipment UV ... 28
Figure 15 Examined modules at MDH ... 29
Figure 16 experimental set up ... 30
Figure 17 PV plant at Vanhälls ... 31
Figure 18 examined modules ... 34
Figure 19 energy injected to grid ... 57
Figure 20 production and efficiency ... 58
Figure 21 PV Array behaviour for each loss effect (a), Energy injected into grid with losses (b) ... 59
Figure 22 capacity factor and performance ratio ... 60
Figure 24 impact on efficiency ... 62
Figure 25 poison factor ... 63
Figure 26 performance ratio ... 63
Figure 27 capacity factor ... 64
Figure 28 impact of defects on energy output, S2 ... 65
Figure 29 impact on efficiency, S2 ... 66
Figure 30 poison factor, S 2 ... 66
Figure 31 performance ratio and capacity factor, S2 ... 67
Figure 32 energy output, s3 case 1 ... 68
Figure 33 efficiency and poison factor ... 69
Figure 34 performance ratio and capacity factor S2 ... 69
Figure 35 efficiency and poison factor, S3 case2 ... 70
Figure 36 energy output, S3 case 2 ... 71
Figure 37 performance ratio and capacity factor, S3 case 2 ... 71
Figure 38 cash flow considering C-down ... 73
Figure 39 cash flow considering C-down s2... 75
Figure 40 Visible inspection of CNBM-230P with hidden defect ...77
Figure 41 UV-fluorescence inspection of CNBM-230P(a), (b) ... 78
Figure 42 UV-fluorescence inspection of thin film ... 79
Figure 43 UV-fluorescence inspection of SY-M20W, visible image (a), UV light (b)... 79
Figure 44 Diagonal scratch seen as (a), snail trail (b), bird fece and dust shading (c) and vertical (d) ... 80
Figure 45 IR image: Some modules from array A ... 81
Figure 46 IR image: Module A7, front (a), backside (b ... 81
Figure 47 IR image: Module A4 (a) and module A5 (b)... 82
Figure 48 IR image: Module A16, Automatic adjustment(a), Manual adjustment(b). ... 82
Figure 49 IR image: Module B8, front (a), backside (b) ... 83
Figure 50 IR image: Module B17, front Automatic adjustment(a), backside Automatic adjustment(b), front Manual adjustment (c), module B17 and B34 (d) ... 84
Figure 51 UV-fluorescence inspection of Module B17 ... 85
Figure 52 UV-fluorescence inspection of Snail track1 in Module A4 ... 86
Figure 53 UV-fluorescence inspection of Snail track2 in Module A4 ... 87
Figure 54 UV-fluorescence inspection of Module A5 ... 88
Figure 55 UV-fluorescence inspection of Snail track6 Module A5 ... 89
Figure 57 specific energy ... 3
Figure 58 electricity loss due to different defects ... 4
Figure 59 electricity loss due to the different defects ... 4
Figure 60 electricity loss, s3 case 1... 5
LIST OF TABLES
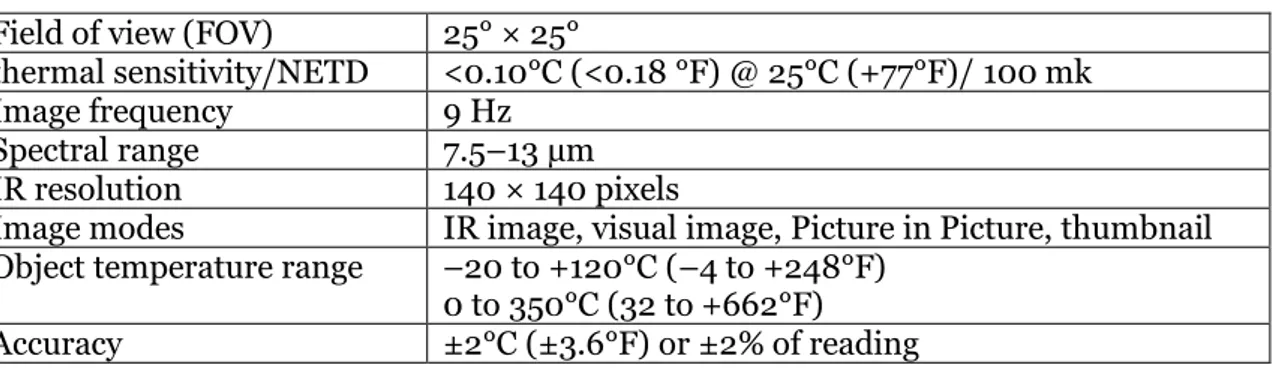
Table 1 characteristics of camera ... 26
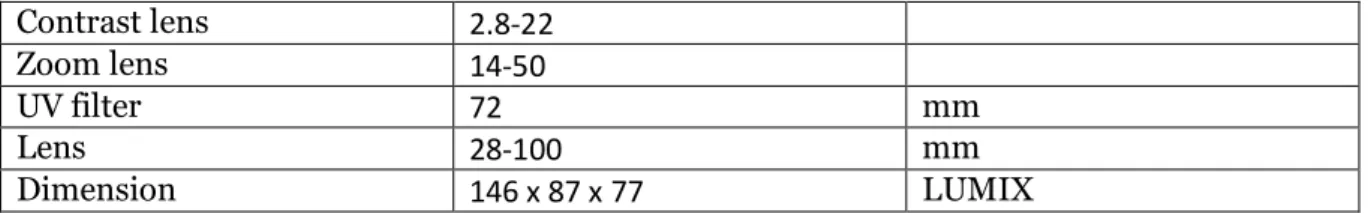
Table 2 charasteristic of system camera ... 27
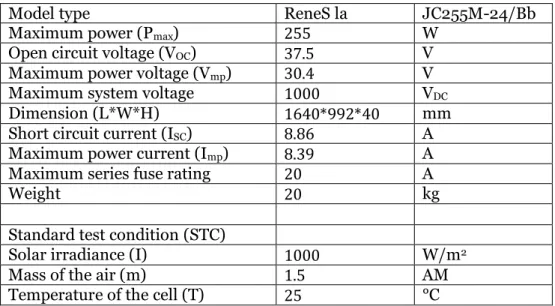
Table 3 module characteristics... 29
Table 4 PV-module characteristics at Vanhälls ... 32
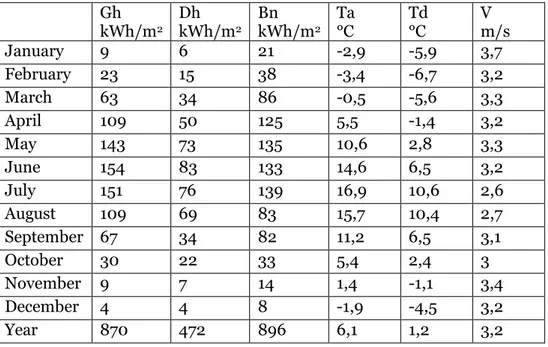
Table 5 Statistical climate data for proposed location, received from Metenorm at location Lat:60.12 and Lon: 15.47 ... 33
Table 6 Module properties ... 35
Table 7 Inverter properties... 35
Table 8 Construction of the array ... 35
Table 9 PV field detailed losses parameter ... 37
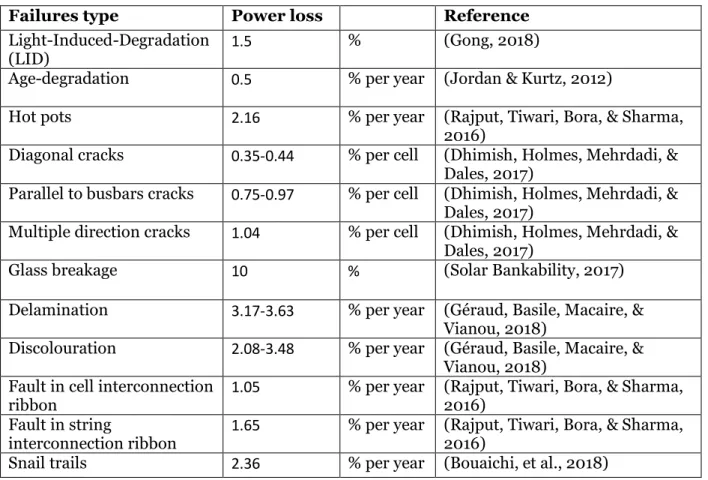
Table 10 different type of failures ... 38
Table 11 konsiderations in scenario 1 ... 40
Table 12 considerations of cracks in scenario 1...41
Table 13 konsiderations in scenario 2 ... 43
Table 14 considerations of defect in cells ... 44
Table 15 considerations of defect in bypass diode ... 45
Table 16 Cost of components ... 53
Table 17 total cost ... 53
Table 18 down time cost, fix cost and CPN, scenario 1 ... 72
Table 19 economic analysis considering down time cost, scenario 1 ... 73
Table 20 downtime cost, fix cost and CPN, s2 ... 74
Table 21 economic analysis considering downtime costs, s2 ... 74
Table 22 downtime cost, fix cost and CPN, s3 ... 76
Table 23 economic analysis considering downtime cost, s3 ... 76
NOMENCLATURE
Symbol Description Unit
A Area m2
ADE grid Average daily energy injected to the grid kWh
AHE grid Average hourly energy injected to the grid kWh
BA Total Revenues $
C Cost $
CF Capacity factor %
CRF Capital recovery factor %
D Power loss %
E Energy kWh
EGC SI Effective global corrected solar irradiance KWh/m2, year
FF Fill factor %
I Current A
i Discount rate %
K insurance Annual insurance rate %
L Missing income due to production losses $
n Life time of the project year
OCPN Percentage reduction of performance averaged over
the entire portfolio over 1 year %
P Power W
PR Performance ratio %
PSC Installed capacity of the PV system kWp
PL Performance loss, power loss %
PPA Missing income from power purchasing agreements $ Rt Net cash inflow-outflows during a single period t $
RCE Missing savings generated by PV plants $
SCPN Total production of PV plant in absence of failures kWh
t Time h
V Voltage V
Y Yield kWh
ƞ Efficiency %
ABBREVIATIONS
Abbreviation Description
AC Alternating Current
CEO Chief Executive Officer
CPN Cost Priority Number
C-Si Crystalline silicon
DC Direct Current
EVA Ethylene vinyl acetate
EL Electroluminescence
IRR Internal Rate of Return
IR Infrared
IEA International Energy Agency
J-box Junction box
kWh Kilo Watt hour
LCOE Levelized Cost Of Energy
MM Multimeter Measurment
MWh Mega Watt hour
NPV Net Present Value
O&M Operation & Maintenance PID Potential induced degradation
PV Photovoltaic
PVPS Photovoltaic Power Systems
PB Pay Back time
STC Standard Test Condition
SEK Swedish Krona
Si Silicon
DEFINITIONS
Definition Description
Bypass diode A standard addition in a PV module where it reduces the occurrence of hot spots by letting current go through the influenced cells and decreasing the voltage losses.
Capacity factor The relationship that is between the annual electricity generation and the theoretical maximum annual electricity generation.
Efficiency Indicates how much of the obtainable solar energy is converted to electricity by the PV cells.
Fill factor The relationship that is between the maximum obtainable PV cell's power
to the product of open circuit voltage and short circuit current.
Performance ratio A parameter for evaluating the efficiency of a plant, the relationship that is between the actual and theoretical electricity production.
PVsyst A simulation program for studying, sizing and data analysing of PV system. Poor maintenance Insufficient or not cleaning of PV module, control of the PV components,
vegetation management, removal of snow or sand etc.
1.
INTRODUCTION
Tsanakas, et al. (2013) point out that Photovoltaics (PV) modules are the most important part of a PV system and the payback time and life cycle cost depends on most of the original power, power dissipation and module life. Furthermore, Tsanakas, et al. (2013) mention that, it is of the utmost importance to ensure operational reliability and quality in order to obtain profitability and ensure the investment after their guaranteed lifetime of about 25 years (Tsanakas, et al., 2013).
Jacobsson & Edberg (2016) describes that visible defects such as cracks can be seen with the naked eye while microcracks and damage to the silicon material can only be seen through special lighting (Jacobsson & Edberg, 2016). Hence, this project consists of a theoretical and practical operation of defects in PV modules. Where two different methods (UV fluorescence and thermography) are compared and applied to characterize defects during field work and simulate how different defects at different stages of the PV cell's life cycle affect the electricity production and the economic exchange.
1.1.
Background
Solar power system, also called PV system was already used in 1950 in astronomy to supply satellites with power and during the 60s and 70s, PV was already a competitive alternative especially in remote locations, according to Energimyndigheten (2013). After a study from the Norwegian research institute SINTEF, NyTeknik (2018) writes that the Nordic climate is ideal for PV installation. From the very first day, it is financially profitable to invest in solar-generated electricity, provided you consume it yourself, according to NyTeknik. In recent years, the development of PV systems has been increased noticeably, and PV still represents one of the attractive technologies that have a big role in renewable energy systems. The wide-spread apply of PV can help to decrease the greenhouse gas emissions and to get the EU target which is using of 20 % of renewable energies until 2020. PV was applied for small applications 30 years ago and today is a common electricity source where global capacity in 2016 has increased to 303 GW and continues to increase (Masson & Kaizuka, 2017).
However, there are still some obstacles that make the PV system's role in the global market not as strengthened as it would be. The obstacles don’t allow that PV technology develop in a high level that can facilitate the achievement of the local and global sustainable goals (Solar Power Europe, 2017). There has been tremendous pressure on the PV industry to decrease production costs due to high competition in the PV market during the past decade. In addition, there is a lot of demand for the modules' reliability, long-term performance, durability and efficiency to be improved (Eder, et al., 2018).
PV are usually designed to have a lifetime of about 25 years but different types of external pressure such as temperature, humidity, UV irradiation, rain, snow, hail, wind, sand etc can lead to degradation of the PV modules protective material and contribute to the different types of failures. Occurrence of different types of failures in PV modules lead to reduction of power performance of PV modules before meeting the manufacturer's guaranty (Omazic, et al., 2019). Furthermore, in the late of 1990s, the production of the PV module increased by about 15-25% per year contributing to decrease of PV modules prices (Khelifi, 2010). The price fall can lead to consequences such as the use of materials that are cheap or poor installation methods. In addition, some PV systems that have been installed in recent years, for example in Germany, give lower yield than expected (Mühleisena, et al., 2019). According to a study carried out by TUV Rheinland (2015), it has been found that approximately 30% of their PV system that has been examined shows defects where approximately 50% of the defects have been because of the errors in installation (TUVRheinland, 2015). In Saudi Arabia (Dhahran), the PV modules that was installed for 6 months in the field showed 50 % power drop when no cleaning was conducted on PV modules. In United Arab Emirates, a power drop of 10 % was shown after that the PV modules were installed for 5 weeks in the field. In Qatar the power drop for installed PV modules was 10 % after 100 days in the field (Walwil, Mukhaimer, Fahad, & Said, 2017).
For a PV plant it is of fundamental importance that the system can operate without any defects. To ensure efficient energy production, long life and high return on investment, it is important to detect the defects early. In order to evaluate the performance of a PV plant, it is important to develop fast and reliable methods to evaluate the performance of the PV
modules. Defects in the PV modules can occur during production, during transport or installation or can be developed through degradation during operation. There are many techniques for detecting the defect in the PV modules, such as visual inspection (VIS), thermography using infrared radiation (IR), electroluminescence (EL), Multimeter measurement (MM) and current voltage characteristics (Eder, et al., 2018).
The temperature is an indicator that detects errors in the electromechanical installation and the IR technology is one of the more useful methods to use in analysing distributions of this parameter, which is added to industrial and commercial environments. King, Kratochvil, Quintana and McMahon (2002) describes that all materials emit infrared radiation, the temperature distribution at the surface gives an idea about the internal structure and properties of the object and inhomogeneity or defects in the object will show abnormal surface temperature. The IR method can be applied without having to disconnect the system but requires to be performed during the day. A completely new technique for characterizing the PV modules is to use UV fluorescence imaging to detect artefacts in the modules. Since the technology is new, there is no standard concerning how to perform and evaluate UV image processing. The UV-fluorescens method can also be performed without having to disconnect the system but requires a dark environment for the measurements. Fluorescence only happens while UV radiation is present, Voronko, et al., (2017) describes it as a form of luminescence and stands for the physical effect of the emission of light by a material that has absorbed light or other electromagnetic radiation.
Different defects can lead to early degradation in PV modules. Focusing on evaluation of different types of problems on the PV modules and their economic impact, can help develop theories and as well potentially informing future research of the impact of different defects during a PV cell's life cycle. To gain a fuller understanding of the IR and UV accuracy and uncertainty factors, qualitative research with field experiment is required. Addressing this problem will have practical benefits for the inspiration and future development of the UV application
1.2.
Purpose/Aim
The aim of the thesis is to evaluate different types of PV defects, reasons as well as
multidimensional effects. By simulating how different defects at different stages of the PV cell's life cycle affect electricity production, performance parameters and economic exchange. Further, compare the infrared (IR) technology with the new ultraviolet (UV) fluorescence technique for PV characterization, based on their accuracy and uncertainty factors under an experimental field investigation.
1.3.
Research questions
• Which are the reasons, mechanisms and effects of the different defects in PV modules and how can they be rectified?
• How is electricity generation, performance parameters and economic exchange affected by various defects at different stages of the PV module's life cycle?
• What differentiates the UV and IR techniques and how are these applied in practice? • What external factors from the environment can affect the result of the experiment?
1.4.
Delimitation
The work is only based on studies of the two different techniques IR and UV for artefacts and apply them in practice. A visible inspection is done before the other two methods, the visible inspection is excluded from the literature study. Because knowing how to make a synopsis of the modules is nothing complicated that needs to be explained in detail. The experiment will be performed on a PV plant at the company Vanhälls Såg AB located in southern Dalarna. Before the field applications the equipment will be tested on three PV modules in the laboratory at MDH. Mainly reason is because of the snow and to ensure that the equipment works. Equipment selection was mainly due to access to the existing equipment and the equipment through the purchase was within reasonable limits. Only the most common defects that occur on the PV modules in the resent years is included in the work, such as:
• Encapsulant delamination • Encapsulant discolouration
• Hot spots • Snail trails • Cracks
• Fault in cell and interconnection ribbon • Light induced degradation
• Age degradation
Calculations will also be performed on these mentioned defects. Contributions, subsidization, certificates and root deductions are neglected within the financial calculation. Since the work concentrates on economic exchange due to defects in different stages.
1.5.
Disposition
In the introductory chapter, the study's background, problem discussion, issues, purpose and delimitation were presented. The study's continued disposition looks like this:
Method
The method chapter presents the methods for the study. How to perform the study and what tools were used for the research.
Theoretical framework/literature study
The theoretical framework presents the theoretical studies which the study is based on. The chapter presents previous research on different kinds of defects, ultraviolet
fluorescence imaging and thermography for photovoltaic applications.
Results
The results chapter presents the empirical results of the study. The chapter presents the IR and UV application on modules. Three different scenarios with different defects at different stages of the PV cell's life cycle and the how the electricity production and
economic exchange get affected.
Discussion
The chapter discusses the study's results in relation to previous work. Assumption during simulations, defects in PV modules, calculations, UV and IR differences. It also discusses
about error occurred during the experiment.
Conclusions
The final chapter presents the study's conclusions. Furthermore, the limitations of the study are also described, which later leads into suggestions for further work.
Current study
The current study presents the research philosophy and research approach that formed the basis for the study. The chapter also describes the study's empirical method,
2.
METHOD
The work is based on literature study, experiments, calculations and an interview.
2.1.
Literature study
The literature study consists of studies on the UV and IR technology for PV applications and studies on the different kinds of defects in PV modules, their mechanism, cause and effects. The literature study is also covered how different defects affect the performance of PV
modules. Databases such as Diva, IEEE Xplore, ScienceDirect, Academic Search Elite, Scopus and other relevant websites are applied.
The key words from the different sources during the study of UV and IR; application of UV-Fluorescence in PV system, UV-UV-Fluorescence for detecting of PV module failures, PV plant monitoring, PV thermography, PV thermography image, PV thermography measurement and application IR PV system.
Regarding to the keywords for defects in PV modules; PV defect, Solar PV module faults, microscope defects PV, degradation photovoltaic module, defect on PV cell, defect and PV module performance and power output, cracks in PV cells, hot spots in PV cells,
delamination, discolouration, snail tracks and corrosion in PV cells.
The other key words are;Techno-economic analysis of PV, electricity prise and the price for PV components.
2.2.
Field Application
Suitable equipment for outdoor IR and UV imaging was obtained for the examination of outdoor experiments with IR and UV imaging. Main equipment consisted of tripod, system camera, UV-filter, UV lamp, radiation measurement and an IR camera, depending on the experimentation. The equipment for both UV and IR was tested in the laboratory at MDH before the real experiment on the field. The testing in the laboratory was more like an
introduction how to handle the equipment practically from the framework. The testing in the laboratory was done while there was snow on the modules in Dalarna. From the middle of April, the field experiment was implemented during several days, different times at morning and night.
2.3.
Simulation
A standard model was constructed in the simulation program PVsyst. PVsyst is a personal computer software simulation program for architects, engineers and researchers. For the study, sizing and data analysis for complete PV systems. This program was chosen mainly because the program is very effective and is specifically targeted at solar cells. In addition, the program contains several databases for example PV components and meteorological data. After the simulation in PVsyst, the data was exported and compiled into Microsoft Excel. Subsequently, Microsoft Excel was used for three scenarios for calculations of energy output, performance parameters and the economic exchange. The methods used to evaluate the economic part were Levelized Cost of Electricity (LCOC), Net Present Value (NPV), Internal Rate of Return (IRR) and Pay Back time (PB).
The three scenarios are;
1. Occurrence of different defects in some PV modules during different years 2. Occurrence of different defects in only one PV module
3. Occurrence of defect in the bypass diode and a non-functioning cell in some PV modules
The reason for the study of the first scenario was to evaluate how much the whole PV plant would be affected in the long term if different kinds of defects appear in some PV modules, from an economic, performance and production perspective. The reason for studying of only one PV module in scenario two was to perform a deeper study of different defects and to evaluate what defect has the highest impact on the PV module. According to Stridh (2019), defect in bypass diodes and non-functioning cells contribute to losing one third of modules power in a standard PV module consisting of 3 bypass diodes. Losing one-third of the module's power is a lot so they are serious defects and therefore scenario 3 has been chosen to study how the entire PV plant would be affected if these kinds of defect occur in PV modules.
2.4.
Interview
An interview with chief executive officer (CEO) for Vanhälls Såg AB was performed to become more familiar with the selected PV system and collect information about the facility, the characteristics of PV modules, energy production, angle placement, when and from where the PV modules was purchased.
3.
THEORETICAL FRAMEWORK/ LITERATURE STUDY
The literature study will cover the principle of solar cells and studies on the UV and IR technology for PV applications. Furthermore, it will be some studies about the common defects in PV modules, the impacts of the defects on the performance of the PV modules and how they can be rectified.
3.1.
Photovoltaic principle
A photovoltaic cell is the basic component of a PV system and is a kind of energy harvesting technology where it converts the energy of the solar (light) to the electricity (voltage) via the photovoltaic effect (Saavedra, 2016). A PV cell consists of different layers of material which have different purposes. Semiconductor is the most significant layer of a photovoltaic cell where it is consists of 2 layers which are p-type and n-type and converting the light to electricity. There is a layer of conducting material in each side of the semiconductor for accumulating of the produced electricity. The other layer is a sort of anti-reflection coating to prevent the losses of light because of the reflection (Saavedra, 2016). The amount of energy generated by PV cells are limited and therefore many individual PV cells are connected in series or parallel in structure called module to generate higher voltage and current and therefore more electricity to meet the demand. A PV system or PV array consists of several modules that are connected to each other. The produced electricity by a single module is not enough to meet the demand specially in commercial approach so the modules can be
connected in series to increase the voltage or parallel to increase the current (Khelifi, 2010). Sunlight consists of particles named photon which are radiated from the sun. When these photons hit the surface of the PV cell, it is absorbed by the semiconductor material which is usually silicon. The electron in the semiconducting material are knocked loose by the energy of the light. The layers of the semiconducting material make an electric field which means that one side consists of net positive charge and the other side is comprised of net negative charge. Electrons are loosed by the electric field, starting to flow in the PV cell and
contributing to an electrical current. Finally, when free electrons create to an electrical current, the electrons are accumulated by the metal conductive plates on the sides of each PV cell and transferred to the wires. The electrons are flowing such as electricity in the wiring to an inverter. (Narkhede, 2010)
The main performance parameters of a PV cell are short circuit current (ISC), open circuit
voltage (VOC), efficiency (ƞ) and fill factor (FF). Short circuit current is the maximum current
that is delivered by a cell and is the current when the voltage is zero. Open circuit voltage is the maximum voltage that is delivered by a cell when the current is zero. Fill factor is the ratio of the maximum power that is achieved from solar cells under normal operating
condition to the product of open circuit voltage and short circuit current. By the fill factor the quality of the PV module can be showed if the fill factor closer to 1 shows a PV module that can contribute to more power. The typical value of the FF is 0.7-0.8. Efficiency is the
relationship that is between the output energy by the PV cells and the incident energy in the form of sunlight (Alternative Energy Tutorials, 2018). Figure 1 shows the I-V
(current-voltage) characteristics for a typical silicon PV cell and the most significant parameters: short circuit current (ISC), open circuit voltage (VOC), maximum power point (Pmpp), current at
maximum power point (Impp) and voltage at maximum power point (Vmp).
Figure 1 typical I-V curve for PV cell (Köntges, et al., 2014) permission from IEA PVPS (International Energy Agency Photovoltaic Power Systems Programme)
3.2.
Defects and failures in PV modules
A failure that occur in the PV modules can be defined as an impact that change the module power and contribute to the power loss or safety problem (Köntges, et al., 2014). In other words, failures can be in the form of performance related failures or it can be in the form of safety related failures. Injury to the components and personnel can be the consequences of the safety related failures and power loss is the consequence of the performance related failures (ee Publisher, 2018). The failures in PV modules can be divided into three categories which are infant, midlife as well as wear-out failures (Köntges, et al., 2014).
Figure 2 shows three common failures that occur for crystalline PV modules. Various defects occur depending on which phase the module is in, infant-failure, midlife-failure or wear-out-failure. LID in the figure stands for light-induced degradation, PID stands for potential induced degradation, EVA - ethylene vinyl acetate and j-box – junction box.
Figure 2 typical failures (Köntges, et al., 2014) permission from IEA PVPS (International Energy Agency Photovoltaic Power Systems Programme)
3.2.1. Infant failures
Infant-failures happens at the start of PV module's working life where loose frame, glass
breakage, failures in J-box, cell- interconnection and delamination are the most significant failures for PV modules in the field. In this phase transportation damages contribute to 5 % of all failures. (Köntges, et al., 2014)
How occurrence of failures has been distributed at the beginning of the PV module's working
life according to the customer complaints are showed in Figure 3. The complaints have occurred two years after transfer of PV modules. This statistic in Figure 3 has been performed by a German distributor, which has delivered the PV modules from 2006 to 2010 and to a total volume of approximately 2 million delivered PV modules. (Köntges, et al., 2014)
Figure 3 infant failures (Köntges, et al., 2014) permission from IEA PVPS (International Energy Agency Photovoltaic Power Systems Programme), originally from IEA but with modifications
Optical failure 20%
Power loss 19%
J-box and cables 19% Glass breakage 10% Defect cell interconnected 10% loose frame 6% Transport damage 5% Delamination 5% Unknown defect 6%
3.2.2. Midlife failures
Midlife-failures might be PID (potential induced degradation), failures in diode, cell interconnected breakage and degradation in glass (Köntges, et al., 2014).
Figure 4 shows how failures have been distributed for different PV system (for 21
manufactures) that has been installed in the field for 8 years according to a study of DeGraff Lacerda and Campeau (2011). The distribution is according to the total number of failures. It has been estimated that about 2 % of PV modules do not fulfil the manufacture's guarantee
and that is 11- 12 years after that PV module have been in operation. According to this study, failures due to the glass breakage as well as interconnections defects dominate compared to the other midlife-failures. (DeGraaff, Lacerda, & Campeau, 2011)
Figure 4 midlife failures (Köntges, et al., 2014) permission from IEA PVPS (International Energy Agency Photovoltaic Power Systems Programme), originally from IEA but with modifications
3.2.3. Wear out failures
Wear out failures is most common failure that occurs in the most PV modules and it is when the working life of PV modules is at the end. When a security problem occurs in a PV-module or when the power of a PV-module falls under 70- 80 % of the initial power, then the working life of the PV-module is finished. (Köntges, et al., 2014)
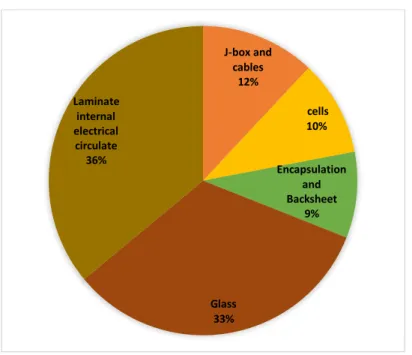
Figure 5 shows the distribution of failures which have occurred for 272 PV modules that has been installed in the field for 15 years, from three various manufactures. As shown,
delamination, cell part isolation because of the cell cracks as well as discolouring of the laminate are predominant failures in the PV modules where they contribute to about 0-20 %
J-box and cables 12% cells 10% Encapsulation and Backsheet 9% Glass 33% Laminate internal electrical circulate 36%
drop in power. The red colour shows how much of PV modules having failure and the green colours shows the opposite. (Köntges, et al., 2014)
Figure 5 distribution of failures (Köntges, et al., 2014) permission from IEA PVPS (International Energy Agency Photovoltaic Power Systems Programme)
3.3.
Common defects and failures
In this section, the most common and important defects, their causes, effects and mechanisms in the PV modules are presented.
The Figure 6 presents different defects and overall decryption of defects, which can be seen with various technologies, like thermography. It presents the description how to acknowledge it and what could be the cause of the defect. (Köntges, et al., 2014)
Pattern Description Possible failure
reason Electrical measurements Remarks, Chapter
One module warmer than others Module is open circulated – not connected to the system Module normally
fully functional Check wiring
One roe (substring) is warmer than other rows in module Short circuited (SC) or open substring -bypass diode SC, or -internal SC Sub-strings power lost, reduction of Voc
May have burned spot at the module
One diode shunted
Single cells are warmer, not ant pattern (patchwork pattern) is recognized Whole module is short circuited -All bypass diodes SC or -wrong connection Module power drastically reduced, (almost zero) strong reduction of Voc Check wiring all diodes shunted
Single cells are warmer, lower parts and closer to frame hotter than upper and middle parts. Massive shunts caused by potential induced degradation (PID) and/or polarization
Module power and FF reduced. Low light performance more affected than at STC - Change array grounding conditions - recovery by reverse voltage (PID) One cell clearly warmer than the others Shadowing effects - Defect cell - Delaminated cell Power decrease not necessarily permanent, e.g. shadowing leaf or lichen Visual inspection needed, cleaning (cell mismatch) or shunted cell
(delam.) Part of cell is
warmer - Broken cell - Disconnected string
interconnect
Drastic power reduction, FF reduction
(cell cracks) (burn marks)
(interconnects)
Pointed
heating - Artifact - Partly shadowed, e.g. bird dropping, lightning protection rod Power reduction, dependent on form and size of the cracked part
Crack detection after detailed visual inspection of the cell possible (cell cracks) Sub-string part remarkably hotter than others when equally shaded Sub-string with missing or open circuit bypass diode
Massive Isc and power reduction when part of this sub-string is shaded
May cause severe fire hazard when hot spot is in this sub-string
Figure 6 Summary of PV module IR image patterns observed in outdoor measurements, their description, possible failure modes and its influence on the electrical output (Köntges, et al., 2014) permission from IEA PVPS (International Energy Agency Photovoltaic Programme, originally from IEA but with modifications
3.3.1. Cracks
Cracks in the cells may occur in different steps and during the different times of the module’s lifetime. Manufacturing is an important factor for cell cracking where e.g. soldering process lead to a high pressure on the PV cells. Handling and vibration during the transport from factory is another factor that can contribute to the cracks or expands cracks in PV modules. Natural factors such as weather conditions like heavy wind and snow loads also contribute to mechanical loads on PV modules in the field due to the vibrations and pressure that they perform and thereby create cracks on the surface of the PV modules (Kajari, Kunze, & Köntges, 2012). The wafer’s size of the crystalline has increased in recent years and on the other hand the thickness has been decreased which can increase the risk of breakage and cracking (ee Publisher, 2018). The cells parts of the PV module can be disconnected if cracks occur in the PV modules where it can contribute to the power drop in PV modules (Dhimish, Holmes, Mehrdadi, & Dales, 2017). A study performed by Käsewieter, Haase, Larrodé, and Köntges (2014), showed that cracks that occur in the silicon wafer material of PV cells
contribute to 0- 2.5 % power drop in a standard PV module consisting of 60 cells if the cracks don’t separate cell parts. According to another study performed by the same authors, showed that of 250 PV modules that have been in the field for 15 year and more, a lot of insulated parts caused by cell cracks appeared in PV cells. These cracks together with Ethylene Vinyl Acetate (EVA) discolouration and delamination contribute a power drop of approximately 20 % (Käsewieter, Haase, Larrodé, & Köntges, 2014).
Cracks in PV modules can be divided into four different categories which are diagonal cracks, perpendicular to busbars crack, parallel to busbars cracks as well as multiple directions cracks. Diagonal and multiple directions cracks lead to a significant power loss compared to the other kind of cracks (Dhimish, Holmes, Mehrdadi, & Dales, 2017). According to a study performed by Kajari, Kunze, & Köntges (2012) showed that in 27 PV modules consisting of 60 cells each, 667 cracked cells identified. In this study, about 50 % of the cracks detected as parallel to the busbar cracks and the risk for a separating cell parts estimated to be about 16- 25 %. The crack can grow over time which means that if there is crack in one cell during the operation of PV module, the risk can be increased that this crack is grown into longer and broader cracks (ee Publisher, 2018).
3.3.1.1.
The impact of the cracks on the power performance of PV
In a statistical analysis performed by Dhimish,Violeta, Holmes, Mehrdadi, & Dales (2017) different testes are used to identify the influence of the crack on the power performance of two different PV system located at University of Huddersfield (comprising of 10
polycrystalline PV modules) and United Kingdom (comprising of 35 modules). The result from the statistical study demonstrated that about 15.6 % of the modules do not have cracks and 84.5 % of the modules had at least 1 kind of crack: diagonal cracks (26.7 %), multiple direction crack (28.9 %), parallel to busbars (20%) and perpendicular to busbar (8.9 %). This statistical approach showed that diagonal crack contributes to a power loss of 0.35- 0.44 % influenced one cell of PV. The power reduction due to the parallel to the busbar cracks that impact 1 cell is 0.75 %-0.97 %. The maximum power loss for 8 busbars that influence 1- 4 PV
cells is between 4.1 and 4.6 %. Multiple direction cracks that impacted 5 PV cells contribute to a power loss up to 8.42 % and regarding to one cell the value of the power reduction is 1.04 % (Dhimish, Holmes, Mehrdadi, & Dales, 2017).
3.3.1.2.
Actions for minimizing cracks in PV modules
As mechanical and thermal stress are two important reasons behind the micro-cracks, it is significant that manufactures perform some laboratory tests on PV modules such as testing the PV modules during different mechanical loads, thermal cycles, shaking and humidities. Performing these tests can help manufactures to deliver a high reliability PV module that can withstand different kind of pressure. Improvement of the production processes can also help to reduce cracks in the PV modules. If the packages of the products are redesigned by more protection and padding, vibration during transport can be reduced. This in turn lead to mitigation of micro cracks in PV modules. Using better equipment such as automated soldering and increasing the knowledge of the staff, the microcracks during the production can reduce. Using methods such as Electroluminescence (EL) for detection of defects in PV modules in the production line before they leave the manufacture is other method that can be helpful (Winaico, 2016).
3.3.1.3.
Clamps
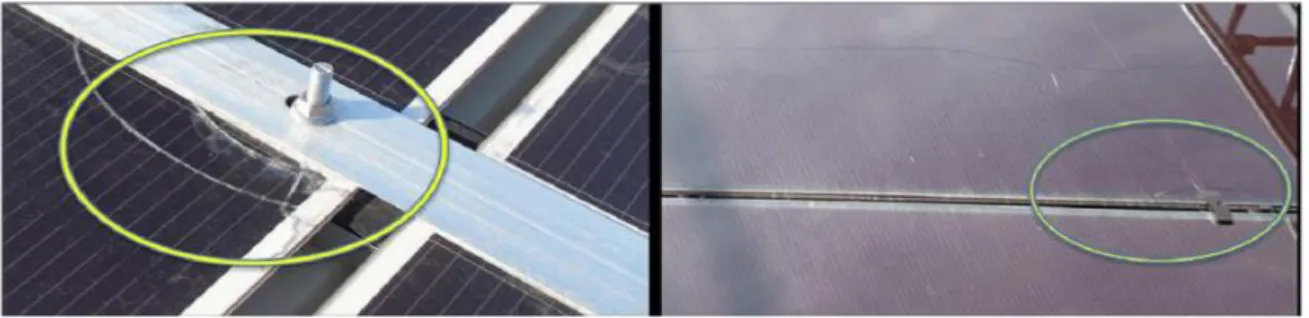
“Clamps” is the one of the common reasons behind the glass breakage of the frameless PV modules that are in the field. One of the important reasons behind this kind of failure is at the planning and installation phase where the module has a poor clamp geometry such as very sharp edges or clamp that are very short or small. The second important reason that contribute to the glass breakage is due to the too tight screws in the mounting stage or clamps are positioned in the wrong way. The performance of the of the PV modules drop in time if there are glass breakage in the PV modules and that is because of the corrosion in the cells and electrical circuit. The most common and significant problem with glass breakage are electrical security problems. Furthermore, glass breakage can contribute to hot spots where the consequence is that the PV modules can overheat. (Köntges, et al., 2014)
Figure 7 on the left side shows glass breakage due to the very tight screw and the second figure in the right side shows glass breakage due to the poor clamp.
Figure 7 glass breakage (Köntges, et al., 2014) permission from IEA PVPS (International Energy Agency Photovoltaic Power Systems Programme)
3.3.2. Snail trails
Snail trails also named snail tracks are discoloured lines that occurs in the front side metallization of PV cells (Köntges, et al., 2017). Snail trail appear after 3-5 months outdoor exposure and usually builds up over couple of years of power production on the field (Köntges, Kunze, Naumann, Berghold, & Roericht, 2012; Ganesh, 2018). Snail trails are discoloration, caused by moisture entering through the back sheet and diffuse to the cell surface (Ganesh, 2018). Water reacts on the cell rear side to hydrogen. Oxidized silver reacts with hydrogen and slightly above to pure silver and the hydrogen may lead to a slight colour change at the front side metallization (Köntges, et al., 2012). Mere existence of snail trails by itself does not affect power generation, but however snail trails correlated with micro cracks across cells may affect power generation (Ganesh, 2018). Mainly Silver nano-particles
showing a typical brownish colour (Ganesh, 2018). A study from Meyer et al. (2013) indicates snail trails are always located at the cell edge or along cracks. Not every micro crack develops snail trails, but observation exhibited that snail trails within cell area, had habitually a micro crack at the same position.
In a study performed by Guangda et al (2015), the mechanism of the snail trails in PV
modules was analysed. The study showed that micro cracks, moisture and peroxide residue in encapsulant are significant factors contributing to snail trail in PV modules. Another study performed by Bouaichi et al (2018), the impact of the snail trails on the power performance of the crystalline PV modules that have been in the field for 3 years in Morocco investigated. The result of the study showed that about 58.5 % of the PV modules had been impacted by snail trails and it contributes to a degradation rate of about 2.36 % per year. According to this study, the snail trails and cracks are very close to each other and 0.12 % per year in power loss can be considered because of the snail trails/cracks (Bouaichi, et al., 2018).
3.3.3. Encapsulation discolouring
A PV module is consisted of different components which are frame, glass, encapsulant, solar cells, back sheet and junction box. Encapsulating materials protect the solar cells from heat, moisture and radiation of UV. It also arranges good adhesion and decrease the ingress of moisture. EVA (Ethaline vinyl Acetate) is the material that is usually used for encapsulation. The efficiency of the PV module decreases, and other failures can happen if faults occur in the encapsulation. (ee Publisher, 2018)
Encapsulant discolouring is a common defect in PV modules that have been in the field for many years. Discolouration in PV modules is when the material get a colour of yellow or brown. This kind of defect decrease the light transmission to the PV cells which decrease short-circuit current (ISC). This contribute to less energy output and therefore loss of
efficiency (Shashwata, et al., 2017). Beyond the reduction of light transmission contribute discolouration to production of acetic acid which leads to corrosion of metallic contacts and collecting of volatile gases which in term contribute to delamination and bubbles formation that reduce the performance of the module and reliability. The acetic acid also contributes to polymer degradation (Sinhaa, Sastryb, & Gupta, 2016). External factors such as high
reason behind the discolouring of PV modules (Shapiro, Robbins, & Ross). The reduction of the PV modules prices in the market force a lot of manufacturers to use materials that are cheaper and have lower quality. This can accelerate the module discolouration as well (Shashwata, et al., 2017).
In a study by Bouaichi et al (2017) the effect of discolouration in two years old PV modules in Moroccan is investigated. The result of the investigation shows that the maximum power of the PV modules has been decreased by 5.28 % compared to initial capacity due to the discolouration. They claim that the main reasons cause of discolouration in the investigated PV modules could be high temperature, UV light and bad module packing (Bouaichi, et al., 2017). In a statistical analysis about the degradation of crystalline silicon PV cells under heat and temperature effect showed that EVA discolouration contribute to a power degradation from 2.08 to 3.48 % per year where the average is 2.60 % per year (Géraud, Basile, Macaire, & Vianou, 2018).
In the EVA encapsulant, the formulations that have additives that can increase the risk for discoloration should be avoided. It is also important that encapsulant packages are tested during the high temperature and UV exposure. This is to be sure that the encapsulant is not sensitive for UV or temperature. It is also important that manufacturers of PV modules control and check their products in the field. When investigating the PV modules, it is important that the manufacturer provides with long-term test data (UV test results) to be sure that the short circuit current of modules do not drop and consequently the power output because of the discoloration. (Wohlgemuth, Kempe, & Miller, 2013)
3.3.4. Delamination
Delamination is one of the most common failure in PV module in the field that has been documented a lot. Delamination can appear in the encapsulant from the front glass, cells, back-sheet or the interconnected ribbon. Using of cheap material and wrong processing are two common reasons that can lead to delamination. Delamination in the front glass, where poor glass cleaning method in the manufacture process can be one of the reasons, reduce the capture of light in the PV module and therefore it leads to loss of efficiency (Schneller, et al., 2016). This kind of defect becomes hazardous when humidity collects more in the void (ee Publisher, 2018). Bad cross-linking and polluted cell surface are two common factors that can contribute to delamination from the cell. This kind of defect can affect the cell negative when in laminate air bubble is created and lead to collection of the humidity and then short circuits (ee Publisher, 2018). Delamination is more common in a climate that is hot or humid.
Moisture ingress in the PV modules due to the delamination lead to occurrence of different sort of physical and chemical degradation for example corrosion in the metal (Ndiaye, et al., 2013).
Figure 8 shows some visible types of defects in PV modules in the field such as delamination, corrosion, glass breakage, snail trails, cracks and discolouration.
Image Type of defect Image Type of defect
Delamination has been occurred in a multi-crystalline silicon (Si) module.
Browned EVA with two cracks in a PV cell. Electrochemic al corrosion occurred in a thin-film module where it is connected to delamination. Snail Track occurred in a PV cell. Delamination occurred in a c-Si module. Browned PV cells, where a single cell is browner when it is hotter compared to other cells. Glass breakage in a thin-film. Delamination occurred in the back-sheet. Discolouratio n occurred in the center of a PV cell. Cracks occurred in PV cells.
Figure 8 some types of defects in PV (Köntges, et al., 2014) permission from IEA PVPS (International Energy Agency Photovoltaic Power Systems Programme), originally from IEA but with modifications
In a study performed by Nochang, Jaeseong, Byungjun and Donghwan (2013)
delamination and discoloration are analyzed in a 25-year-old module. The result from the study indicated that discoloration and delamination reduce short circuit current (ISC) and
lead to a power loss of about 17.9 % of the PV modules in comparison to the initial value (Nochang, Jaeseong, Byungjun, & Donghwan, 2013). Delamination and discoloration occur first after 15 years Köntges el at. (2014). In a statistical analysis about the degradation of crystalline silicon PV cells under heat and temperature effect showed that delamination in back sheet lead to a power degradation from 3.17-3.63 % per year (Géraud, Basile, Macaire, & Vianou, 2018).
It is important to be careful when choosing adhesives and primers which are more secure to humidity and UV light. The second important factor to eliminate delamination is to check the selected raw material and process and improve them if they do not meet the requirement. Another factor is to test the modules to detect if there are changes in material or in the process and try to eliminate them (Sungold, 2016).
3.3.5. Hot spots
A hot spot is a part of the PV module that has a very high temperature compared to the other area of module where it can injure cells or other components in PV modules. Hot spots occur if one or more cells of PV module are shaded or if the cells of PV module are mismatched and have a defect such as corrosion due to the moisture in back-sheet or defects in the
interconnection between the cells. Bad soldered connection point and insufficient
maintenance can contribute to hot spots in PV modules (Deng, et al., 2017). The result from a study by Kim and Krein (2016) about analysing and testing the performance of the failures in modules that have been performed for about 200 MW PV modules in the America, for 1 to 3 years, shows that hot spots contribute to 25 % of the failures. Hot spots reduce short circuit current (ISC) and then decrease the efficiency and performance of the PV module and thereby
the PV modules lifetime. Typical damages due to the hotspots are back-sheet bubbles, breakage of the cover-glass, corrosion and power loss. The produced current by the string is dissipated by the underperforming cells (shadowed or faulty cell) and these cells act such as a resistor where they convert the produced current into heat. Increase of the heat
(temperature) in the cells contribute to the accelerating of degradation in the back-sheet and encapsulant material (Deng, et al., 2017).
In a study conducted by Dhimish, Mather, & Holmes (2018) the impact of the hotspots on the performance of 2580 PV modules that had been installed from 2005-2007 in U.K was
investigated. The result from study showed that about 92.15 % of the PV modules influenced by hotspots in north of U.K where PV modules were under conditions such as heavy snow, low temperature and hoarfrost. After analyzing the performance ratio of affected PV modules, it detected that hotspots had decreased of performance ratio of PV modules compared to initial value. The minimum differences in performance ratio that were between the healthy and hotspotted PV modules were 0.83 % and the maximum differences were -15.47 % (Dhimish, Mather, & Holmes, 2018). In another case, different type of failures
studied in 90 mono crystalline silicon that have been in the field for 22 years located at India by Rajput, Tiwari, Bora and Sharma (2016). The result from the study showed that 37 of 90 PV modules were having hot spots. In these 37 PV modules, 15 modules demonstrated one hot spot, 12 modules had two hotspots, 9 PV modules had three and 1 module demonstrated four hot pots. It was found that the value for degradation of power for no hotspots was 0.29 % per year. 4 hot spots contribute to a power degradation of about 2.16 % per year. (Rajput, Tiwari, Bora, & Sharma, 2016).
The ways to decrease the risk for hot spots are to identify the situations that contribute to hotspots and try to prevent and remedy them by for example removing the object that leading to shading or performing cleaning cycle and optimizing the electrical connection.
Furthermore, choosing material that are consisting of a high level of thermal stability (DuPont, 2017).
3.3.6. Failure in conductor ribbon and joint
Different kinds of metals such as stainless steel, aluminium alloys, copper, soldering agents and so on apply for frames, cables, fingers, connectors and grids in a PV system. Defects can occur in all these metals. Humidity in combination with gases or alone lead to corrosion for example corrosion of the ribbon at the solder joint. Failure and aging of the solder joint lead to rise of series resistance which in turn contribute to power drop and efficiency of the PV modules (ee Publisher, 2018). Higher temperature makes the reaction faster and mechanical loads due to the weather conditions such as wind and snow can also contribute to corrosion (Ferrara & Philipp, 2012).
3.3.7. Degradation
External factors like environmental condition or internal factors like manufacturing defects is the cause to degradation during the lifecycle of the PV-module (Kumar, Jena, Sinha, & Gupta, 2017). Degradation rate is a factor which must be known, in order to predict power delivery. Several outdoor studies exceeding 20 years in length can be found of Crystalline Silicon technology (Jordan & Kurtz, 2012). The degradation rate for the modules at Natural Bridges National Park PV system in Utah (USA) had a degradation rate of 0.5 %/year (Quintana, et al., 2000). From over 11 years of exposure, an investigation of 192 monocrystalline silicon modules in Arcata, California and USA, proved to have an average degradation rate of 0.4%/year (Reis, Coleman, Marshall, & Chamberling, 2002). According to a study of Jordan and Kurtz (2012), over 40 years of nearly 2000 degradation rates reports, measured on individual modules or entire systems show a mean degradation rate of 0.8%/year and a median value of 0.5%/year. The majority of 78% of all collected data, reported a degradation rate of <1%/year. There is no satisfactorily answer about the linearity and the precise impact of climate impact on degradation of PV-modules. But modules left in open-circuit conditions