THE STRATEGIC HIGHWAY SAFETY PLAN IN PUERTO RICO:
ACCOMPLISHMENTS DURING THE FIRST TWO YEARS OF ITS
IMPLEMENTATION
Benjamín Colucci PhD, P.E.Professor, University of Puerto Rico at Puerto Rico 259 Blvd. Alfonso Valdez Cabian, Mayagüez, Puerto Rico Phone: 787-832-4040 ext. 3393 E-mail: benjamín.colucci1@upr.edu
Co-authors(s); Juan Carlos Rivera, MECE, P.E., PRHTA; Alexis Nevárez, MECE, P.E., PRHTA; and Kenneth Vélez, MECE, UPR-RCM
ABSTRACT
In the Commonwealth of Puerto Rico, a 3,500 square mile island located in the Caribbean, highway safety is a vital factor for all citizens which depend primarily on the private vehicle for the mobility of people and goods. According to the crash data in the Critical Analysis Reporting Environment (CARE), the six main contributing factors for fatal crashes along the Commonwealth’s highway network are: aggressive driving (43%), vulnerable users (32%), alcohol impaired drivers (28%), roadway departure (25.5%), young drivers between 18-24 years of age (25.4%), and intersections (13%). As part of the efforts to reduce the frequency of severe injury or fatal motor vehicle crashes, public agencies, the private sector, and non-profit organizations established the Puerto Rico Strategic Highway Safety Plan (PR-SHSP) for years 2014 - 2018. The vision of the PR-SHSP is that “all users of the transportation system move safely and effectively to their destinations”, and the mission is to “provide a safe, efficient and cost effective transportation system taking into account the needs of all users” (PR-SHSP, 2014, www.carreterasegurapr.com). The goal of this five-year plan is to “achieve a reduction in serious crashes, injuries, and fatalities on Puerto Rico’s public roadways.” The slogan for the PR-SHSP is "Working together toward highway safety to save more lives.”
The PR-SHSP five-year plan was prepared in alliance with the Puerto Rico Highway and Transportation Authority (PRHTA), the Puerto Rico Traffic Safety Commission (PRTSC), the Department of Health, the Puerto Rico Police Department (PRPD), the Federal Highway Administration (FHWA), the National Highway Traffic Safety Administration (NHTSA), and the Federal Motor Carrier Safety Administration (FMCSA). The plan was developed following guidelines from the FHWA adapted to the local conditions and opportunities. The PR-SHSP development included case studies, crash data analysis, a survey of highway safety stakeholders, and a Safety Summit. The nine safety Emphasis Areas in the PR-SHSP include three core areas, which are expected to remain in future SHSPs, are: emergency medical response, occupant protection, and traffic records and information systems. The six non-core Emphasis Areas, in the order of highest to lowest percentage of fatal crashes, are: aggressive driving, vulnerable road users, alcohol impaired driving, road departure, young drivers, and intersections. Ample participation from academic, non-profit, private and governmental stakeholder organizations have ensured acceptance of the plan and participation during the implementation process. This makes it possible to achieve positive results for the benefit of all road users.
This paper primarily describes the principal components of the Puerto Rico Strategic Highway Safety
average, the identification and participation of stakeholders in the process, and the accomplishments during the first two years of its implementation. Furthermore, the proposed action plan, as well as, the challenges for the remaining three years, will also be described. Finally, general guidelines on how the PR-SHSP can be adapted to be implemented in other countries with similar traffic, infrastructure, and climatic conditions, with the potential to increase awareness in road safety and save lives, will also be discussed.
1.
INTRODUCTION
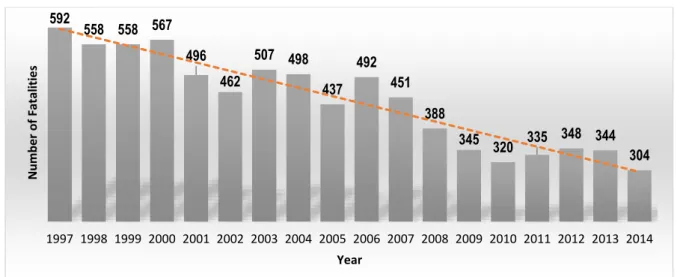
Based on the 2010 U.S. Census, the Commonwealth of Puerto Rico has a population of 3,725,789 people. The Island is 110 miles long by 39 miles wide, with 16,694 roadway miles, which averages to 4.86 roadway miles per square mile. The tropical climate includes an average rainfall rate of 69 inches (175 cm) per year, and its topography consists of a central mountainous region surrounded by a wide coastal plain, which influenced its geometric highway design. Data from Puerto Rico Department of Transportation and Public Works (PRDTPW), Puerto Rico Highway and Transportation Authority (PRHTA), Automobile Accident Compensation Administration (ACAA, by its Spanish acronym) and the Puerto Rico Police Department (PRPD), show several traffic indicators and traffic crash trends for the years 2008-2012. For example, a constant increase in the number of registered vehicles from 3,129,561 to 4,500,941 (years 2008-2012); an increase in licensed drivers from 2,017,055 to 2,991,904 (years 2008-2012); an increase in roadway miles from 16,576 to 16,694 (years 2008-2012), and an important reduction in the million vehicles miles traveled from 194.3 to 181.8. During that time period, Puerto Rico averaged over 220,000 traffic crashes, 360 traffic fatalities, and 37,000 injuries each year. In 1975, Puerto Rico was the first Territory of the United States to pass a primary seat belt law. During 2013, an observational study showed an 89.7% seat belt usage rate and a 94.7% use of child restraints, an increase in usage compared to preceding years. In terms of allowable Blood Alcohol Concentration (BAC), the law has recently been changed from 0.10% for all drivers over the age of 18 to 0.02% for drivers within the age bracket of 18 to 20 years, and 0.08% for drivers ages 21 and over. In addition to policy changes, vehicle safety improvements, continuous educational campaigns, and more recently, the PR-SHSP, have benefitted highway safety. This is evident in the reduction of traffic crash fatalities over the past 15 years, from 592 in 1997 to 304 in 2014, as shown in Figure 1.
Figure 1: Trends of Crash Fatalities in Puerto Rico (Source: 2015 PR Highway Safety Summit) 592 558 558 567 496 462 507 498 437 492 451 388 345 320 335 348 344 304 1997 1998 1999 2000 2001 2002 2003 2004 2005 2006 2007 2008 2009 2010 2011 2012 2013 2014 N u mb e r o f F atal iti e s Year
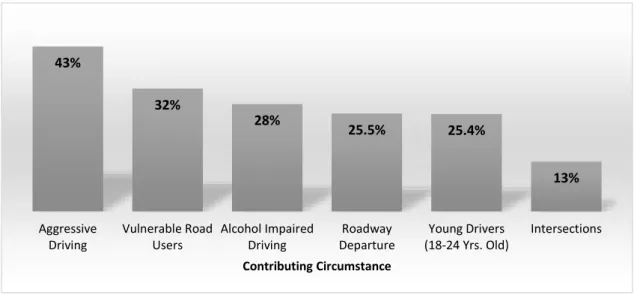
According to the crash data in the Critical Analysis Reporting Environment (CARE), the six main contributing factors for fatal crashes along the Commonwealth’s highway network are aggressive driving (43%), vulnerable users (32%), alcohol impaired drivers (28%), roadway departure (25.5%), young drivers between 18 -24 years of age (25.4%), and intersections (13%). These fatal crash trends are the average annual crash percentages from the years 2007 to 2012, and are shown in Figure 2.
Figure 2: Average Annual Fatal Crashes by Contributing Circumstance (Source: CARE 2007-2012)
In order to significantly reduce the number of fatalities and serious injuries on our highway system, in 2014, the PRDTPW and the PRHTA developed the Puerto Rico Strategic Highway Safety Plan (PR-SHSP) for years 2014 - 2018, a data-driven planning document that integrates multiple safety stakeholders from governmental agencies, private entities, and non-profit organizations. One of the first tasks in the PR-SHSP’s development process was to create several reports that summarize Puerto Rico’s current practices in highway safety planning, and crash data collection and management. The process of data collection began with a SHSP Case Study Report. This report was an analysis of SHSPs adopted in other regions in the United States, and provided recommendations towards the development of the PR-SHSP based on the successes and lessons learned from the regions analyzed. In addition to the SHSP Case Study Report, the SHSP Literature Review – An Assessment of PR
Highway Safety Plans & Procedures, integrated the long term plans (i.e. Metropolitan Transportation
Plan and the Long Range Transportation Plan), the midterm safety plans (i.e. Commercial Motor Vehicle Safety Plan, Highway Safety Plan, and other local plans), and short term execution of safety projects included in the Statewide Transportation Improvement Program. Also included was a detailed review of the databases that are available to the PRHTA, and its limitations. The crash databases reviewed were Fatal Analysis Reporting System (FARS), Critical Analysis Reporting Environment (CARE) Database, ACAA, Traffic Citation Data, Puerto Rico Crash Database, and GIS Data. In addition, two behavioral studies that were conducted in Puerto Rico in 2013 were discussed; first, the “driving under the influence of alcohol” campaign, and second, an observational seatbelt use study. Finally, the report provided a summary of the crash data collection process which included a description of the police reports used and the process of entering crash data in the PRDTPW. It also provided a baseline for the current highway safety practices, and a high level understanding of the different planning and execution tools used in Puerto Rico.
43% 32% 28% 25.5% 25.4% 13% Aggressive Driving Vulnerable Road Users Alcohol Impaired Driving Roadway Departure Young Drivers (18-24 Yrs. Old) Intersections Contributing Circumstance
Additional information was obtained from the Highway Safety Survey, an integral part of the stakeholder participation in the preparation for the PR-SHSP. (For further details regarding stakeholder involvement and the Highway Safety Survey, please refer to section 3.3) After the assessment of the Puerto Rico safety plan and procedures were completed, the stakeholders collaborated and prepared a 5-year plan..
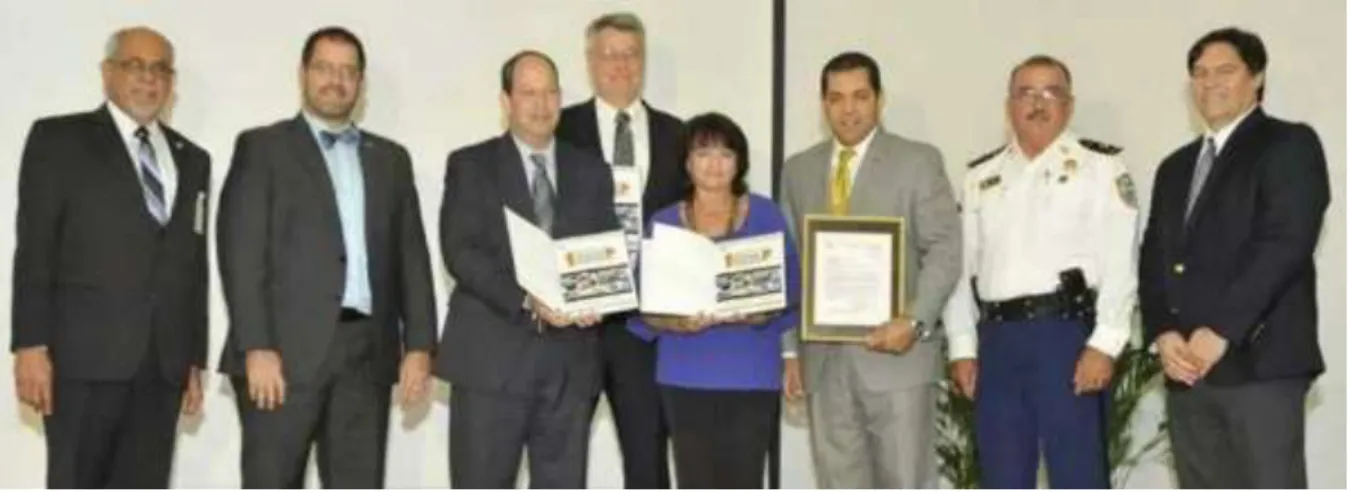
Figure 3: Formal Presentation of PR-SHSP on July 30, 2014. From Left to Right: Mr. José Delgado (PRTSC), Mr. Javier Ramos (PRTSC), Mr. Richard Simon (NHTSA), Mr. Michael Avery (FHWA), Mrs. Enid Martínez (FMCSA), Mr. Miguel Torres (Secretary of PRDOT), Mr. Jorge Hernández Peña (PRPD) and Dr. Greduvel Durán (Department of Health).
2.
OBJECTIVES
The objective of this paper is to describe the principal components of the PR-SHSP, show how the historical trends of fatalities and serious crashes were analyzed using the five year moving average, outline the identification and participation of stakeholders, and demonstrate the accomplishments during the first two years of its implementation. Furthermore, the proposed action plan, as well as the challenges for the remaining three years, will also be described. Finally, guidelines on how the PR-SHSP can be implemented in other countries will be discussed.
3.
DESCRIPTION AND APPLICATION PROCESS OF THE
STRATEGIC HIGHWAY SAFETY PLAN OF PUERTO RICO
3.1. Principal Components of the SHSP in Puerto Rico
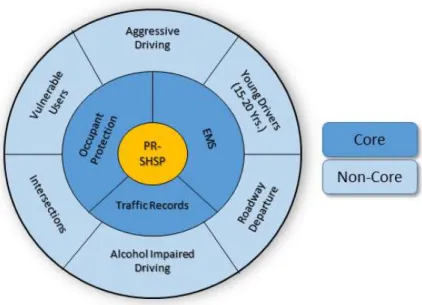
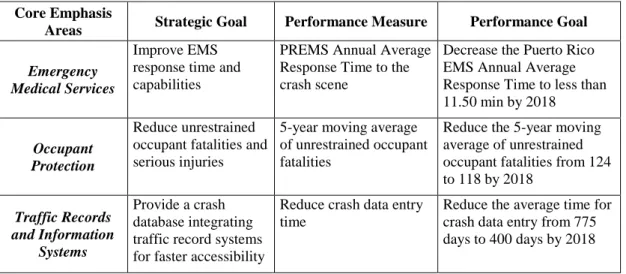
The SHSP is divided by the nine (9) Emphasis Areas. These areas were selected based on historical crash trends and their contributing causes to crash fatalities, and are therefore considered to be the safety priorities for Puerto Rico, especially for the years 2014 through 2018. The three (3) Core Emphasis Areas are emergency medical response (EMS), occupant protection, and traffic records and information systems. The six non-core Emphasis Areas, in the order of highest to lowest percentage of fatal crashes, are aggressive driving, vulnerable road users, alcohol impaired driving, road departure, young drivers, and intersections. The Core Emphasis Areas were selected due to their overall importance to road safety in Puerto Rico. The stakeholders agreed that these areas require a longer period of time and need continued attention for the success of the SHSP’s goals. Figure 4 shows the Emphasis Areas for the 2014 Puerto Rico SHSP.
Figure 4: 2014 Puerto Rico SHSP Emphasis Areas (Source: PR-SHSP)
An action plan was created that included a strategic goal, a performance measure, and an objective (performance measure) for each emphasis area, as well as strategies to increase safety and decrease crash fatalities in each area. University research projects in Puerto Rico are being used to assist in the selection of effective safety countermeasures. Recent rumble strips studies, both centerline and shoulder, continuous and non- continuous, are examples of data-driven countermeasure selection and implementation. Furthermore, as part of the SHSP project, there are tasks to develop before and after studies for the evaluation of countermeasures, which take years to collect all pertinent data. During this transition of implementations, the Puerto Rico SHSP, a combination of university research and LTAP training using national performance measures are used and adapted to local conditions. It is also important to mention that when the SHSP was approved, serious injuries data were not available for each of the emphasis areas. This is one of the reasons why Traffic Information Systems is a Core Emphasis Area for the Puerto Rico SHSP, as shown in Figure 4. It is pertinent to mention that due to Puerto Rico’s current economic situation, the Traffic Information Systems in Puerto Rico will most likely take longer than the five years duration set aside for the current Puerto Rico SHSP. This section provides a description of each of these areas, and two tables to summarize, Table 1 for the Core Emphasis Areas, and Table 2 for the Non-Core Emphasis Areas.
3.1.1. Emergency Medical Response
The general opinion presented by the safety stakeholders during the Highway Safety Survey process was that Emergency Medical Response (EMS) needs to be a priority in Puerto Rico. The response time is measured from the time of deployment of a Puerto Rico EMS ambulance to its arrival to the crash scene. According to data from the Emergency Medical Corps of Puerto Rico (CEMPR), the average annual response time is from 12 to 13 minutes, but if this response time is reduced, the goal of reducing fatalities and serious injuries on the highway system can be achieved. Strategies to improve response times include integrating EMS agencies, Incident Management Training to EMS and law enforcement personnel, and the establishment of an EMS station grid, among others. The objective is to reduce response times to less than 11.5 minutes.
3.1.2. Occupant Protection
In Puerto Rico, the use of seatbelts and car seats is mandatory by law. Although restraint use is more than 85%, according to behavioral studies performed in 2013, about 16% of all traffic fatalities involve unrestrained occupants. Unrestrained drivers sustain more severe injuries in vehicular crashes, and the need to keep informing the public about the use of seatbelts and car seats is still apparent by the recent increase in fatal crashes that involve unrestrained drivers. Strategies to reduce fatalities and severe injuries include educational campaigns, strict law enforcement, and child seat training programs. The objective is to reduce the 5-year moving average of unrestrained occupant fatalities by 5%, from 124 to 118 by the year 2018.
3.1.3. Traffic Records & Information Systems
According to the Highway Safety Survey, crash data collection, analysis, and its availability were immediate and high priorities in Puerto Rico. Improvements needed in the crash data include accurate reporting of traffic crash locations, which is extremely important for the identification of high frequency crash locations (also referred to as hot spots). It is necessary to obtain the location data, reduce data entry time, and eliminate duplication of efforts. The plan’s objective is to reduce crash data entry time to 400 days by 2018.
Table 1: Occupant Protection Goals, Performance Measures, and Objectives for Core Emphasis Areas (Source: PR-SHSP) Alcohol Impaired Driving
Core Emphasis
Areas Strategic Goal Performance Measure Performance Goal Emergency
Medical Services
Improve EMS response time and capabilities
PREMS Annual Average Response Time to the crash scene
Decrease the Puerto Rico EMS Annual Average Response Time to less than 11.50 min by 2018
Occupant Protection
Reduce unrestrained occupant fatalities and serious injuries
5-year moving average of unrestrained occupant fatalities
Reduce the 5-year moving average of unrestrained occupant fatalities from 124 to 118 by 2018 Traffic Records and Information Systems Provide a crash database integrating traffic record systems for faster accessibility
Reduce crash data entry time
Reduce the average time for crash data entry from 775 days to 400 days by 2018
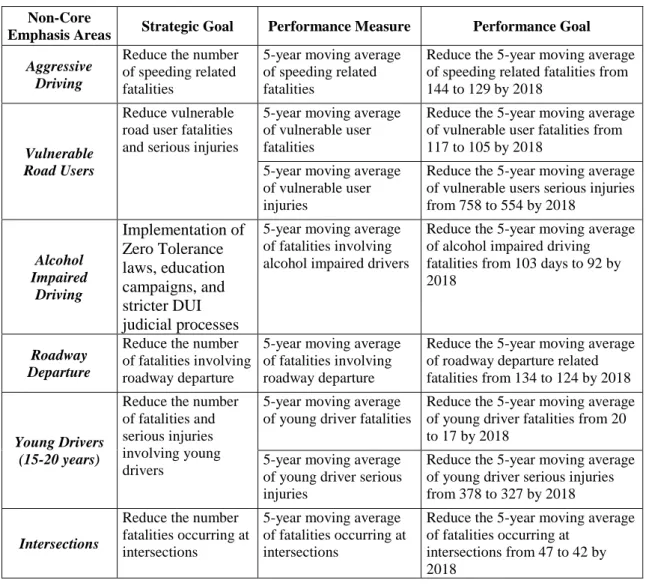
3.1.4. Aggressive Driving
The crashes where the driver was speeding, or going over the posted speed limit were determined to be aggressive driving crashes for the analysis of this Emphasis Area. From 2007 through 2013, 39% of all traffic fatalities are attributed to aggressive driving. To help reduce this crash statistic, increased law enforcement, educational campaigns, tools for improved law enforcement, and employing engineering methods in the design of highways to deter speeding are proposed to be implemented. The objective for this Emphasis Area is to reduce the 5-year moving average of speeding related fatalities by 10%, or from 144 to 129 by the year 2018.
3.1.5. Vulnerable Road Users
Vulnerable road users include those persons that are more susceptible to severe injury or death, as they do not have a structure to protect them in the event of a crash. These vulnerable road users, pedestrians and bicyclists, on average, represent more than 30% of the total number of fatalities. One of the factors
that contribute to this high fatalities statistic is the misconception that the right-of-way is exclusive to vehicular traffic. The performance goal is a 10% reduction in the 5-year moving average of vulnerable user fatalities, from 117 to 105, and a 29% reduction in the 5-year moving average of severe injuries, from 758 to 554 within the next 5 years. Strategies being implemented to help achieve these objectives are encouraging safe bicycling and walking with planning and engineering measures, improving road infrastructure and traffic signals for all road users, and education campaigns, among others.
3.1.6. Alcohol Impaired Drivers
Alcohol impaired driving fatalities make up for 29% of all traffic related fatalities and 44% of traffic fatalities are attributed to alcohol related crashes. It is important to note that alcohol impaired fatalities differ from alcohol related crashes, where alcohol impaired driving fatalities refer to the drivers, and the latter refers to all road user traffic deaths where at least one person was impaired. In Puerto Rico, people of 0-15 years old are not allowed to drive, thus the Blood Alcohol Concentration (BAC) maximum is 0%; 16-17 years old are allowed to drive, but are considered alcohol impaired if their BAC is greater than 0%; drivers 18-20 years, motorcycle riders, and truck drivers are considered alcohol impaired with a BAC greater than 0.02%; and drivers 21 years and older with a BAC of 0.08% and above are considered alcohol impaired. Implementation of Zero Tolerance laws, education campaigns, and stricter DUI judicial processes, among others, are proposed to achieve a 10%
reduction in the 5-year moving average of alcohol impaired driving fatalities from 103 to 92 by the year 2018, as shown in Table 2.
3.1.7. Road Departure
There are several factors attributed to a driver leaving the roadway, such as: driving too fast, poor pavement conditions, driver fatigue, vehicle defects, poor visibility, and others. In 2013, the number of fatalities associated with roadway departure represented 41% of the total fatalities caused by traffic crashes. The most common contributing factor found in the data was “driver lost control” and “exceeded speed limit”, but behavior factors such as distracted and aggressive driving are the possible contributing factors to the increase in this crash type. Implementing engineering measures such as edgeline and centerline rumble strips, fixed object removal or shielding, training of transportation officials in innovative roadway departure countermeasures, and improve law enforcement of vehicle maintenance and inspection violations, are several strategies proposed to reduce the number and severity of road departure crashes. The objective for this Emphasis Area is reducing the 5-year moving averages of fatalities associated with roadway departure crashes by 7%, or from 134 to 124 by the year 2018.
3.1.8. Young Drivers
When analyzing the fatalities by population age, the drivers between the ages of 15 to 24 years old are overrepresented, while the age group from 15 to 20 years of age is the most at risk group, representing 6% of all traffic fatalities. The objective of this Emphasis Area is to reduce the 5-year moving average of the number of fatalities of young drivers between the ages of 15 and 20 years old by 15%, from 20 to 17, within the next 5 years and reducing the 5-year moving average of serious injuries by 13%, from 378 to 327 within the next 5 years. Several strategies proposed to attain this reduction include driver restrictions to drivers under the age of 18, increase and improve teen driver education programs in schools, and improve law enforcement against the illegal sale of alcohol to young people.
3.1.9. Intersections
In Puerto Rico, 13% of all traffic crashes resulting in fatalities occurred at an intersection. The 5-year moving average of fatalities at intersections has remained constant at 47 throughout the 2007-2013 analysis period. The objective for this Emphasis Area is to reduce the 5-year moving average of fatalities
that occur in intersections from 47 to 42 within the next 5 years. Strategies in place to help achieve this goal are promoting geometric safety improvements, education campaigns for law enforcement and the general public, and improve delineation and visibility of intersections, among others.
Table 2: Intersection Goals, Performance Measures, and Objectives (Source: PR-SHSP) Non-Core
Emphasis Areas Strategic Goal Performance Measure Performance Goal Aggressive
Driving
Reduce the number of speeding related fatalities
5-year moving average of speeding related fatalities
Reduce the 5-year moving average of speeding related fatalities from 144 to 129 by 2018
Vulnerable Road Users
Reduce vulnerable road user fatalities and serious injuries
5-year moving average of vulnerable user fatalities
Reduce the 5-year moving average of vulnerable user fatalities from 117 to 105 by 2018
5-year moving average of vulnerable user injuries
Reduce the 5-year moving average of vulnerable users serious injuries from 758 to 554 by 2018 Alcohol Impaired Driving Implementation of Zero Tolerance laws, education campaigns, and stricter DUI judicial processes
5-year moving average of fatalities involving alcohol impaired drivers
Reduce the 5-year moving average of alcohol impaired driving fatalities from 103 days to 92 by 2018
Roadway Departure
Reduce the number of fatalities involving roadway departure
5-year moving average of fatalities involving roadway departure
Reduce the 5-year moving average of roadway departure related fatalities from 134 to 124 by 2018
Young Drivers (15-20 years)
Reduce the number of fatalities and serious injuries involving young drivers
5-year moving average of young driver fatalities
Reduce the 5-year moving average of young driver fatalities from 20 to 17 by 2018
5-year moving average of young driver serious injuries
Reduce the 5-year moving average of young driver serious injuries from 378 to 327 by 2018
Intersections
Reduce the number fatalities occurring at intersections
5-year moving average of fatalities occurring at intersections
Reduce the 5-year moving average of fatalities occurring at
intersections from 47 to 42 by 2018
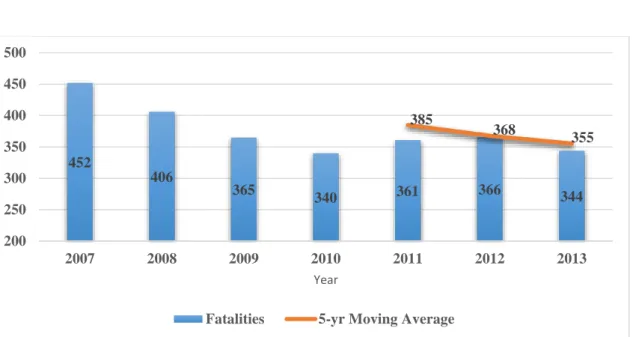
3.2. Analyzing the Historical Trends of Fatalities and Serious Crashes:
Overall Traffic Fatalities and Injuries Performance Measures
The total number of traffic crash related fatalities was 344 in 2013, and the 5-year moving average for the total number of fatalities was 355 in the same year. The overall objective for the PR-SHSP is a 12.8% reduction in total traffic fatalities, from 344 to 300, and a 10.4% reduction in the 5-year moving average of total traffic fatalities and for serious injuries. The historical crash fatality trends are depicted in Figure 5.
Figure 5: Traffic Fatalities and 5-Year Moving Average for Traffic Fatalities from 2007 – 2013 (Source: PR-SHSP)
3.3. Identification and Participation of Stakeholders in the Process
A three-level organizational structure was recommended for the SHSP organization: Executive Committee (Level 1), Steering Committee (Level 2), and Stakeholders (Level 3). The Stakeholders consists of teams developing and/or reviewing strategies and actions plans for each Emphasis Area. The Emphasis Areas Teams, are composed of multi-sector members distributed by the 4Es with the primarily responsibilities of developing specific and measurable actions, which can be undertaken in each of the identified Emphasis Areas. The stakeholders include: state agencies, private sector, non-profit organizations, universities, municipalities, and federal agencies. These groups of highway safety leaders meet quarterly to discuss projects, initiative, and strategies in every Emphasis Area.
Figure 6: A Group Photo of Team Members after Assisting an Emphasis Area Team Meeting
3.4. Accomplishments during the First Two Years of Implementation
During the first two years of the implementation of the PR-SHSP, several key improvements were integrated with the goal of reducing the number and severity of traffic crashes. Some of these achievements include:
Inter-Municipal Integration – Collaborations were created with several municipalities with the purpose of sharing resources and working together to form highway safety strategies. The first phase included the collaboration between the Municipalities of San Juan, Caguas, Bayamon, Carolina, and Ponce.
452 406 365 340 361 366 344 385 368 355 200 250 300 350 400 450 500 2007 2008 2009 2010 2011 2012 2013 Year
Vulnerable Users Campaigns – The Puerto Rico Police Department worked on several educational campaigns such as the “We are all pedestrians” campaign in the San Juan area, and the “When you leave your vehicle, you will be one of them” island wide pedestrian educational campaign.
PRPD Task Force, Equipment, and Training - The creation of a motorized unit on 100 motorcycles to take on speeding, unrestrained, and cell phone use infractions. The purchase of 70 Toxilyzers 9000’s and Alcoholsensors 3, as well as, over 30 road blocks were part of the fight against drunk driving. Also, 39 training sessions for agents in managing situations regarding alcohol, photo-meters, radar guns, and crash scenes. A total of 66,930 tickets for these specific infractions have been issued in 2015 as a result of these efforts.
Emergency Medical Response – To improve EMS response times, an Emergency Medical Corps of Puerto Rico (CEMPR) response center was created in Salinas, and in collaboration with DTOP/ ACT, two more CEMPR stations in the Caguas and Juana Diaz toll plazas are proposed. In addition to the centers, ambulance purchases and educational campaigns regarding CEMPR services were made to improve EMS response.
PRTSC – In 2015, $1.23 million invested in targeted educational campaigns in the PR media and island wide highway risks elimination projects. These educational campaigns address drunk driving, cyclist safety, seatbelt use, speeding, and cell phone use.
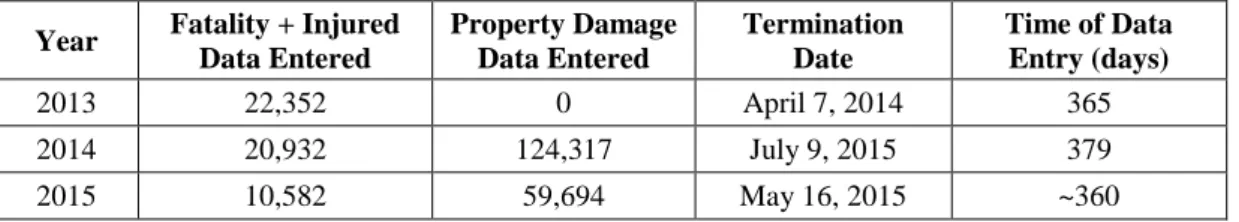
PRHTA – $70.1 million invested towards road safety improvements for the years 2014 to 2016. In order to gauge the progress of the implementation of the countermeasures used to work the established focus areas, it is key to have an efficient and accurate crash database. Since 2010, the time for crash data entry was reduced from 1460 days to 379 days in 2014, as shown in Table 3. This is a dual accomplishment: while expanding the type of data available to include property damage crashes, the time to enter such data has been reduced significantly, even below the original goal of 400 days. Table 3: Traffic Crash Data Input from 2013 – 2015 (Source: 2015 PR Highway Safety Summit)
Year Fatality + Injured Data Entered Property Damage Data Entered Termination Date Time of Data Entry (days) 2013 22,352 0 April 7, 2014 365 2014 20,932 124,317 July 9, 2015 379 2015 10,582 59,694 May 16, 2015 ~360
As a result of improved crash data entry and inter-agency collaboration, the current crash trends can be analyzed and compared to previous years. The most recent statistics, depicted in Table 4, show a reduction in crash fatalities of passengers, motorcyclists, cyclists, and the total number of fatalities, on the other hand, the road users that present a challenge include pedestrians, drivers, and others.
Table 4: The Impact of PR-SHSP Implementation - Crash Fatalities in Puerto Rico as of November 25, 2015 (Source: PR Traffic Highway Safety Commission)
Users 2014 2015 Change Pedestrians 71 81 +10 Drivers 80 86 +6 Passengers 37 27 -10 Motorcycles 45 34 -11 Cyclist 10 9 -1 Others 1 3 +2 Total 244 240 -4
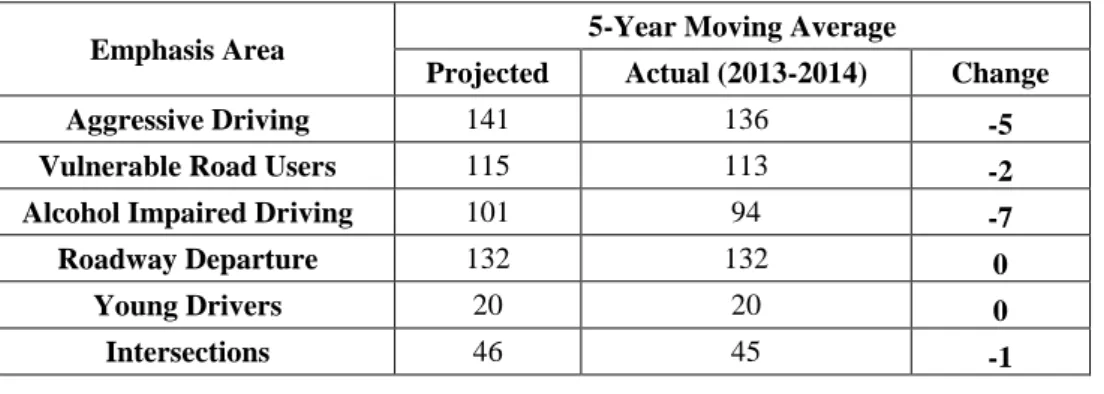
When comparing the 5-year moving average of traffic crash fatalities of each of the Emphasis Areas, the actual 5-year moving averages are less than or equal to the projected numbers for 2014, as shown in Table 5. The data show positive results in overall safety during the early stages of SHSP implementation. More definitive information will be available, as part of the before and after project evaluations and other traffic safety research currently planned or underway.
Table 5: The Impact of PR-SHSP Implementation - Projected and Actual 5-Year Moving Average of Crash Fatalities by Emphasis Area (Source: 2015 PR Highway Safety Summit)
Emphasis Area 5-Year Moving Average
Projected Actual (2013-2014) Change
Aggressive Driving 141 136 -5
Vulnerable Road Users 115 113 -2
Alcohol Impaired Driving 101 94 -7
Roadway Departure 132 132 0
Young Drivers 20 20 0
Intersections 46 45 -1
4.
PR-SHSP ACTION PLAN AND CHALLENGES
The implementation phase of the Puerto Rico SHSP 2014 requires several steps that ensure the success of the plan; not a plan to be archived and forgotten. The only way to successfully reduce fatal and serious-injury crashes is through a coordinated and cooperative effort. Firstly, a memorandum of understanding (MOU) was signed between agencies to identify responsibilities and facilitate sharing of funding and other resources. Then, teams made up of various agencies and stakeholders are created, one for each Emphasis Area. It is very important to note that a diverse group of governmental and non-governmental stakeholders are represented in these groups. The teams meet on a regular basis to monitor the progress of the PR-SHSP objectives, and to create or update action plans to achieve goals. These action plans include specific countermeasures, actions or tactics, identification of agency in charge, and project schedule.
With inter-agency collaboration island wide, the strategies, tactics and projects developed as part of the implementation of the SHSP can be integrated into other ongoing transportation plans. The transportation plans proposed for this integration include: the Long Range Transportation Plan, the Highway Safety Plan, Statewide and Metropolitan Transportation Improvement Program, the Commercial Vehicle Safety Plan, the Comprehensive Bicycle and Pedestrian Plan, and the ADA Transition Plan. The implementation of the SHSP has changed the manner that administrative agencies approach road projects to a safety data-driven approach. Also, it has helped increase collaboration
between planning, design, and traffic engineering areas in developing related projects and plans such as Complete Streets, Road Diets, and the Pedestrian and Bicycle Safety Plan. Even though some of these projects are in their early stages, the stakeholders are enthusiastic and are working together in ways that did not exist before. There certainly are examples of tangible and intangible results in the early stages of the implementation of the SHSP.
Figure 7: The Many Stakeholders that Play an Important Part in the Success of the PR-SHSP
Also part of the coordinated efforts is Puerto Rico’s commitment to play a participating or leading role in organizations such as: the Federal Highway Administration (FHWA), the National Highway Traffic Safety Administration (NHTSA), the American Association of State Highway and Transportation Officials (AASHTO), the Transportation Research Board (TRB), the Institute of Transportation Engineers (ITE), the Governors Highway Safety Association (GHSA), and the Federal Motor Carrier Safety Administration (FMCSA). By playing an active role in these organizations, Puerto Rico transportation professionals can stay up-to-date on the best practices in highway safety and implement them in future projects.
Finally, marketing efforts of the PR-SHSP are important. Through the use of the SHSP webpage, informational and educational brochures, newsletters, media events, and an active and visible spokesperson, a consistent and constant message of the importance of highway safety and its impacts on our daily lives, are delivered.
5.
FUTURE
ACTIVITIES
AND
THE
POTENTIAL
FOR
IMPLEMENTATION IN LATIN AMERICA
5.1. Future Activities
The implementation of the PR-SHSP is a continual effort. The future plans include an island wide highway risk reducing project, where improvements will be made to increase the safety of highways. These improvements include pavement delineation and the purchase of equipment to perform this task,
signage, guardrail replacements and/ or upgrades, rumble strips, and traffic light upgrades. Another project is the continuation of kilometer marking installations, which was started in 2012. This effort will aid in proper crash reporting, specifically the location of where the incident took place. Other future projects include the construction of the CEMPR stations in the Caguas and Carolina toll plazas that will result in reduce emergency response times. In addition to these named projects, the PR-SHSP will be continually upheld, and adjusted with the purpose of increasing road safety,
5.2. Guidelines for the Implementation of a Strategic Highway Safety
Plan in Latin American Regions
Latin American regions can create their own Strategic Highway Safety Plan similar to the manner the PR-SHSP was developed and implemented because, regardless of the location, the general target of transportation safety professionals is to create safer highways, and reduce the number of fatalities and the severity of crashes. Keeping in mind the successes and lessons learned from the PR-SHSP, the following general guidelines for the creation of a successful SHSP in Latin American region are presented.
1. The decision: Make the decision to start the process to create a Strategic Highway Safety Plan with the support of top management.
2. Create a safety task force between agencies and stakeholders: This step requires identifying agencies, organizations, and stakeholders key to the success of the SHSP and obtaining members representative of their agencies or organizations to collaborate in the effort. It is imperative for the success of this task force to have enough technical assistance resources, such as a consultant, dedicated exclusively to the SHSP tasks.
3. Crash data collection and analysis: The collection and analysis of crash data required inter-agency cooperation between transportation officials, the police departments, and accident insurance companies in order to obtain a comprehensive, and representative data. Once the data is obtained, it would have to be sorted, and analyzed.
4. Identify and designate Emphasis Areas: Identify crash circumstances with the highest number of fatalities and serious injuries in your region, and designate them at the Emphasis Areas for the SHSP.
5. Perform a literature review: In this step, the literature review of SHSP’s from States in the United States, FHWA guidelines for SHSP preparation, and interviews with other transportation safety officials that took part in the creation of the SHSP in their regions. 6. Survey agencies: Survey agencies for their feedback on how to improve each Emphasis Area. 7. Create Emphasis Area teams: Create teams for each Emphasis Area and ensure that each team contains representation of multiple agencies. These teams should be created with the purpose of meeting on a regular basis and creating an action plan in order to address safety issues as they arise. It is very important that these teams comprise of a diverse group of stakeholders, including government, educational institutions, private groups, and non-profit organizations. 8. Form Emphasis Area Action Plans: Create strategic goals, performance measures, and
objectives for each Emphasis Area and an Action Plan to meet those goals.
9. Stay up-to-date: Maintain an active role in transportation organizations, specifically to share ideas with other regions, stay informed on current technologies and best practices.
10. SHSP marketing: Use the media such as television, Facebook, twitter, and the web to relay the importance of highway safety and its impact to society.
11. Monitor SHSP progress: Monitor the impact that the newly implemented countermeasures have had on the number of fatalities and severe injury crashes, compare with the objectives set for each Emphasis Area, and make adjustments in the Action Plan, if necessary. The creation
of safety summits is an excellent way to inform related agencies and stakeholders of the plan’s progress and challenges.
6.
CONCLUSIONS
The PR-SHSP is a five-year plan created in an inter-agency collaboration. The plan was developed following guidelines from the FHWA adapted to the local conditions and opportunities. The PR-SHSP development included case studies, crash data analysis, a survey of highway safety stakeholders and a Safety Summit. The nine safety Emphasis Areas in the PR-SHSP were based on historical crash trends. Once the safety Emphasis Areas were designated, strategic goals, performance measures, and objectives are created to reduce the number of crashes in each area of focus. Numerous countermeasures and educational campaigns have been implemented since the inception of the PR-SHSP and the results have been positive. A comparison of the projected and actual 5-year moving average of fatalities in each of the Emphasis Areas show a reduction in 4 out of 6 areas, and the remaining 2 Emphasis Areas remained the same as what was projected. This is evidence that the efforts are working, and with the proposed projects on the horizon, the results will be greater. The principal components used in the creation of the PR-SHSP, as well as the guidelines provided, are beneficial for putting together a SHSP in another country or region.
7.
ACKNOWLEDGMENTS
The authors would like to take this time to acknowledge Yanira Rivera, BSCE and Pathways intern at FHWA Puerto Rico and USVI division and Wilfredo Cordero, ME for their contribution to the writing of this report.
8.
REFERENCES
The Commonwealth of Puerto Rico. (2014). 2014 – 2018 Puerto Rico Strategic Highway Safety Plan. Puerto Rico Department of Public Works and the Puerto Rico Highway and Transportation Authority. San Juan, Puerto Rico. (First Edition)
The Commonwealth of Puerto Rico. Puerto Rico Highway and Transportation Authority (2014). SHSP Literature Review – An Assessment of PR Highway Safety Plans & Procedures. CSA Architects and Engineers, LLP. San Juan, Puerto Rico.
The Commonwealth of Puerto Rico Highway Traffic Safety Commission. http://comisionparalaseguridadeneltransito.com/ Accessed: 11/25/2015.
Rivera, Juan Carlos. “Puerto Rico Strategic Highway Safety Plan 2014 -2018 – Results by Emphasis Area with Monitoring Tool” Puerto Rico Highway Safety Summit. Puerto Rico College of Engineers and Surveyors, Hato Rey. November 2015. Presentation.
University of Alabama. Center for Advanced Public Safety (2009). “CARE – Critical Analysis Reporting Environment.” http://caps.ua.edu/care.aspx, Accessed: November 2015.