MIRIAM
_____________________________________________
Models for rolling resistance In Road Infrastructure Asset Management systems
Rolling Resistance – Basic Information and
State-of-the-Art on Measurement methods
Editor: Ulf Sandberg, Swedish National Road and Transport Research Institute
(VTI)
List of contributors inside
Deliverable # 1 in MIRIAM SP 1 Final version, updated 2011-06-01 Document type and No. Report MIRIAM_SP1_01
Sub-project SP 1 Measurement methods and source models Author(s) Editor: Ulf Sandberg (a). List of contributors inside Authors' affiliations (acronyms) (a) VTI
Contact data for main author ulf.sandberg@vti.se
Document status and date Version 110401, rev. 110412, rev. 110512, rev 110601 Dissemination level Public
File Name MIRIAM_SP1_SoA_Report
List of contributors:
The order below is by alphabetical order of the authoring institutes (except in the case of the editor), and has nothing to do with the extent or importance of the contributions.
Ulf Sandberg
Swedish Road and Transport Research Institute (VTI), Linköping, Sweden
Editor and main author
Manfred Haider and Marco Conter
Austrian Institute of Technology (AIT), Vienna, Austria
Co-authors, contributors regarding definitions and models
Luc Goubert and Anneleen Bergiers
Belgian Road Research Centre (BRRC), Brussels, Belgium
Co-authors, contributors regarding the trailer method
Klaus-Peter Glaeser, Gernot Schwalbe and Marek Zöller
Federal Highway Research Institute (BASt), Bergisch-Gladbach, Germany
Co-authors, major contributors regarding laboratory drum and trailer methods
Olivier Boujard
Institut français des sciences et technologies des transports, de l'aménagement et des réseaux (IFSTTAR), Nantes, France
Co-author, contributor with a French report about definitions, models and measurements
Ulf Hammarström
Swedish Road and Transport Research Institute (VTI), Linköping, Sweden
Co-author, major contributor regarding experience collected in the ECRPD project
Rune Karlsson
Swedish Road and Transport Research Institute (VTI), Linköping, Sweden
Co-author, major contributor regarding the coastdown method
Jerzy A. Ejsmont
Technical University of Gdansk (TUG), Gdansk. Poland
Co-author, major contributor regarding trailer methods
T. Wang and J.T. Harvey
University of California, Pavement Research Center, UC Davis and Berkeley, Davis, California, USA
Foreword
MIRIAM, an acronym for "Models for rolling resistance In Road Infrastructure Asset Manage-ment systems", is a project started by twelve partners from Europe and USA. They have collectively risen internal and external funding for this project. The managing partner is the Danish Road Institute.
The overall purpose of MIRIAM is to provide information useful for achieving a sustainable and environmentally friendly road infrastructure. In this project, the focus is on reducing the energy consumption due to the tyre/road interaction, by selection of pavements with lower rolling resistance – and hence lowering CO2 emissions and increasing energy efficiency.
A first phase of the project will contribute with investigation of pavement characteristics, energy efficiency, modelling, and raising awareness of the project in order to secure econo-mical and political support for a second phase. The second phase will focus on development and implementation of CO2 controlling models into the road infrastructure asset management
systems.
The website of MIRIAM is http://www.miriam-co2.net/ where extensive project information can be found.
MIRIAM has been divided into five sub-projects (SP), of which SP 1 is "Measurement methods and surface properties model".
Acknowledgements and disclaimer
It is gratefully acknowledged that the production of this report has been funded by the following organizations (in alphabetical order):
Austrian Institute of Technology (AIT) Belgian Road Research Centre (BRRC)
California Department of Transportation (Caltrans) Danish Road Institute (DRI)
Federal Highway Research Institute (BASt)
Institut français des sciences et technologies des transports, de l'aménagement et des réseaux (IFSTTAR)
Swedish Road and Transport Research Institute (VTI) Swedish Transport Administration (STA)
Technical University of Gdansk (TUG)
The funding organizations have no responsibility for the contents of this report. Only the authors are responsible for the contents. Any views expressed are views of the authors only.
TABLE OF CONTENTS
SUMMARY VII
1 INTRODUCTION 1
2 PURPOSE, LIMITATIONS AND CONCEPT 2
3 TERMINOLOGY AND DEFINITIONS 3
3.1 Energy consumption of vehicles in operation and its sources 3
3.2 Discussion of the concept of rolling resistance 5
3.3 Physical measures representing rolling resistance 6
3.4 The various contributors to rolling resistance and related mechanisms 7
3.4.1 Sources and mechanisms – general 7
3.4.2 Energy losses in tyres 7
3.4.3 Pavement-influencing tyre losses 9
3.4.4 Energy losses in pavements 11
3.4.5 Bearings 11
3.4.6 Tyre rotation aerodynamic losses 11
3.4.7 Tyre aerodynamic drag 11
3.4.8 Suspension 12
3.5 Problems with the present rolling resistance concept and measure 12
3.6
12 Discussion regarding measured contributions to energy losses and resistances with the methods employed in MIRIAM
3.7 Suggested terminology and definitions 13
4 VARIABLES AND PARAMETERS AFFECTING ROLLING RESISTANCE 17
4.1 Tyre properties 17
4.1.1 Tyre internal properties 17
4.1.2 Tyre external properties (dimensions) 17
4.1.3 Tyre speed category 19
4.1.4 Tyre rubber compound and rubber hardness 19
4.1.5 Tyre condition 20
4.1.6 Tyre rolling speed 21
4.1.7 Tyre load and inflation pressure 22
4.1.8 Tyre slip angle 22
4.2 Road properties 23
4.2.1 Texture and unevenness – old data 23
4.2.2 Texture and unevenness – new data 25
4.2.3 Microtexture 26
4.2.4 Stiffness and internal pavement losses 27
4.2.5 Road rutting, crosslope, curves and gradient 28
4.2.6 Road condition 28
4.2.7 Survey of rolling resistance of 40 Dutch test track surfaces 28
4.3 Bearing properties and condition 29
4.4 Suspension properties and condition 29
4.5 Temperature influence 31
5 ROLLING RESISTANCE CONTRIBUTION TO VEHICLE ENERGY CONSUMPTION 33
5.2 Example of various contributions to the driving resistance 33
5.3 Example of Return Factors 35
6
37 REFLECTIONS AND OBSERVATIONS ON ROLLING RESISTANCE MEASUREMENT AND
MODELLING FROM THE ECRPD PROJECT
6.1 Introduction and objective 37
6.2 Problems to address 38
6.3 What to include and not include in a tyre/road rolling resistance model 42
7 MEASUREMENT METHODS - GENERAL 44
7.1 Rolling resistance 44
7.2 Test objects: tyres or pavements? 44
7.3 Measurement of pavement-related parameters 44
8 MEASUREMENT METHODS – STANDARDS 47
8.1 Introduction 47
8.2 SAE 49
8.2.1
49 SAE J1269: Rolling resistance measurement procedure for passenger car, light truck, and highway truck and bus tires
8.2.2 SAE J2452: Stepwise coastdown methodology for measuring tire rolling resistance 49
8.3 ISO 49
8.3.1 Past and present ISO standards 49
8.3.2
50 ISO 18164:2005: Passenger car, truck, bus and motorcycle tyres — Methods of measuring rolling resistance
8.3.3
50 ISO 28580:2009: Passenger car, truck and bus tyres — Methods of measuring rolling resistance — Single point test and correlation of measurement results
8.4 Other standards 50
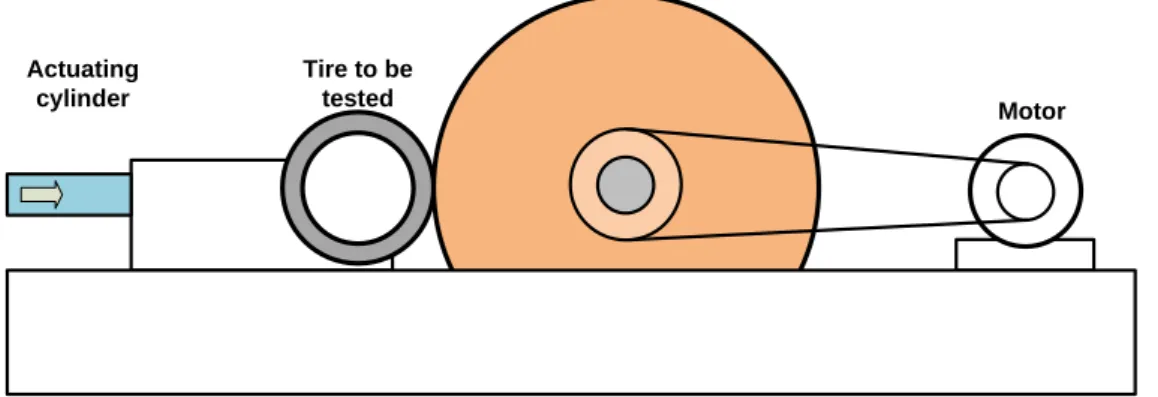
9 MEASUREMENT METHODS AND EQUIPMENT – LABORATORY DRUM 51
9.1 Measurements at BASt, Germany 51
9.1.1 General 51
9.1.2
51 Description of the test procedure for rolling resistance measurements of truck tyres (procedure used at the PFF with the coastdown method)
9.1.3
53 Description of the test procedure for rolling resistance measurements of passenger car tyres
(procedure at the PFF with the direct force measurement)
9.2 Measurements at TÜV, Germany 55
9.3 Measurements at TUG, Poland 55
9.3.1 General 55
9.3.2 Measurement procedure 57
9.4 Drum surfaces 57
9.5 Effect of drum curvature 59
9.6 Measurements at ika / RWTH Aachen University, Germany 59
9.7 Laboratory facilities at other places 60
10 MEASUREMENT METHODS AND EQUIPMENT – TRAILER METHOD 61
10.1 General about the trailer method 61
10.2 The TUG trailer 62
10.4 The BRRC trailer 65
10.5 The BRRC measurement method 67
10.6 The BASt trailer 67
10.7 The BASt measurement method 69
10.7 The IPW truck trailer 69
10.8 The IPW truck trailer measurement method 70
10.9 The Mobile Tyre Test Rig at ika / RWTH Aachen University 71
11 MEASUREMENT METHODS – COASTDOWN METHOD 73
11.1 Historical remarks 73
11.2 Basic idea 73
11.3 Characteristic features of the method 74
11.4 Mathematical models 75
11.4.1Model assumptions 75
11.4.2Equations 76
11.4.3A variety of possibilities 76
11.5 Measurement setup in MIRIAM 76
11.5.1Selection of test roads 76
11.5.2Road data measurements 77
11.5.3Measurement equipment for coastdowns 77
11.5.4Coastdown measurements 78
11.5.5Data analyses 79
11.6 Difficulties and problems 79
11.7 Other coastdown equipment 80
12 MEASUREMENT METHODS – FUEL CONSUMPTION METHOD 81
13 MEASUREMENT METHODS – REFERENCE TYRES 82
13.1 Desired and actual properties 82
13.2 Market tyres used as temporary references 83
14 MEASUREMENT METHODS – REFERENCE SURFACES 84
14.1 General 84
14.2 ISO laboratory drum surfaces 85
15 CORRELATION BETWEEN MEASUREMENT METHODS AND EQUIPMENT 86
15.1 The laboratory drum methods 86
15.2 The trailer and drum methods 86
15.3 Comparison of RR measuring equipment in the IPG project 87
15.4 Planned round robin test (RRT) in the MIRIAM project 91
16 LEGISLATION AND OFFICIAL REQUIREMENTS 92
17 ROLLING RESISTANCE ISSUES OF INTEREST IN FURTHER MIRIAM WORK 94
18 CONCLUSIONS AND RECOMMENDATIONS 96
19 LITERATURE 98
SUMMARY
MIRIAM has established a sub-project (SP), designated SP 1, to deal with measurement methods for rolling resistance and related issues. This subject forms the most fundamental basis for the MIRIAM ambition to consider rolling resistance in pavement management or other types of infrastructure systems. Without robust measurement methods and equipment that can use them there will be no reliable data as input to such systems and the end result will be most uncertain, if useful at all.
In order to develop and study measurement methods, there must be a basic understanding of the influencing parameters as well as what energy losses that should be included in the concept of rolling resistance. These issues are, therefore, important parts of the work in SP 1. This report is intended to provide basic knowledge about the part of the tyre and road inter-action which relates to rolling resistance; for example, the mechanisms that create rolling resistance, and the influence on rolling resistance of various tyre and road parameters. The intention is also to suggest a definition of rolling resistance for the purposes of this project, as well as to provide some detailed state-of-the-art knowledge about the measurement methods and equipment that are useful for collecting rolling resistance data.
It is first observed that rolling resistance is the result of an interaction between tyre and road surface, even including the deeper parts of the wearing course and the base layer. Therefore, tyres and road surfaces should not be tested without considering this interaction; thus using realistic (real) tyres and road surfaces. Although laboratory measurements are very convenient and desirable, such methods must always be based on validations made on real roads or test tracks.
Other major conclusions and recommendations are:
All kinds of rolling resistance measurements are complicated and subject to many potential problems and sources of errors
Tyre rolling resistance test methods, designed for tyres and standardized by ISO and SAE, lack consideration of realistic road surfaces
Standard test methods are available only for testing tyre rolling resistance in laboratories (SAE and ISO methods)
Standard methods for testing rolling resistance related to road pavements must be developed Road parameters that clearly affect rolling resistance include MPD and IRI
There are indications that also pavement stiffness is a factor that must be considered
There are microslippage (stick-slip) effects in the tyre/road interaction that calls for considera-tion also of road surface microtexture (dry and wet fricconsidera-tion)
Road surface conditions, such as rutting, wetness (water depth) and snow cover affect rolling resistance
For road management purposes one cannot rely on direct measurements of rolling resis-tance; it is better to develop a model by which rolling resistance can be predicted from collected road pavement data, the latter of which is already made to a large extent in many European countries
A tyre/road interaction model for rolling resistance must include a great number of road pavements, conditions and geometrical parameters
Two main methods are used for testing rolling resistance related to road pavements: the trailer method and the coastdown method
MIRIAM has access to three different trailers for car tyres and one for truck tyres. All of them have unique features which are not fully compatible. It is recommended to conduct one or more round robin tests to compare these devices and methods
There is a lack of reference surfaces for rolling resistance measurements of tyres and reference tyres for rolling resistance measurements of road surfaces. It is recommended to work out specifications for such in MIRIAM. One may then start by considering the use of the same reference tyres and reference surface as used for noise as one possible option.
1 INTRODUCTION
In 1979, a report of the French Ministry of Transport established that less than 10 % of the annual energy spent in the road field was used for construction and maintenance of infrastructures and more than 90 % was consumed by users of the same infrastructure; i.e. mainly by the road traffic [Anon., 1979]. Similar conclusions were drawn by the Energy Conservation in Road Pavement Design (ECRPD) project much later [ECRPD, 2010]. This suggests that an investment on road construction and maintenance, that has a substantial effect on road user costs, has a potential to give a very positive return for society. If this return is positive not only in monetary terms but also in environmental terms, the benefits of such investments may be substantial.
As expressed in the foreword, project MIRIAM has identified pavement rolling resistance properties as having a favourable potential for turning a small or moderate investment in pavement construction into a huge benefit for society in both economic and environmental terms.
A major purpose with project MIRIAM is to develop a model that will describe the effect of pavement surface properties on energy consumption and CO2 emissions and, further, to
make the data from the model useful in pavement management systems with a view to more effectively reduce energy consumption in road transport. This requires relevant and reason-ably accurate data about the rolling resistance of the tyre/road system. Such data will be available only if there are robust measurement methods to collect them. These methods must be relevant for their purpose, repeatable, reproducible and accurate; and also reasonably practical to use. Usually, such methods are defined and described in measure-ment standards; preferably international standards, as only international methods will have a wide acceptance.
The present situation is that there are international methods (ISO), and also some industry-related methods (SAE), for measurement of the rolling resistance properties of tyres. These are indoor laboratory methods in which tyres are rolled on drums having an extremely smooth surface. For outdoor use and with the purpose to measure the rolling resistance properties of road surfaces, there is no standard method available. Consequently, there are no standards or widely accepted methods available for collecting the rolling resistance data of road surfaces that are needed as an input for pavement managing systems. Further, there is no knowledge about how representative the laboratory drum measurements according to ISO and SAE are in relation to road conditions with the various textures and unevenness that naturally exist on roads, which is totally different from the ideal smooth steel or sandpaper surfaces used in accordance with the present standards.
Therefore, MIRIAM has established a sub-project (SP), designated SP 1, to deal with measurement methods for rolling resistance, and related issues. This subject forms the most fundamental basis for the MIRIAM ambition to consider rolling resistance in pavement management or other types of infrastructure systems. Without robust measurement methods and equipment that can use them there will be no reliable data as input to such systems and the end result will be most uncertain, if useful at all.
In order to develop and study measurement methods, there must be a basic understanding of the influencing parameters as well as what energy losses that should be included in the concept of rolling resistance. These issues are, therefore, important parts of the work in SP 1. This report is intended to provide basic knowledge about the influence on rolling resistance of various parameters, suggest a definition of rolling resistance and provide some detailed state-of-the-art knowledge about the measurement methods and equipment that are useful for collecting rolling resistance data.
2 PURPOSE, LIMITATIONS AND CONCEPT
The purpose of this report is fourfold: to provide a review and discussion of terminology and definitions, ending in a sug-gested definition with regard to rolling resistance of tyres interacting with pavements to provide basic and up-to-date knowledge about the influence on rolling resistance of
various parameters
to provide a comprehensive review and discussion with regard to measurement methods, and
to provide a comprehensive review of available measurement equipment; especially of potential use in MIRIAM.
Other issues than those listed above are treated here only in a condensed form, with the aim to give a basic background for the measurement methods.
It is very important to note that rolling resistance is an interaction between tyre and road, although for the purpose of serving MIRIAM, this project has its focus on the road surface contribution.
The concept behind this report is the following:
Rolling resistance is one of the most important functional properties of road pave-ments, applicable to the entire road network, which means that road authorities need to have information about it and be able to control it
The relative importance of rolling resistance is increasing with time as it affects our energy consumption and the emission of greenhouse gases, while newer vehicle technologies such as electric and hybrid vehicles are more sensitive to this parameter than the present vehicle fleet
The measurement of rolling resistance is very difficult and requires the use of rather advanced equipment and methodology, operated by very skilled and experienced staff; consequently, direct measurement of rolling resistance is possible only on a very small part of the road network
A more practical way of controlling rolling resistance for road management purposes than directly measuring it, is to predict it from road pavement parameters that are already collected for most of the road network, such as texture, unevenness, stiffness and road topography
Therefore, this report has a focus on rolling resistance modelling and related issues For modelling purposes this report includes large sections on generation of rolling
resistance, tyre and road interaction, road pavement parameter influence and collection of data necessary to model rolling resistance based on the relevant road pavement parameters
3 TERMINOLOGY AND DEFINITIONS
3.1 Energy consumption of vehicles in operation and its sources
The movement of road vehicles requires that the power unit(s) of the vehicle overcome the "resistance to movement" which is due to the following forces [Michelin, 2003]:
rolling resistance forces aerodynamic forces
inertial forces (when accelerating) internal frictional forces
gravitational forces (driving in slopes) An illustration is shown in Figure 3.1.
Figure 3.1: The various forces acting on the vehicle, which must be overcome to keep the vehicle moving. Illustration by kind courtesy of Mr Stefan Köppen of Goodyear [Köppen, 2009] (not yet granted).
In this report, we prefer to use the term "driving resistance" instead of the longer "resistance to movement". A slightly different description of "driving resistance" is presented in [Hammar-ström et al, 2009] as the sum of the following:
rolling resistance air resistance inertial resistance gradient resistance side force resistance transmission losses
losses from the use of auxiliary equipment engine friction
Here, gradient resistance is the same as gravitational forces in the Michelin definition, and transmission losses and engine friction corresponds to internal frictional forces. Side forces (driving in curves) are not mentioned in the Michelin list, but are probably assumed to be counted as part of rolling resistance as they are essentially appearing in the tyres. Losses from using auxiliary equipment (fans, generator, servos, air condition, radio, cd player, etc) are neglected in the Michelin list.
Neither of the lists above mentions shock absorber losses in the vehicle suspension system. Such losses are far from negligible on real roads. Possibly, they might be included in the term "internal friction" used by Michelin.
Based on the discussion above, and with the aim of not mixing forces, losses and resistance, in this report it is suggested to divide the driving resistance into the following parts (with some explaining terms added in Italics):
rolling resistance (forces opposing the rolling of the tyres)
side force resistance, an extra contribution to the rolling resistance (sideway forces
when driving in curves or poorly adjusted camber angle)
suspension resistance (forces needed to overcome the frictional losses in the shock
absorbers and pumping oil through small valves between different chambers (heating))
aerodynamic resistance (also called aerodynamic drag or simply air drag; forces
opposing the movement of the vehicle through the air)
inertial resistance (forces opposing the acceleration of the vehicle, the product of
acceleration and vehicle mass, or braking forces when decelerating, or forces from accelerating or decelerating rotating vehicle masses, especially during urban driving)
gravitational resistance (forces needed to overcome driving uphill or released when
driving downhill)
transmission resistance, includes one part which rotates with the engine and another part which rotates with the tyres, separated by means of a clutch or corresponding component (forces needed to overcome the frictional or inertial losses in the
transmission system (drive train))
engine resistance (forces needed to overcome the frictional or inertial losses in the
engine) (includes many subcomponents)
auxiliary equipment resistance (forces needed to overcome the power consumed by
vehicle equipment such as fans, generator, servos, air condition, radio, CD player, etc)
The side forces would also include the forces on the tyre when driving on the edge of a rut in the pavement. It may also be argued that side forces and/or suspension resistance should be part of rolling resistance rather than separate items. A discussion of these and other issues related to definition of rolling resistance follows in the coming sections.
To overcome the driving resistance, the engine (or electric motors in case of electric vehicles) must deliver a power which is converted from the energy contained in the fuel or the battery. The driving resistance is influenced by numerous effects, some of which can also in turn be influenced by the design of the road infrastructure. For example, longitudinal unevenness of the road will induce suspension losses and influence the energy consumption. Gravitational resistance is related to the layout of the road in the vertical dimension while side force resistance depends on the road layout in the horizontal dimension. In mountainous regions gradient resistance, and also side force resistance (serpentine-shaped road layouts), can easily become the dominant components of driving resistance. Moreover, the road layout
governs the possible speed patterns and driver reactions, which in turn determine the level of tyre/road interaction effects and consequently rolling resistance.
The overall driving resistance system is more complicated than may seem apparent from the list above, since many of the various resistance components interact with each other, and some of them, for example air drag, are even non-linear. Any model describing the system, therefore, becomes complicated.
3.2 Discussion of the concept of rolling resistance
A very elegant illustration and description of how rolling resistance is created, either as a force acting opposite to the tyre movement along the road surface, or as a torque acting opposite to the tyre rotation, appears on page 12 in [Michelin, 2003]. Due to copyrights this cannot be reproduced here.
Rolling resistance has historically been considered as a force that opposes a tyre travelling in a particular direction. As pointed out in The Pneumatic Tire, a book commissioned and published by the US National Highway Traffic Safety Administration (NHTSA), some researchers find this concept unsatisfactory when a tyre rolls on a non-flat surface [Gent et al, 2005]. In the book by Gent et al, rolling resistance is defined as:
“… the effort required to keep a given tire rolling. … Rolling resistance includes mechanical energy losses due to aerodynamic drag associated with rolling, friction between the tire and road and between the tire and rim, and energy losses taking place within the structure of the tire.” [Page 514]
From this point of view, rolling resistance is more appropriately defined in terms of energy, because many of its components are energy-related. For example, Schuring defines rolling resistance as a loss of mechanical energy [Schuring, 1977]:
“Rolling [resistance] is the mechanical energy converted into heat by a tire moving for a unit distance on the roadway.” [Page 31]
It is also emphasized in The Pneumatic Tire that rolling resistance is often calculated from the tyre-operating and shape parameters and cannot correspond to an actual physical force, so it should be measured as energy loss per distance travelled [Gent et al, 2005]. This conception is advantageous because it reflects the true situation in vehicles and it is directly related to vehicle fuel efficiency. Although the units used to define rolling resistance in these two systems are dimensionally equivalent (Newton versus Joule/Meter), Joule/Meter is more appropriate because rolling resistance is an energy (scalar) not a force (vector) [Schuring & Futamura, 1990].
This energy-based definition for rolling resistance is reflected in recent test standards, such as SAE J2452 and ISO 28580:2009 where rolling resistance is defined as the energy loss per distance travelled. In ISO 28580 rolling resistance (RR) is defined as "Loss of energy (or energy consumed) per unit of distance travelled" [ISO 28580, 2009]. Although not clearly expressed, it is assumed that it is intended that the losses concerned are losses occurring only in the tyres, as this standard is part of a series of tyre standards. Apart from losses in the tyre itself there are certain losses which occur very close to the tyre and which are difficult to distinguish from clear tyre losses when making measurements. These are called "parasitic losses".
Rolling resistance is caused by an interaction between tyre and road and therefore it is necessary to take both parts into consideration. In the SAE and ISO standards, this matter is neglected as testing is made either on a smooth steel drum or such a surface covered with sand paper.
Road surface texture creates local deflections in the tyre which causes extra energy losses in the tyre if the tyre rubber is not free of hysteresis. In extreme cases, this texture effect may
be equally large as the energy losses in the tyre measured on a flat and completely smooth surface. Some rolling losses are even consumed in the road or pavement rather than in the tyre; a fact which is totally neglected in the mentioned standards. Stones in the road surface may move a little tangentially under the forces of the tyre and the surface may deflect somewhat vertically (or rather radially) under the tyre load; two types of deflection which consume some energy if they are not totally elastic.
If the ISO definition is accepted, it would (probably unintendedly?) include also the aero-dynamic resistance of the tyre, as this resistance creates a loss of energy related to the tyre. The physical dimension of the tyre would then be the important factor; especially the width and height/radius. This is a part of the total losses due to the tyres which is far from negligible at high speeds. However, the SAE and ISO standards do not take such losses into account; despite they would fall within the definition. Measuring this effect in connection with a laboratory drum facility would require some sort of extra wind tunnel.
From a road engineering point of view, an effect of the road surface is the vertical or near vertical vibrations of the tyre/wheel/suspension assembly caused by road unevenness. The energy losses from this may to some extent occur due to extra deflections in the tyre, but more so as energy conversion (to heat) in the shock absorbers. With certain measurement methods it is difficult to separate the shock absorber losses from the rolling resistance losses and some might argue that it is practical and justified to include shock absorber losses into rolling resistance as it is caused by the tyre rolling action. It would not occur without rolling. Unfortunately, the same applies to parts of the transmission in a vehicle. More about this will follow below.
The list of various driving resistances in 3.2 may equally well be transformed to a list of corresponding energy losses, related to the same phenomena, should one prefer to use energy rather than forces to define driving resistances.
3.3 Physical measures representing rolling resistance
A practical definition of rolling resistance must consider what kind of physical measure that can be used to measure this variable.
Energy does not appear to be a practical physical measure to use in an RR measurement standard. For example, measuring heat dissipation in a tyre, although not impossible, seems impractical.
The most relevant measure, also practical to use, seems to be something based on the force (Frr) that is required to move the rolling tyre in the desired direction. However, it is clear that
this force will depend on the load that is applied to the wheel and thus the tyre.
Studies have found an approximately linear relation between rolling resistance and wheel load, represented by a force Fz (equal to the mass m of the load times the gravitational
constant g). Since wheel loads can vary under different conditions, a near-constant coefficient, rolling resistance coefficient, RRC or Cr (both terms are commonly used), has been created to represent the characteristic of tyre/road rolling resistance: the dimensionless ratio of rolling resistance to wheel load: RRC = Cr = Frr/Fz. ISO 28580 uses the notion Cr.
Thus:
Rolling resistance coefficient (RRC) = Cr = Frr/Fz
where the forces Frr and Fz (see the preceding paragraphs) are magnitudes and not vectors.
This coefficient in turn depends on several tyre and road surface parameters as well as (to some extent) the vehicle speed. It is important to note that the RRC or Cr is a relative measure. It can be used to compare tyres and pavements.
Typical values of Cr for tyres in new condition are in the range 0.006 to 0.015 for passenger car tyres, and 0.004 to 0.012 for heavy truck tyres [FEHRL, 2006-1][FEHRL, 2006-2]. It is substantially lower for heavy vehicle tyres than for light vehicle tyres, not the least due to the higher inflation.
3.4 The various contributors to rolling resistance and related mechanisms
3.4.1 Sources and mechanisms – generalIn and around the tyre there are several types of energy losses. The following is an attempt to list those which are of interest:
Tyre losses (due to the tyre/road interaction; several mechanisms) Pavement losses (in the pavement itself)
Bearing frictional losses
Tyre rotational aerodynamic resistance
Tyre drag (aerodynamic resistance when moving through the air) Suspension losses
As mentioned above, rolling resistance (RR) is defined by ISO as "Loss of energy (or energy consumed) per unit of distance travelled" [ISO 28580, 2009]. This standard also defines a family of energy losses called "Parasitic losses" as: "Loss of energy (or energy consumed) per unit of distance excluding internal tyre losses, and attributable to aerodynamic loss of the different rotating elements of the test equipment, bearing friction and other sources of systematic loss which may be inherent in the measurement." These, which are present but unwanted in measurements according to ISO 28580, include the following losses:
tyre spindle friction
measurement drum aerodynamic and bearing losses
tyre and wheel aerodynamic losses (due to air pulled around by the rotating tyre in
the still surrounding air)
bearing friction (bearing between wheel and axle)
The two first ones are special to the drum measurement method; the two last ones are more general.
3.4.2 Energy losses in tyres
The rolling resistance is caused by the deflection and deformation of the tyre during the rolling and the hysteresis of tyre rubber and tyre structure. Rubber compounds exhibit a combination of viscous and elastic behaviour: they are visco-elastic materials. Each time rubber elements are deformed due to some force, if they do not entirely recover their original shape, i.e. if they are not totally elastic, they dissipate energy (heat). When a load is removed some of its stored energy is recovered while the rest is converted to heat, which creates energy loss. The lack of recovery is known as a hysteresis effect, as illustrated in Figure 2. The area enclosed in the loop is known as hysteretic losses. Rubber compound, tyre construction and tyre operation affect the hysteresis property of tyres.
Rubber behaves like a gas. When a rubber band is stretched it heats up. When it is released, the rubber cools down. There is, therefore, a hysteresis component from the thermal ex-change with the ambient environment and another hysteresis component due to internal friction within the rubber1.
For a pneumatic tyre, the tyre load is mainly carried by the air contained in the tyre; and to a much lesser extent by the tyre structure. When the tyre is loaded onto a flat surface, the contact area is flattened, and the edges of the contact patch are deformed from their unloaded shape according to the flexibility and stiffness of the rubber tread, the tyre sidewall and the internal tyre structure. The most dramatic deformations occur in the leading and trailing edges of the contact patch. In addition, parts of the tread rubber are compressed and expanded, and exposed to stick-slip motions in the contact patch.
Figure 3.2: Illustration of the elastic hystere-sis effect. From Johannes Bedenbender in Wikimedia Commons
(http://en.wikipedia.org/wiki/Hysteresis#Elastic_hysteresis).
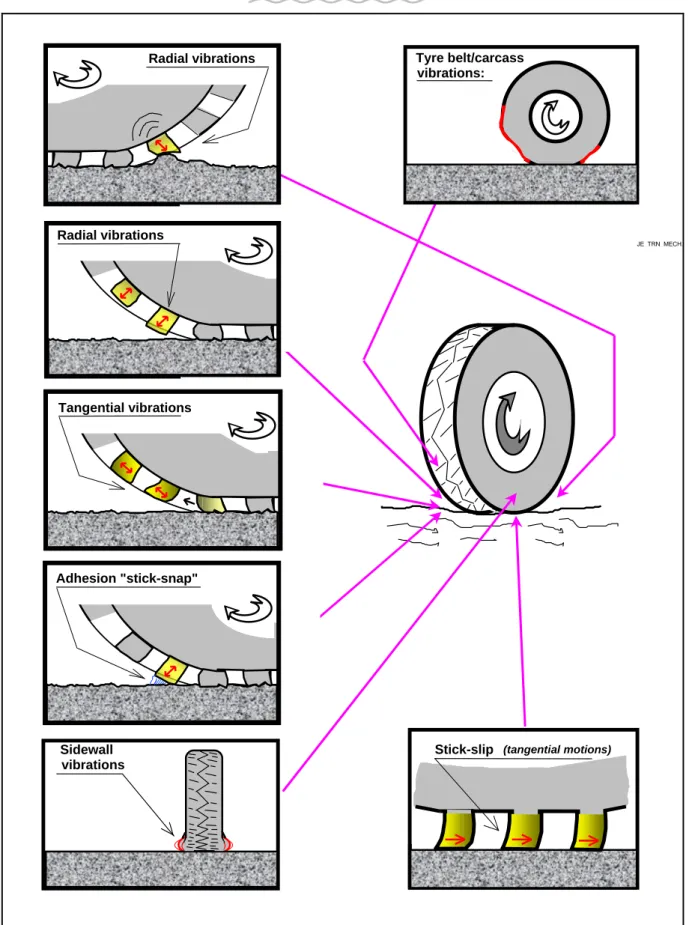
The different types of tyre deflection and energy losses which occur are as follows (see also Fig. 3.3 which illustrates most of the mechanisms):
The loading of the tyre will make the contact patch essentially flat; with a very abrupt change of the shape (bending) of the tread at the leading and trailing edges, and also in the tyre shoulder region
The above deflection (flattening) due to the loading will cause the tyre sidewalls to "bulb out" from their unloaded uniform shape
The flattening mentioned above may be reduced if the pavement under the contact patch is not totally stiff but has some flexibility. Some of the deformation in the tyre will then instead take place in the pavement
Depending on the contact pressure, tread rubber elements will be compressed and expanded when the element is released from its loaded state
Depending on the contact pressure and the texture of the road surface in the contact patch penetrating into the tread, tread rubber will be compressed and expanded During driving, the static load will have a modulating component due to the road
and/or tyre unevenness (or tyre unbalance) which will cause the tyre to "bounce" up and down, causing more or less flattening on the contact patch (contact area changes) and corresponding tyre deflection from the shape at the stationary load. Part of the energy due to this movement will be consumed in the shock absorber Tread elements will be deflected in the horizontal and lateral directions due to
stick-slip actions in the tyre/road interface. Another term often used is "microstick-slippage" When the tyre is driving or braking, the stick-slip forces become higher and there will
Caused by stick-slip motions, mainly the slip, tyre rubber particles may be worn off the tyre; in which case it is not so much a deflection that causes the energy loss but the braking of molecular bonds
The breaking-up of molecular bonds may cause another type of deflection, namely at the trailing edge of the contact patch, the adhesion between the tyre rubber and the road surface will need a certain (very small but probably not negligible) force to break the molecular bonds, and thus there will be a small deflection due to the "stick-snap" action
If the tyre is subject to side forces, such as when turning or driving in a curve, or under misalignment, there will be deflections to take up the side forces along the contact patch and in the tyre areas close to the contact patch
If the tyre is running in water or snow, not only will gravitational energy be needed to displace the water or the snow from the tyre track, or to compress (or even melt) the snow, or to throw off the water from the tyre tread, but the forces needed to do so will create extra deflections in the tyre
These different types of deflection will affect tyre structure, tyre tread and various parts of the tyre rubber in different ways. It is known that most of the energy losses occur in the shoulder regions of the tyre where all the mentioned deflections occur, as opposed to some other parts of the tyre where perhaps only one or a few types of deflection occur. The shoulders also are thicker and contain more rubber than other parts of the tyre, which means that there is more mass to deflect.
As should be obvious from the list above, the tyre deflections and the resulting energy losses are extremely complicated. The same applies to sound generation, where the same deflec-tions are active, although sound generation also have substantial aerodynamic components and thus are even more complex [Sandberg & Ejsmont, 2002].
3.4.3 Pavement-influencing tyre losses
As stressed above, rolling resistance is a result of an interaction between tyre and pavement, and it is really difficult to distinguish between effects in the tyre and in the pavement. Some losses in the tyres are very much affected by pavement properties, and therefore are listed separately here. At least three effects are of interest:
Road unevenness will cause the tyre to be moved up and down and the corre-sponding forces will create a change in the tyre deflections
Road texture will create local deflections and shearing of the tread in the contact area, which results in forces; mainly but not only in the vertical direction
Deflection of the pavement under the tyre load is not negligible, at least not for bitumi-nous pavements. When the pavement is deflected, the tyre deflection is smaller than if the pavement were perfectly stiff. More pavement deflection means less tyre deflection which reduces tyre losses
Microtexture of the road surface will affect the stick-slip and stick-snap motions mentioned above, and also the rubber particle loss (may be either a positive or a negative influence). According to [Wong, 1993] 2-10 % of the rolling resistance is caused by friction between the tyre and the road, thus the effect is not negligible. Ruts in the pavement will create side forces increasing the tyre losses.
Stick-slip (tangential motions) Tyre belt/carcass vibrations: Sidewall vibrations JE_TRN_MECH. Radial vibrations Radial vibrations Tangential vibrations Adhesion "stick-snap"
Fig. 3.3: Illustration of the rolling resistance generation mechanisms which are due to tyre deflections. From [Sandberg & Ejsmont, 2002].
3.4.4 Energy losses in pavements
Rolling resistance losses may occur not only in the tyre but also in the pavement. At least three effects are of interest here:
The aggregate (stones) in the road surface may move a little under the tangential (stick-slip) forces of the tyre; especially when the tyre is driven or braked
The pavement may deflect somewhat under the tyre load. This is a documented effect for non-paved and paved roads with weak base-course [Jamieson & Cenek, 2002] and may be important also for some asphalt roads under certain conditions Provided there are energy losses in the pavement, the pavement deflection will
contain a component which is stronger in front of the tyre than behind it, leading to a "wave" travelling in the pavement in front of the contact patch
Not only will the tyre lose some material; under some circumstances also the road surface will lose particles, and sometimes there might even be cracking; also these events require energy
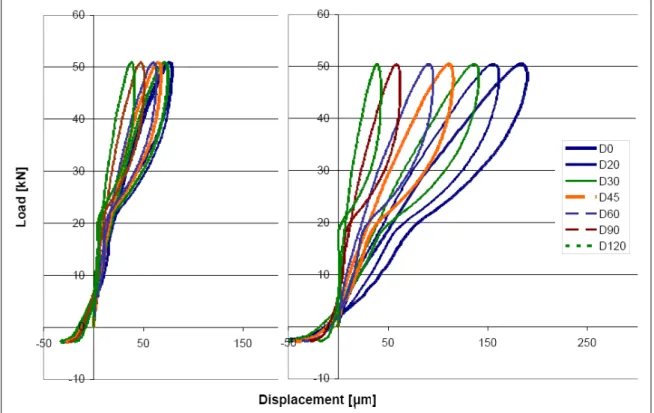
In the three first cases, hysteresis effects are present which mean that a deformation or deflection is not fully recovered and thus some of the energy will be converted to heat. An illustration of the hysteresis curves for three different pavement types appear later in this report.
3.4.5 Bearings
In principle, there is always some friction in bearings, even in ball bearings. However, wheel bearings in good condition should have negligible RR, but one cannot exclude the possibility of some influence, which is the reason why bearing losses are included in the so-called parasitic losses mentioned in 3.4.1.
3.4.6 Tyre rotation aerodynamic losses
The rotation of the tyre and its rim will inevitably pull some air with it, which causes friction in the air and thus causes aerodynamic losses. The tread pattern will have an influence of this, as it may more or less "grab" and pull air around. At normal speeds and with reasonably well designed rims this aerodynamic contribution should be small.
3.4.7 Tyre aerodynamic drag
When tyres roll on roads they have to displace some air. This causes aerodynamic drag on the tyres, which depends on the dimensions of the tyre. The most important parameter is the "projected frontal area" (cross-section area) perpendicular to the direction of rolling, but there is also a shape coefficient CD. The frontal area is usually around 2 m2 for cars and 9.5 m2 for
trucks. For two car tyres 225/55R16, the frontal area (below car underbody) is approx. 0.13 m2 which is 5-10 % of the total car frontal area, but as probably2 the C
D is higher for a
modern tyre than for a modern car, one should consider the tyre air drag as something in the order of 10 % of the total car air drag. Comparing the frontal area of tyres having a load index of 95, the area of a 275/35R18 (extreme low profile wide tyre) is 30 % higher than that of a tyre 205/75R14, mentioned as an example. It means that tyre air drag cannot be neglected; not even the difference in air drag between tyres for the same load.
3.4.8 Suspension
An unavoidable effect of the road surface is the vertical or near vertical vibrations of the tyre/wheel/suspension assembly caused by road unevenness. The energy losses from this may to some extent occur due to extra deflections in the tyre, but more so as energy conversion (to heat) in the shock absorbers. With certain measurement methods it is difficult to separate the shock absorber losses from the rolling resistance losses and some might argue that it is practical and justified to include shock absorber losses into rolling resistance as it is caused by the tyre movement during rolling on an uneven road.
3.5 Problems with the present rolling resistance concept and measure
The rolling resistance coefficient (RRC) was first developed to present a characterization of the rolling resistance of tyres because there is a near-linear relationship between rolling resistance and load, and the coefficient allows comparison across different tyres. However, an American study found that the way rolling resistance is normalized to RRC (force to keep the tyre rolling divided by the vertical load) was not consistent over a large range of tyre sizes and loads [Evans et al, 2009]. RRC tends to be relatively lower for larger tyre diameters than for small tyres, despite the fact that larger tyres are likely to consume more fuel. Given that rolling resistance is considered as an indicator of fuel economy, this problem will be particularly important when RRC is used in a rating system to categorize a wide range of tyres. Therefore, Evans et al argue that using the force instead of the coefficient might be better; in which case load will be a more important test parameter to control.
Given that it may not always be possible to use the same load when testing RR, and that the major reasons for tyres with larger diameters having lower RRC than smaller tyres are large differences in tyre inflation and internal construction, the authors of this report prefer to use the RRC as the crucial parameter when comparing tyres and pavements.
Another problem related to the current conception of rolling resistance, at least in standards, is the lack of a pavement perspective. One of the goals of the MIRIAM project is to correct that problem.
3.6 Discussion regarding measured contributions to energy losses and
resistances with the methods employed in MIRIAM
In the MIRIAM project, the following RR measurement methods will be used: The drum method (both for light and heavy vehicle tyres)
The coastdown method (both for light and heavy vehicle tyres)
The trailer method (mainly for light tyres, to a lesser extent also for heavy tyres) Possibly, also a fuel consumption method may be used, utilizing a complete vehicle These are described in a later chapter in this report. The drum method will be used for special studies, but not much to determine the relation between RRC and pavement characteristics, as it is a laboratory method where it is impractical to put many different pavements on the drum. The coastdown method will be used on a number of roads and for both light and heavy vehicles. The trailer method is the one that will be used most of all. The three first methods measure (pick-up) the various energy losses or rolling resistances according to Table 3.1.
Ideally, the coastdown method gives the most comprehensive data sets, relating to both light and heavy vehicles and their tyres. This data is needed in order to establish a good model for calculating the effect of pavement characteristics on energy consumption in road vehicles. However, to employ the coastdown method on a really large scale is not possible within reasonable budget limits. It is hoped that by using both the coastdown and the trailer
methods on a selection of pavements, it will be possible to measure all contributions to energy losses for a rolling vehicle on a limited selection of pavements (coastdown) and for a rolling tyre on a large number of pavements. By comparing the results, and creating some model based on them, it may be possible to distinguish between various important contributions. However, it must be realised that using the trailer method for heavy vehicles is impractical and will be possible only to a very limited extent.
These methodology issues are treated in much more detail in a following chapter, and are mentioned here only because they affect the data collection and the measures to use.
Table 3.1: Various loss/resistance contributions picked-up for a rolling test object by the three methods to be employed in MIRIAM.
Method Contributions picked-up by the method Notes
Drum
(laboratory facility)
Tyre losses (due to the tyre/road interaction) Parasitic losses are eliminated Pavement losses may be mea-sured only if realistic pavements are fitted on drum
Coastdown
(full vehicle)
Tyre losses (due to the tyre/road interaction) Pavement losses (in the pavement itself) Bearing frictional losses
Tyre rotational aerodynamic resistance Tyre air drag (when moving through the air) Suspension losses
Transmission losses (some) Air drag (full vehicle incl tyres)
This method measures all con-tributions when the test vehicle is rolling, from a higher to a lower speed
Air drag is eliminated by special calculations
The main problem is to isolate the parts
Trailer Tyre losses (due to the tyre/road interaction) Pavement losses (in the pavement itself) Bearing frictional losses
Tyre rotational aerodynamic resistance Suspension losses
Tyre air drag is not measured provided the test tyre is enclosed
Some suspension losses may occur, but will maybe not be typical ones, depending on type of suspension used in the trailer
3.7 Suggested terminology and definitions
Based on the discussions earlier in this chapter; including practical measurement concerns, it is suggested to use the following terminology structure and distinction between resistances at various levels in the vehicle driving system:
Level 1: (Vehicle) Driving resistance (DR)
includes:
(Vehicle) Propulsion resistance (PR)
(Vehicle) Aerodynamic resistance (air drag) (AR) Vehicle rolling resistance (RRv)
Level 2: (Vehicle) Propulsion resistance (PR)
includes:
Inertial resistance (IR)
Gravitational resistance (GR) Engine resistance (ER)
Auxiliary equipment resistance (AER)
Level 2: (Vehicle) Aerodynamic resistance (air drag) (AR)
includes:
Body air resistance (body air drag) (ARb) Tyre air resistance (tyre air drag) (ARt)
Level 2: Vehicle rolling resistance (RRv)
includes:
Tyre/road rolling resistance (RRt) Bearing resistance (BR)
Suspension resistance (SR)
Transmission resistance (incl parts rotating with the tyres) (TR)
Level 3: Tyre/road rolling resistance (RRt)
includes:
Tyre deflection (hysteresis) losses (due to the tyre/road interaction)
Tyre driving force resistance (extra losses when tyres are driven or braked) Tyre side force resistance (extra losses when tyres are subject to sideway forces) Pavement deflection (hysteresis) losses (in the pavement itself)
Tyre rotational aerodynamic resistance
Consistent with the structure above, Level 3 also includes the following components, which need not be further layered for the purposes of this report:
Level 3: Bearing resistance (BR) Level 3: Suspension resistance (SR)
Level 3: Transmission resistance (incl parts rotating with the tyres) (TR)
Fig. 3.4 illustrates this terminology structure, although the level 4 items have been neglected there.
It should be noted that the transmission resistance include two distinctive parts, not shown above but which may have different influences depending on whether the vehicle is coasting or driving, namely churning and mechanical losses. If the vehicle is coasting, the mechanical losses should be at a minimum as there is no power transfer, but both at coasting and driving there will be churning losses.
Inertial resistance
(Vehicle) Gravitational resistance
Propulsion resistance
Level 1 Level 2 Level 3
Fig. 3.4: Illustration of the suggested terminology structure (only the upper 3 levels). The placing of some of the items above may need justifications:
Body and tyre air resistances: Why make a distinction between these? The reason is
that these two depend on separate selections of vehicle body and tyres for the vehicle. When the vehicle is in new condition, the body and the tyres are of course one unit, as designed and selected by the vehicle manufacturer, but when tyres need to be exchanged the selection may be totally independent, possibly resulting in a change in the total air drag due to the new tyres.
Bearing resistance: Why is this not part of rolling resistance? The bearing of course
influences how easy the tyre will roll, but it must be treated as a separate item as it is a component which is totally different from the tyre.
Tyre rotational aerodynamic resistance: Why is this placed under rolling resistance
and not aerodynamic resistance? The reason is that this phenomenon is a tyre property, as determined by the design of tyre and especially its tread. It is also difficult to measure it distinctively from rolling resistance.
It may be argued that there might also be a component of air resistance due to turbu-lence in the rotating rim area. This effect is neglected here. If desired, that effect should be placed under "Vehicle rolling resistance", since it affects the rolling but it is not a tyre component.
With the structure and terminology listed above, the three methods will measure parameters according to Table 3.2.
Depending on trailer construction, and test wheel alignment, some trailers may, without inten-tion, measure some side forces. They will also be more or less sensitive to inertial or gravitational forces, depending on trailer and measurement system configurations. It will be important to keep these effects low, as well as to avoid the effects of bearing and trailer
(Vehicle) Driving resistance Vehicle rolling resistance (Vehicle) Aerodynamic resistance Engine resistance Auxiliary equipment resistance
Body air resistance Tyre air resistance Tyre/road rolling resistance
Bearing resistance
Transmission resist. (churning & mech.) Suspension resistance
suspension losses on the measured values, in order that the trailers will measure pure tyre/road rolling resistance. Another option may be to create and use a model for the contribution of various effects and by measuring all relevant parameters separate the effects for each measured case.
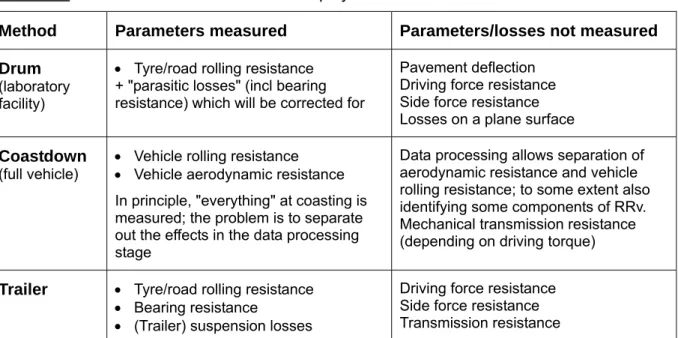
Table 3.2: What the three methods to be employed in MIRIAM will measure.
Method Parameters measured Parameters/losses not measured
Drum (laboratory facility)
Tyre/road rolling resistance + "parasitic losses" (incl bearing resistance) which will be corrected for
Pavement deflection Driving force resistance Side force resistance Losses on a plane surface Coastdown
(full vehicle)
Vehicle rolling resistance Vehicle aerodynamic resistance In principle, "everything" at coasting is measured; the problem is to separate out the effects in the data processing stage
Data processing allows separation of aerodynamic resistance and vehicle rolling resistance; to some extent also identifying some components of RRv. Mechanical transmission resistance (depending on driving torque) Trailer Tyre/road rolling resistance
Bearing resistance (Trailer) suspension losses
Driving force resistance Side force resistance Transmission resistance
The same applies to the drum method; the so called parasitic losses must be controlled (as ISO 28580 does). If one wants to receive as comparable values from drum and trailer methods as possible, one should treat bearing resistance, rim air resistance and tyre rotation air resistances in the same way, which requires breaking-up of the "parasitic losses".
The coastdown method will never be able to measure a "pure" tyre/road rolling resistance (as is the case also for the other methods). It will also be difficult to calculate the tyre/road rolling resistance, since it would require separating out the bearing resistance, suspension resistance and the two types of transmission resistance, which is very difficult. One possibility would be if the latter may be neglected, or estimated, in comparison to the tyre/road rolling resistance, an issue which should be studied in MIRIAM, by comparing vehicle and tyre/road rolling resistance.
It is concluded that the three methods will not measure identical things, but by using all three with different purposes, and by comparing results, it will be easier to model the energy consumption of full vehicles as influenced by choice of tyres and as influenced by various pavement properties.
4 VARIABLES AND PARAMETERS AFFECTING ROLLING
RESISTANCE
4.1 Tyre properties
4.1.1 Tyre internal properties
The internal structure of tyres consists of a carcass made of steel ("steel radial tyres") or textile wires, an inner lining made of some rubber compound, a belt made of metal with some extra reinforcing layers for the larger tyres, and an "undertread" made of rubber compound. Outside of the "undertread", there is the tread which is intended to provide the road contact and thus be the "wearing part", made of some rubber compound and having a pattern; mainly for drainage purposes. This outer part of the tread can be renewed (retreaded). The outside of the sidewalls is made of rubber too, but it is usually another type of compound than the tread rubber. The transition between tread and sidewall is called shoulder, and in this region there is extra thick rubber, where much of the energy is consumed. The part of the tyre that sits on the sidewalls is usually called the "crown".
The belt is made in a way that makes it incompressible and unstretchable. In the leading and trailing parts of the contact patch there is the maximum bending of the tyre crown. Since the belt is stiff it means that the rubber under the belt (inner lining) will be compressed and the rubber above the belt (the tread) will be expanded when a particular part of the crown passes through the leading and trailing edges during the tyre rotation. This compression and expansion of the rubber in the two layers around the belt will create hysteresis losses in the rubber, i.e. the energy is converted to heat.
It follows that the part of the inner structure that consumes energy is mainly the rubber and not the belt or carcass. To use low-hysteresis rubber is, therefore, crucial for low RR.
However, this is not to say that the carcass and the belt have no influence of RR. They will have an indirect influence, since the construction determined partly by these tyre compo-nents will affect, for example, the shape of the contact patch, which has an influence on stick-slip motions.
The authors have not found quantitative data on how the internal structure affects the rolling resistance. This is usually a matter of development and testing within the tyre industry and such information is rarely released outside the company doors.
4.1.2 Tyre external properties (dimensions)
Tyre dimensions have a substantial influence on rolling resistance. An interesting statistical multivariate analysis of which factors that seem to influence the measured RRC, based on 170 tyres, is presented in [TRB 286, 2006]. Table 4.1, copied from the TRB report, shows the main results. Here, the most interesting variable to look at is the t value since it shows how statistically significant the relation was found to be; the higher value the more significant was the parameter.
In this analysis, the following parameters came out as especially influential:
Rim diameter (which is highly correlated with tyre outer diameter), with t = 9.3 Aspect ratio (quotient of tyre height/tyre width), with t = 6.3
High speed rating (speed categories W, Y, Z), with t = 5.4 Tread depth, with t = 4.9.
Of these, the two most important ones are dimensional effects. It is reported that increasing rim diameter by 1 inch, or about 6.3 percent for the average tyre in the data set, reduces RRC by 5 to 8 % [TRB 286, 2006]. Since outer tyre diameter is approximately 65 % higher
than the rim diameter (an estimate from tyre data manuals), 6.3 % increase in rim diameter corresponds to roughly 4 % of outer tyre diameter increase.
Table 4.1: Result of a multiple regression analysis of RRC data for a set of 170 tyres tested in the USA, intended to study the effect of various tyre parameters (left column) on the RRC, with statistical significance shown in column "t". From [TRB 286, 2006].
Another example is shown in Fig. 4.1 which is from [Aimon, 2005]. Using the blue regression curve there, starting from diameter 650 mm, which gives an RRC of 0.010, if increasing diameter by 4 % (as in the TRB example above) to 676 mm, RRC is reduced to approx. 0.0096, which is a 4 % reduction. This is evidently a little lower than the TRB report found.
Fig. 4.1: Relation between tyre diameter and RRC (RRC expressed in kg/ton) for two speed classes (tyre speed categories S, T and H in blue and V and Z in red). From [Aimon, 2005].
In [Michelin, 2003] it is stated that 10 mm of increase in rim diameter reduces RRC by 1 %, and that 10 mm of increase in tyre sidewall height reduces RRC by 1 %. For an average tyre outer diameter of 650 mm, 10 mm increase corresponds to 1.5 %. If 1.5 % causes an RRC reduction of 1 %, then 4 % diameter increase should cause an RRC reduction of 2.7 %. Thus, the estimates reported above range from 2.7 % to 8 % of RRC reduction for a diameter increase of 4 %. This is a wide range which suggests that further research is needed.
In the ECRPD3 project the influence of tyre dimension is estimated with the equation:
RRC =k· OD1/3
where OD = tyre outer diameter. For example, if OD is increased by 4 % (as in the example by TRB above), RRC will decrease by 1.3 %, which seems to be only half of the lowest estimate above, which thus may need an adjustment.
4.1.3 Tyre speed category
In the TRB report mentioned above high speed category tyres came out of the multivariate analysis as having higher RRC [TRB 286, 2006]. Compared with tyres with lower speed ratings (S, T), tyres with the highest speed ratings (W, Y, Z) were found to have 10 to 22 % higher RRC, while tyres with middle speed ratings (H, V) had 1 to 9 % higher RRC.
The data from Fig. 1 also shows the influence of speed category. The higher ones (V and Z) give approx. 10 % higher RRC than the lower ones (S, T and H). This is a little higher than in the TRB report.
4.1.4 Tyre rubber compound and rubber hardness
It is widely recognized that the substantial improvements in rolling resistance achieved in the last two decades have been largely made due to the use of better rubber compounds. For example, the addition of silica has been favourable.
A study in Germany reported RRC reductions between 5 and 24 % when replacing carbon black with silica in car tyres, for three different brands in two tyre sizes [Glaeser, 2005]. A study at TUG using two tyres of the same brand, type and dimension but with rubber of two different stiffnesses showed approx. 8 % of RRC reduction for a Shore A hardness reduction from 71 to 62, as shown in Fig. 4.2.
Influence of tread rubber hardness on the rolling resistance coefficient (RRC) 0,0100 0,0105 0,0110 0,0115 0,0120 0,0125 0,0130 0,0135 0,0140 0,0145 0,0150 70 80 90 100 110 120 130 140 Speed [km/h] RR C [ ]
Hard rubber (71 Shore) Soft rubber (62 Shore)
Fig. 4.2: Difference in RRC between two tyres identical in all respects except tread rubber compound and hard-ness. Unpublished data from TUG.
4.1.5 Tyre condition
During a lifecycle a tyre undergoes degradations due to mechanical wear and chemical ageing which affect not only durability and safety but also tyre/road noise emission and rolling resistance. Therefore, any calculation involving long-term rolling resistance change needs to specify the conditions under which the coefficient is tested; among these the tread depth.
One of the results of the multi-regression analysis presented in the TRB report [TRB 286, 2006] was that tread depth affects RRC. It was found that a tread depth decrease of around 9 % gave an RRC reduction of around 4.3 %. This was for car tyres.
A few years ago, VTI, TUG and BASt made a study with the purpose to study how much tyre/road noise and rolling resistance change when car tyres are worn down from the original 8 mm tread depth to 2 mm, and when chemical ageing of the tyre rubber is simulated by exposure to heat. Six car tyres of different types were selected for the study, which were worn on a wear machine in steps of 2 mm tread depth. Before, between and after these wear sessions tyre/road noise and rolling resistance were measured on two drum facilities with different surface textures, including replicas of ISO surfaces.
The results showed that tyre wear and tread depth were found to have a dramatic effect on rolling resistance. When tyre treads are worn from new condition (8 mm) to 2 mm tread depth, the rolling resistance may decrease by about 20 %. The RRC changes (Cr on the ordinate axis) from new to worn out condition (8 vs 2 mm tread depth) are shown in Fig. 4.3.
Rolling resistance coefficient (Cr)
0,96 0,95 1,00 0,99 1,14 1,24 0,78 0,81 0,76 0,85 0,89 1,13 0,0 0,2 0,4 0,6 0,8 1,0 1,2 1,4 Continental Eco Contact Continental Premium Contact Continental Winter Contact Continental Sport Contact Pirelli PzeroNero Yokohama dB V550 Tyre Cr [%]
Tyres in new condition (full tread, 8 mm) Tyres in worn condition (2 mm tread depth)
Fig. 4.3: Results of the rolling resistance mea-surements on a plain steel 5.5 m drum of the BASt PFF facility, for the six tyres in new and fully worn condition. Copied from [Sandberg & Glaeser, 2008].
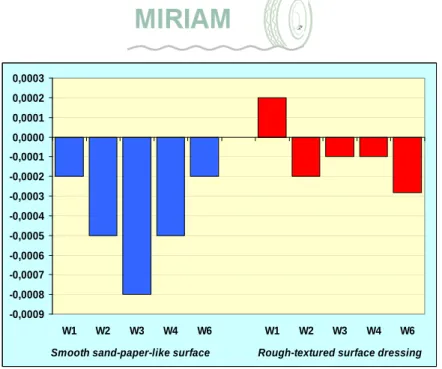
However, the data in Fig. 4.2 are for tyres in essentially new condition, except for the tread wear. The separate study on the effect of ageing is shown in Fig. 4.4. This ageing was simulated to correspond to the chemical changes over a normal tyre's lifetime.
Probably, the above effects of tread wear and ageing would be additive. Thus, the total effects from a new unworn to an old wornout tyre would be up to 30 %. Although this is a large affect, it does not seem to be as large as the one reported in [TRB 286, 2006].
Note that these data are only for car tyres. Truck tyres have approx. twice as thick treads as car tyres. For heavy truck tyres of typical sizes (22.5"), it has been reported that around 30 % of rolling resistance comes from the tread, according to measurements on a drum made by Nokian Tyres in Finland. Thus, if the tyre is totally worn the RR is 30 % lower [Siltanen, 2010].
-0,0009 -0,0008 -0,0007 -0,0006 -0,0005 -0,0004 -0,0003 -0,0002 -0,0001 0,0000 0,0001 0,0002 0,0003 W1 W2 W3 W4 W6 W1 W2 W3 W4 W6
Smooth sand-paper-like surface Rough-textured surface dressing
Fig. 4.4: Results of RR measurements on a drum with smooth-textured Safety Walk (blue left) and a drum with rough-textured surface dressing (red right), for the five tyres that were aged artificially from the new condition. The vertical scale (RR coefficient in %) shows the difference from new to aged condition, which means that negative values are the results of reduced RR when tyres have aged. Copied from [Sandberg & Glaeser, 2008].
4.1.6 Tyre rolling speed
According to [Duleep, 2005], RRC speed dependence is small at speeds < 60mph (approx 97 km/h). However, beyond the so-called critical speed (usually over 80 mph, approx 130 km/h) standing waves develop and the RRC increases rapidly.
Tests in a VTI-TUG project including approx 100 car tyres, tested on the TUG drum facility, having two very different drum surfaces, showed very small speed influence on the RRC for the average tyre; see Fig. 4.5. The RRC increase from 80 to 120 km/h is only approx. 2 %. In a PhD thesis the speed influence was rather closely studied and a truck tyre RR model finally showed a speed influence between 50 and 100 km/h of max. 2 % [Sandberg, 2001]. Contrary to the examples mentioned, Descornet in the 1980's noted a moderate increase of
RRC with speed [Descornet, 1990]. However, this is plained by his trailer being ex-posed to air drag; thus it is an air drag effect on the tyre in his special set-up, where the test tyre is partly "protected" by the towing van and a fender, but there is nevertheless significant air drag in the wake behind.
10 11 12 13 14 15 16 80 100 120
Tyre rolling speed [km/h]
R R C [ k g/ ton]
Smooth drum surface (sandpaper) Rough drum surface (surface dressing)
Fig. 4.5: RRC versus speed, tested for approx. 100 car tyres of various brands and dimen-sions. Unpublished data from TUG/VTI.
![Fig. 4.8: Correlation between RRC and road roughness/texture level as a function of texture wavelength [Descornet, 1990]](https://thumb-eu.123doks.com/thumbv2/5dokorg/4933009.135796/35.892.108.657.360.736/correlation-roughness-texture-level-function-texture-wavelength-descornet.webp)
![Fig. 4.14: Influence of tyre internal air temperature on the RRC, according to [Descornet, 1990]](https://thumb-eu.123doks.com/thumbv2/5dokorg/4933009.135796/44.892.174.719.63.720/fig-influence-tyre-internal-temperature-rrc-according-descornet.webp)