Master of Science Thesis
KTH School of Industrial Engineering and Management Energy Technology TRITA-ITM-EX 2020:106
Division of Heat and Power Technology SE-100 44 STOCKHOLM
Techno-economic analysis of PV and
energy storage systems for Swedish
households
-2-
Master of Science Thesis TRITA-ITM-EX 2020:106
Techno-economic analysis of PV and energy storage systems for Swedish households Amber Ahmed Approved 2020-06-27 Examiner Anders Malmquist Supervisor Anders Malmquist Commissioner Vattenfall AB Contact person Nicholas Etherden
-3-
Abstract
As more countries progress towards renewable energy, intermittency in the power system is causing an unreliable power supply. Flexibility solutions from prosumers, which both consume and produce electricity, is one solution to provide stability to the power system. Households with both PV and energy storage are studied for this purpose in this thesis where the following flexibility services for both a household and the electricity grid of Sweden are studied: Increasing PV self-consumption, peak shaving, energy arbitrage at the day-ahead electricity market and providing the frequency regulation reserves FCR-N, FCR-D, aFRR and mFRR. Each house is assumed to have a 10 kW PV capacity and a battery capacity of 7.68 kWh. The services are studied in the software HOMER Grid and are modelled in different scales to see how the load in different aggregated levels affect the services. The case studies are a single family house, an overloaded transformer, an energy community and on a national scale. For the aggregated case studies, the potential capacity for PV will be based on the existing Swedish policies and the number of energy storages will be inspired by one the leading countries in Europe in energy storage installations, Germany.
The results showed that for a single household the self-consumption and self-sufficiency increased the most with an addition of a battery. The battery was most efficient in peak shaving and reducing the overall electricity cost when the electricity fee targeted both the electricity consumption during peak hours and the monthly peaks. With this price scheme, the payback time of the battery and PV system is around 14 years. However, when the electricity fee is only targeting the electricity consumption during peak hours, the results showed that the monthly electricity demand peaks actually increase with an addition of a battery.
For the aggregated case studies, it showed that decentralized batteries are not as effective in decreasing the electricity demand peaks if the peak lasts more than a few hours. On a national scale the results show that 20% of the aggregated batteries capacity is sufficient to provide around 70-100% of each of the frequency reserves individually. The highest savings are gained for the households when both the primary frequency reserves, FCR-N and FCR-D, are provided by the aggregated batteries together with increasing the PV self-consumption, peak shaving and energy arbitrage. The battery payback time is then reduced to 11 years. Based on a sensitivity analysis, the costs that affects the battery payback the most are the investment cost and the power fee.
-4-
Sammanfattning
I takt med att fler länder använder sig mer av förnybar energi, ökar opålitligheten i kraftsystemet på grund av förnybar energis intermittenta natur. Flexibilitetslösningar från konsumenter som kan både producera och konsumera el är en lösning för att förse stabilitet till kraftsystemet. Hushåll med både PV och batteri studeras för detta ändamål i detta examensarbetet där följande flexibilitetstjänster för både hushållet och elnätet studeras: Öka egenkonsumtionen av solel, kapning av effekttoppar, energiarbitrage samt tillhandahålla frekvensregleringens reserver FCR-N, FCR-D, aFRR och mFRR. Varje hus antas ha en 10 kW installerad kapacitet för PV och 7.68 kWh för batteriet. Tjänsterna studeras i programmet HOMER Grid och modelleras i olika skalor för att undersöka hur elkonsumtionen i aggregerade nivåer påverkar dessa tjänster. Fallstudierna är ett enskilt hus, en överbelastad transformator, en samling av hus samt i nationell skala. För de aggregerade fallstudierna kommer den potentiella kapaciteten för PV baseras på Energimyndighetens målbild för produktion av solel och antalet batterier är inspirerade av ett av de ledande länderna i Europa inom energiinstallationer, Tyskland.
Resultaten visar att för ett enskilt hushåll ökar egenförbrukningen och självförsörjningen som mest med både batteri och PV. Batteriet var mest effektiv med att minska effekttopparna och den totala elkostnaden när eltariffen innehöll både effekttariffen och tidstariffen. PV systemet med batteriet hade då en återbetalningstid på 14 år. Med endast tidstariffer visar resultatet att de månatliga effekttopparna ökar med tilläggen av batteriet.
För de aggregerade fallstudierna visar resultatet att decentraliserade batterier inte är lika effektiva att minska effekttopparna om de varar mer än några timmar. På nationell skala visar resultaten att 20% av den sammanlagda batterikapaciteten är tillräcklig för att förse cirka 70–100% av varje frekvensreserv. Den högsta besparingen för hushållen för den nationella fallstudien fås när både av de primära frekvensreserverna, FCR-N och FCR-D tillhandahålls av de aggregerade batterierna, tillsammans med tjänsterna för att öka PV-konsumtionen, kapning av effekttopparna och energiarbitrage. Batteriets återbetalningstid reduceras då till 11 år. Känslighetsanalysen visar att de kostnader som påverkar batteriets återbetalning mest är investeringskostnaden och effekttariffen.
-5-
Acknowledgements
This master thesis is written as the finishing project for the Master of Science in Energy and Environment. It was conducted as a joint collaboration between Vattenfall AB and the Sustainable Energy Engineering department at the Royal Institute of Technology (KTH).
I would like to express my gratitude to Vattenfall AB for giving me the opportunity to perform my master thesis in this interesting and evolving area. I would especially like to thank my supervisor Nicholas Etherden for guidance and the constant support and feedback throughout this thesis
I would also like to thank my supervisor and examiner at KTH, Anders Malmquist, for the valuable input and new perspectives throughout the whole thesis project.
Finally, I would like to thank all the people I’ve met at Vattenfall R&D, it was truly a great experience to be able to work in such an environment.
Amber Ahmed Stockholm, May 2020
-6-
Table of Contents
Abstract ... 3 Sammanfattning ... 4 Acknowledgements ... 5 Abbreviations ... 9 List of Figures ...10 List of Tables ...11 1 Introduction ...12 1.1 Previous work ...13 1.2 Research purpose ...14 1.3 Research questions ...14 1.4 Scope of study ...15 1.5 Work process ...15 2 Background ...172.1 Photovoltaics and Energy storage ...17
2.1.1 Photovoltaics ...17
2.1.2 Battery ...18
2.2 Policy outlook for Household PV systems and Energy storage in Sweden ...19
2.3 Direct support policies for PV and Battery installations in Sweden ...19
2.3.1 Capital subsidy for PV installations ...20
2.3.2 ROT tax reduction ...20
2.3.3 Capital subsidy for storage for micro-producers ...20
2.3.4 Green electricity certificate system ...20
2.3.5 Guarantees of origin ...20
2.3.6 Tax credit for micro-producers of renewable electricity ...20
2.3.7 Grid benefit compensation...21
2.3.8 VAT exemption ...21
2.3.9 Tax redemption ...21
2.4 Economics for both PV and Energy storage ...21
2.4.1 The cost of PV ...21
2.4.2 The cost of battery ...21
2.5 PV and Battery outlook in Germany ...22
2.6 Swedish electric power system ...23
2.6.1 Electricity market ...24
2.6.2 Balancing and frequency regulation ...24
2.6.3 Frequency reserves...25
-7-
2.6.4 Secondary reserve ...27
2.6.5 Tertiary reserve ...27
2.7 Energy storage characteristics and applications ...27
2.7.1 Energy storage applications ...27
2.7.2 Key definitions of ESS ...28
3 Analysis method ...29
3.1 Self-consumption ...29
3.2 Self-sufficiency ...29
3.3 Total net present cost (NPC) ...29
3.4 Payback time – Simple and Discounted ...30
4 General methodology and assumptions ...31
4.1 HOMER Grid ...31
4.1.1 Dispatch strategy ...31
4.1.2 Increase PV self-consumption ...31
4.1.3 Energy arbitrage ...32
4.1.4 Peak shaving ...32
4.2 Modelling process in HOMER Grid ...32
4.2.1 System model ...32 4.2.2 General ...33 4.2.3 PV system ...33 4.2.4 Inverter ...34 4.2.5 Battery ...35 4.2.6 Electric load ...35
4.2.7 Electricity price and sellback price for households ...35
4.2.7.1 Electricity supply contract...36
4.2.7.2 Grid contract ...36
4.2.7.3 Energy tax and VAT ...37
4.2.7.4 Electricity selling price ...37
4.3 Frequency regulation ...37
5 Single family house case ...38
5.1 Methodology for Single family house case...38
5.1.1 Load profile ...38
5.1.2 Modelling process ...38
5.2 Results and discussion for Single family house case ...39
5.2.1 PV scenario ...39
5.2.2 Battery IE scenario ...40
5.2.3 PV + Battery IEP Scenario ...40
-8-
6 Overloaded Transformer case ...45
6.1 Methodology for Transformer overload case ...45
6.1.1 Assumed installations of PV and Battery systems ...45
6.1.2 Load profile for Transformer overload ...46
6.1.3 Modelling process ...46
6.2 Results and discussion for Transformer overload case ...47
7 Energy community case on an Island ...48
7.1 Methodology for the Energy community case ...48
7.1.1 Assumed installations of PV and Battery ...48
7.1.2 Load profile for Energy community case ...49
7.1.3 Modelling process ...49
7.2 Results and discussion for Energy community case ...50
7.2.1 PV scenario ...50
7.2.2 PV + Battery IEP scenario ...51
7.2.3 Energy and Economical Analysis for Energy community case ...51
8 National case ...54
8.1.1 Frequency regulation ...54
8.2 Methodology for National case ...55
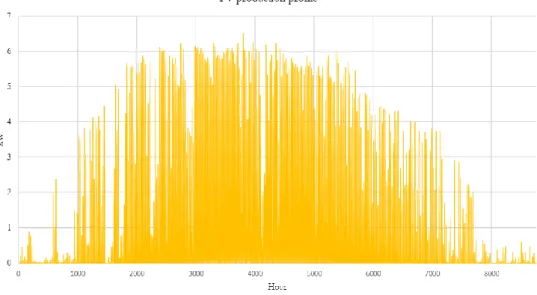
8.2.1 Load and PV production profile ...56
8.2.2 Modelling of Frequency regulation ...56
8.2.3 Modelling process ...58
8.3 Results and discussion for National case ...58
8.3.1 PV Scenario ...58
8.3.2 PV + Battery IEPF Scenario ...59
8.3.3 Energy and Economic analysis for National case ...60
9 Sensitivity analysis ...63
10 General Discussion ...65
10.1 Environmental impact from batteries ...66
11 Conclusion ...67
11.1 Future work ...67
Bibliography ...69
A Appendix: Electricity price variations ...74
B Appendix: Energy flow for Single family house ...75
C Appendix: Energy flow for Transformer overload ...77
D Appendix: Energy flow for Energy community ...78
E Appendix: Energy flow for National ...79
-9-
Abbreviations
AC – Alternating current
aFRR – automatic frequency restoration reserve BESS – Battery energy storage systems
CEP – Clean energy package DC – Direct current
DER – Decentralized energy resource DSO – Distribution system operator EV – Electric vehicle
EU – European Union FiT – Feed in tariff
FCR-D – Frequency containment reserve - disturbed FCR-N – Frequency containment reserve - normal
HOMER – Hybrid optimization of multiple energy resources IE –
IEP -
IRENA – International renewable energy agency mFRR – manual frequency restoration reserve NPC – Net present cost
NREL – National renewable energy laboratory PV – Photovoltaic
SDG – Sustainable development goals SvK – Svenska kraftnät
TSO – Transmission system operator VRE – Variable renewable energy
-10-
List of Figures
Figure 1: Power system flexibility (IRENA, 2018) ...13
Figure 2: Workflow for the thesis ...15
Figure 3: Total installed PV capacity (left) and annually installed PV capacity (right) for Sweden (Lindahl et al., 2019) ...17
Figure 4: Sector share of annual decentralized installed PV in 2018 (Lindahl et al., 2019) ...18
Figure 5: Annual storage installation internationally (IEA, 2019) ...19
Figure 6: Cumulative and annual installation of PV in Germany (Kairies et al., 2019) ...22
Figure 7: Battery installation in Germany with and without incentive for each half year from 2013 (Kairies et al., 2019) ...23
Figure 8: The physical and market pathways of electricity (Bjärke Energi, 2020) ...23
Figure 9: Timespan for the bidding and procurement of the different balancing markets in Sweden (Svenska Kraftnät, 2019a) ...24
Figure 10: Timespan for the different activation and usages of frequency control (Eng et al., 2014) ...25
Figure 11: Energy storage technologies based on their power rating and discharge times at rated power (Sandia National Laboratories, 2015) ...28
Figure 12: Behind-the-meter services (Nguyen, 2018) ...31
Figure 13: Components connection to the AC and DC bus ...33
Figure 14: Fraction of the measured annual PV production during each hour of the year ...34
Figure 15: PV production profile for a PV system near Transformer overload and the Energy community case ...34
Figure 16: Load profile for Single family house case ...38
Figure 17: PV scenario profile for Winter (left) and Summer (right) for Single family house case ...39
Figure 18: PV + Battery IE scenario profile for Winter (left) and Summer (right) for Single family house case ...40
Figure 19: PV + Battery IEP scenario profile for Winter (left) and Summer (right) for Single family house case ...41
Figure 20: Monthly peaks of electricity drawn for all scenarios for Single family house case ...42
Figure 21: IEP scenario savings compared to PV scenario for Single family house case ...43
Figure 22: System layout for the Transformer overload case ...45
Figure 23: Load profile for Transformer overload case ...46
Figure 24: Battery dispatch for Transformer overload case for three winter days ...47
Figure 25: System layout for Island case (Pngitem, 2020; Vecteezy, 2020) ...48
Figure 26: Load profile for Energy community case ...49
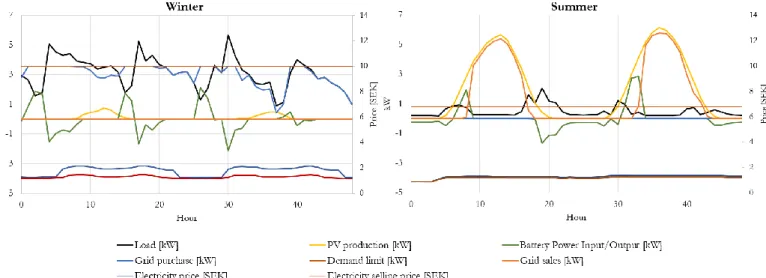
Figure 27: PV scenario for Winter (left) and Summer (right) for Energy community case ...50
Figure 28: PV + Battery IEP scenario for Winter (left) and Summer (right) for Energy community case ..51
Figure 29: Monthly peaks of electricity drawn for all scenarios for Energy community case ...52
Figure 30: Load profile and monthly power limit for IEP scenario for Energy community case ...52
Figure 31: System payout for case National (Svenska Kraftnät, 2020d) ...54
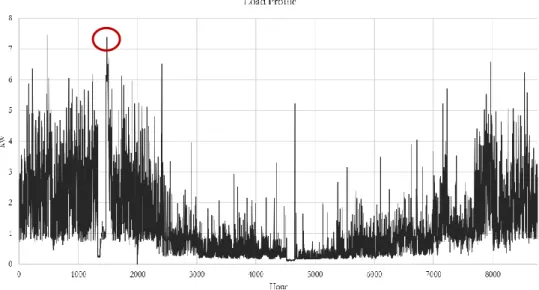
Figure 32: Load profile for National case ...56
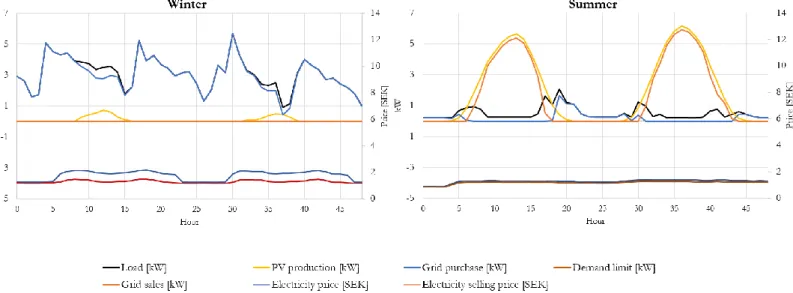
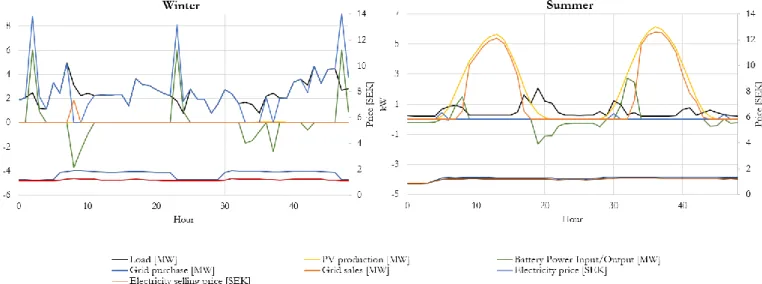
Figure 33: PV scenario for Winter (left) and Summer (right) for National case ...58
Figure 34: PV + Battery IEPF scenario for Winter (left) and Summer (right) for National case ...59
Figure 35: Monthly peaks of electricity drawn for all scenarios for scenarios for National case ...60
Figure 36: IEPF scenario savings compared to PV scenario for National case ...62
Figure 37: Sensitivity analysis for the discounted payback time of the battery ...63
Figure 38: Electricity price and electricity selling price for 2018 ...74
Figure 39: Energy flow for PV scenario in Single family house case ...75
Figure 40: Energy flow for IE scenario in Single family house case ...75
Figure 41: Energy flow for IEP Scenario in Single family house case ...76
-11-
Figure 43: Energy flow for battery scenario in Transformer overload case ...77
Figure 44: Energy flow for PV scenario in Energy community case ...78
Figure 45: Energy flow for IEP scenario for Energy community case ...78
Figure 46: Energy flow for PV scenario for National case ...79
Figure 47: Energy flow for IEPF scenario for National case...79
List of Tables
Table 1: Analyzed services and case studies for this thesis ...15Table 2: Frequency reserves overview (Svenska Kraftnät, 2019c, 2019d, 2019a, 2019e, 2019b) ...26
Table 3: Inverter’s assumed efficiency and measured efficiency ...35
Table 4: RCT battery specifications ...35
Table 5: Electricity supply contract costs ...36
Table 6: Load prices for 20A fuse rating ...36
Table 7: Power fee N3T contract ...36
Table 8: Energy tax and VAT ...37
Table 9: Electricity sellback to the grid prices ...37
Table 10: Energy analysis for Single family household case ...42
Table 11: Economic analysis Single family household case...43
Table 12: Assumed percentages for Overloaded transformer case ...46
Table 13: Assumed PV and battery unit percentages for the Energy community case ...48
Table 14: Energy analysis for Energy community case ...53
Table 15: Historical frequency reserve values of 2018 ...55
Table 16: Assumed quantities and capacity for battery and PV for National case ...55
Table 17: Battery characteristics for providing frequency regulation...57
Table 18: Revenue and volume met by Frequency regulation for National case ...59
Table 19: Energy analysis for National case ...60
Table 20: Economic analysis for National case with 20% battery’s capacity for frequency regulation and 80% of battery’s capacity from single household case ...61
-12-
1 Introduction
Energy enables a prosperous world, permitting social welfare, economic growth and development. However, there are many challenges facing the current energy system. Countries are utilizing unsustainable energy sources such as fossil fuels which leaves a negative impact on the environment, with higher pollution levels emitting from the energy sector and contributing to global warming than ever before. Also, many countries energy consumption is increasing, straining the already finite fossil fuels resources further. Several efforts have been made where the majority of countries have vowed to minimize their impact on the environment through united goals such as the Paris Agreement. 195 countries collectively set the goal to limit the global warming to below 2℃, but aim at an increase of at most 1.5℃ to minimize the effects of climate change and contribute to a more sustainable world (United Nations, 2015). Sweden has a goal of having net-zero greenhouse gas emissions by 2045 and by 2040 have an energy system consisting solely of renewable energy (Regeringskansliet, 2016).
Countries are committing to limiting their climate change and fostering sustainable growth by decarbonizing their fossilized power sector and resort to other sources. Electricity consumption is expected to increase from various sectors as they are becoming progressively electrified, the transportation sector is expected to increase the most because of the implementation of electric vehicles (EV). All this points at an increase of electricity demand in the future (IRENA, 2019).
The International Renewable Energy Agency (IRENA) proposes a pathway on how to meet the increased electricity demand while cohering to the objectives of the Paris Agreement, and highlights that the main enabler would be to increase renewable energy generation and to increase the energy efficiency of the power sector. IRENA forecasts that around 86% of the future electricity demand can be derived from renewable sources by 2050 due to its declining costs, high energy efficiency and other enablers such as smart technologies and electrification solutions (IRENA, 2019). However, around 60% of this renewable energy will derive from sources such as solar and wind power, which are considered variable renewable energy (VRE). VRE sources are non-controllable due to their variable nature, it is not possible to control when it is sunny and windy.
Private consumers have also gained an interest in renewable energy and are beginning to invest in local production, such as rooftop photovoltaics (PV) and energy storage, becoming so called prosumers who both consume and produce electricity. In Germany, around a third of the renewable energy capacity derives from citizens through rooftop PV or by private people forming energy cooperatives with other citizens whom together invest in a larger scale renewable energy, such as wind turbines or solar parks (Clean Energy Wire, 2018a, 2018b).
For the power sector, the increase in electricity demand and local electricity generation will mean a huge transition. The current power system, created with the intention to handle non-variable generation, will be under a new strain to balance the electricity supply and demand without causing disruptions with VRE. As a portion of the electricity generation will come from the end-users, this will disrupt the uniform manner the power generation and transmission work today where the electricity generation was typically produced at one end and the consumption at the other. With a higher electricity demand, the grid will also need to expand and strengthen which is a slow and costly process (IRENA, 2018).
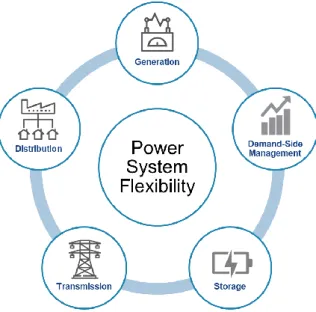
In order to tackle these new challenges, the power system will have to transform to become more flexible, meaning being able to reliably and cost-effectively manage the variability and uncertainty of demand and supply across all relevant timescales (IRENA, 2018). In order to handle this flexibility, measures have to be taken in all sectors of the energy system, such as the transmission and distribution systems, storage and through demand-side management, as seen in Figure 1.
-13-
Figure 1: Power system flexibility (IRENA, 2018)
Energy storage system is a mean to provide flexibility in a power system, especially by stabilizing VRE’s electricity generation. Moreover, energy storage can provide a variety of services from power quality support, frequency regulation to peak shaving and reduce a household’s electricity bill, making them an attractive option for both consumers and larger actors such as the distribution system operators (DSO) and the transmission system operators (TSO).
A study done by SolarPower Europe, an association with the aim of promoting solar energy in Europe, concludes that it is possible to create an energy system that is climate neutral and meet the Paris Agreement by 2050 or earlier. It is most cost-effective if the energy system consists of 100% renewable energy where wind and solar are the two main energy sources of the future, where flexibility with energy storage is key (SolarPower Europe and LUT University, 2020).
Promoting decentralized energy resources (DER) for flexibility, such as PV and batteries, is something the European policymakers are advocating in their regulations and initiatives as well. The EU’s clean energy package (CEP) states to utilize recourses optimally, implying even the small-scale resources should be used to their utmost potential. Another objective set by the CEP is to facilitate the market development for providing grid services and the electricity market, where DER also is included (Lind and Ávila, 2019). Sweden has been slow in utilizing DER for flexibility means, with very few decentralized energy storage systems existing in the country.
In order to gain an understanding of what services decentralized PV and energy storage systems can provide in Sweden this thesis will analyze this for the different scales: a single family household, a transformer, a distribution grid of an energy community and on national scale. The potential capacity for PV in Sweden will be based on existing Swedish policies and for energy storage will be inspired by one the leading countries in Europe in energy storage installations, Germany.
1.1 Previous work
A summary of studies performed for decentralized energy storage and PV providing various services are explained here.
Several studies have been performed of the usage of large-scale batteries providing grid stability amongst other services. A paper studies how energy storage can provide grid stability through participating in the regulation market, arbitrage and minimizing grid outage for the US power system (Tian et al., 2018). It concludes that mitigating outages is very valuable for grid stability and customer satisfaction, but the highest revenue is from the regulation market.
-14-
Another study (Fong et al., 2017) analyzes how a storage of 4 MW/4 MWh can provide energy arbitrage, frequency regulation and voltage support. Consequently (Asghari et al., 2015) performed an economic analysis of providing energy arbitrage, frequency regulation, investment upgrade deferral and as a reserve for the power supply from a large scale battery for the UK market. The results show that frequency regulation provides the largest revenue, however the general consensus from these studies is that the profit increases when the battery provides multiple services simultaneously.
The authors of (Parra and Patel, 2019) analyzed behind-the-meter services for energy storages with PV for around 100 different households in the UK, such as increasing the self-consumption of PV, peak shaving combined with load shifting. The results showed that individually these services were not profitable, but a combination of peak shaving and energy arbitrage proved most profitable and that the results varied significantly depending on the household’s load.
A case study (Sardi et al., 2017) analyzed how aggregating individual households PV and batteries can provide a value for the whole community through energy arbitrage, system upgrade deferral, voltage support, peak shaving, emission and energy loss. (Rodrigues et al., 2017) modelled a community of 100 households under UK conditions, where half of these have PV and battery system. Two case studies are created, the first analyzing integrating PV to increase the self-consumption of the community and the second in-house energy management to provide frequency regulation and as reserves for the power system. It concludes that flexibility revenue is the highest for providing the balancing services by coordinating the decentralized energy sources.
In summation, there is a lot of research done on the services energy storages can provide, however, there was a lack of studies which focused on these services on multiple scales. Where energy arbitrage in the day-ahead market, peak shaving and increasing the self-consumption for the household together with reduction of the overall load and frequency regulation on a larger, aggregated scale are combined.
1.2 Research purpose
To investigate the economical and flexible value that decentralized PV and energy storage systems can potentially provide for a household and the electricity grid in Sweden. This is analyzed for four cases: a single house, a transformer, a distribution grid of an energy community and on a national level.
1.3 Research questions
For the different case studies the following questions will be answered to meet the research purpose: Single family household case:
• What savings and energy benefits can be made by installing a PV system with and without energy storage?
Transformer overload case:
• Are aggregated batteries a good source for reducing the peak load on a transformer? Energy community case:
• How much of the total load on a distributed grid for an energy community can be reduced by having aggregated batteries and PV systems?
National case:
• What proportion of Sweden’s frequency regulation can the decentralized energy storage systems provide on a national scale?
• How much savings and energy benefits can be made from providing both household services and frequency regulation for an PV and energy storage system?
-15-
1.4 Scope of study
The potential of grid services will be defined as the proportion of frequency regulation and load reduction that can be fulfilled by the home energy storage systems. The frequency regulation that will be studied are the four reserves, frequency containment reserve – normal (FCR-N), Frequency containment reserve – Disturbance, automatic frequency restoration reserve (aFRR) and manual frequency restoration reserve (mFRR).
The value for household from battery usage and provision of grid services will be defined by how it affects their utility bill with the present electricity prices subsidies and taxation in Sweden, Increased PV self-consumption and self-sufficiency is handled as an additional value for homeowners, independent of economic gain.
The focus of the study is on a single family household, an actual transformer under overload for a period during a year and an actual island where a hypothetical energy community is created. Finally, the national scale is also studied for household services and grid services. What service is covered for which respective case study is shown in Table 1.
Table 1: Analyzed services and case studies for this thesis
Service Case studies Single family house Transformer overload Energy community National Energy arbitrage X X X Peak shaving X X X X Increase PV self-consumption X X X Load reduction X X
Frequency regulation (primary FCR-N and FCR-D, secondary aFRR and
tertiary reserves mFRR)
X
The PV system and battery sizing are common for all the case studies where the battery’s capacity is set to 6 kW/7.6 kWh and PV to 10 kWp per house. However, the quantity assumed for the case studies varies based on the specific conditions for each case. The losses accounted for in the model are the conversion of electricity for both the inverter and rectifier. The losses in the PV panels are also taken into account but no losses have been modelled for the energy stored in the battery.
The loads for each case study are taken from actual sites for interpretation of how such services could benefit real life cases.
1.5 Work process
To meet the objective of this study the following work process plan shown in Figure 2 was chosen and is explained below.
-16-
The initial step of this thesis was to conduct a literature review and gather knowledge about decentralized household PV and battery outlook in Sweden and internationally. Also, the current electricity market will be explored to gain an understanding on what drive forces and factors can allow for the increase of DER. The balancing reserves, FCR-N, FCR-D, aFRR and mFRR, are also studied with what volumes the reserves are used today and what specifications they have. The services of increase PV self-consumption, energy arbitrage peak shaving, load reduction and frequency regulation that decentralized energy storages can provide are also studied in particular in the literature review. In order to gain an understanding of what value these services can provide in different scales from an individual household to national level, the case studies of a single family house, an overloaded transformer, an energy community and the national scale are defined. These case studies are then modelled in order to quantify the value of the DER in the modelling tool HOMER Grid.
The second process is to collect data on the case studies chosen, such as the PV production and load profiles and gather data on the frequency reserves. Following, getting acquainted with the modelling tool and modelling the four case studies is done.
Finally, the results for each case study are presented and analyzed, followed by a sensitivity analysis and a general discussion.
-17-
2 Background
2.1 Photovoltaics and Energy storage
2.1.1 Photovoltaics
Photovoltaics usage can be divided in two categories, off-grid and grid-connected. In Sweden, the primary use of PV till the year 2006 was for off-grid purposes far from any grid connections. However, the share of grid-connected PV installations increased from that year due to the growing interest from the public, the utilities as well as the government which eased the investment for micro-producers with support programs that began in 2005. The national installed capacity has been growing in an exponential rate since then, as can be seen from Figure 3, the grid connected PV capacity amounted to nearly 412 MWp in the year 2018 where around 156 MWp was installed the same year. The majority of the installed PV capacity are distributed systems where the cumulative distributed capacity was around 392 MWp in 2018. This trend is also shown in previous years where the largest share of new installations are within the residential and commercial sector, seen in Figure 3 (Lindahl et al., 2019).
Figure 3: Total installed PV capacity (left) and annually installed PV capacity (right) for Sweden (Lindahl et al., 2019)
The Swedish Energy Agency analyzed the share of installed capacity for each segment of the sectors and found that single-family houses in the residential sector has the largest share and the commercial sector was the second largest. The various segments share can be seen in Figure 4 below which shows the share annual installed PV capacity for the different sectors (Lindahl et al., 2019).
-18-
Figure 4: Sector share of annual decentralized installed PV in 2018 (Lindahl et al., 2019)
2.1.2 Battery
The basic components of a battery are an electrolyte together with a positive and negative electrode. When used, the electrodes are connected to each other via an external circuit, and the electrochemical potential between the electrodes creates a current in the circuit. The structure of the battery energy storage system (BESS) typically consists of a battery pack, a conversion system, a control system and other components such as coolers (Das et al., 2018).
BESS can be made of different elements; the type that has historically been most used are lead acid batteries, although these have low energy ratio compared to its volume and its weight (May et al., 2018). Another compound that is becoming popular since the 90’s are lithium-ion batteries. They have a much higher energy density compared to lead batteries and therefore are more common in portable electric devices. Li-ion batteries are also becoming more widely used due to its longer cycle life, high roundtrip efficiency, withstanding higher temperature ranges and high efficiency in charge and discharge of the battery (Zubi et al., 2018). Due to the favorable technical capabilities of Li-ion batteries, its decreasing investment costs and improvement in its performance there are many large-scale batteries with lithium-ion batteries used as a complement to intermittent renewable energy sources, such as the 100 MW Tesla Powerpack in Australia (Tesla, 2017). The battery technology therefore used in this thesis is also the Lithium-ion battery.
The annual energy storage capacity nearly doubled internationally in 2018 from the previous year where around 3 GW was installed compared to 1.7 GW in 2017. Small scale battery installations were record-high due to the countries policy measures for behind-the-meter batteries starting to come into effect (IEA, 2019). However, the small scale battery market is mainly limited to certain countries where their incentives has accelerated the DER market such as in South Korea, Australia, Japan, Germany and the United States based on the deployment and policy trends from IEA (IEA, 2019). The annual installation rate for both large scale and small scale are shown in Figure 5. In Sweden, the installation rate for batteries has been slow, a total of 400 private people had applied for the energy storage subsidy granted by the government for installing a decentralized battery, explained further in Section 2.3.3, from 2016 to the beginning of 2018 (Energivärlden, 2018). There may have been installations done without applying for this subsidy, but this value can be considered negligible.
-19-
Figure 5: Annual storage installation internationally (IEA, 2019)
2.2 Policy outlook for Household PV systems and Energy
storage in Sweden
In the year 2016 five of the eight political parties in the Swedish government came to an agreement called the “Energiöverenskommelsen” with a goal of producing 100% renewable electricity by the year 2040 (Regeringskansliet, 2016). However, no specific goal was made for how large share of this should originate from solar energy. Instead, the Swedish Energy Agency was given the task to propose a strategy for how to increase the share of solar energy in Sweden and analyze the necessary capacity amount of solar energy in order to meet the goal set by the Swedish government. The Swedish Energy Agency concludes that based on the technical, economical and geographical potential of solar energy in Sweden, it can provide around 5-10% of the renewable electricity share of 2040, which is around 7-14 TWh of electricity (Energimyndigheten, 2016).
The study shows that households and other facades are the most beneficial locations for producing solar energy and the total electricity generated solely from these building types amounts to 40 TWh (Energimyndigheten, 2016). Another study which performed a techno-economic analysis for solar cells in Sweden found that small houses and summer houses have the most favorable roof space for solar panels amongst building types. Industry and multi-family houses are also promising for PV (Blomqvist and Unger, 2018).
The International Energy Agency (IEA) forecasts that in order to achieve the sustainability development goal (SDG) and the Paris Agreement, an energy storage capacity of around 200 GW would be needed globally till the year 2030. The trends of recent years show that this could be achieved if the installation rate continues, as shown in Figure 5 above where decentralized batteries, such as the behind-the-meter batteries used in residents, are expanding the most. The increase of the batteries are heavily dependent on the support policies that are in effect in the different countries, resulting in different levels on exposition for each country (IEA, 2019). Sweden has at the time of writing no target for how large the share of decentralized storages should be.
2.3 Direct support policies for PV and Battery installations
in Sweden
There are several support policies in place to endorse prosumers to generate their own renewable electricity through PV, and to store and feed the excess electricity to the grid. These will be described in more detail below.
-20-
2.3.1 Capital subsidy for PV installations
The capital subsidy program for homeowners started in 2009 by the government where it covered 20% of the installation cost for installing a PV system for the year 2018. The subsidy originally covered 60% of the installation cost but has since decreased at the same rate as the price decreased and the PV market grew. All private consumer types are allowed to apply for this grant as it is not limited to decentralized systems (Lindahl et al., 2019).
2.3.2 ROT tax reduction
Another option to the capital subsidy program is the ROT-program, where a service is bought to renovate and upgrade buildings. The tax reduction using the ROT-program was 30% of the labor cost in 2018, which amounts to 9% of the total investment cost of the PV system. The requirements for getting this tax reduction is that house is older than five years and that the capital subsidy is not used (Lindahl et al., 2019).
2.3.3 Capital subsidy for storage for micro-producers
To endorse increasing the self-consumption of renewable electricity, the Swedish government created a capital subsidy for batteries where up to 60% of the investment cost or a maximum of 50 000 SEK is granted for the purchase of a storage. The subsidy is provided if it can store the renewable electricity and if it can increase the self-consumption of the household. This grant began in 2016 with 25 million SEK with an additional 50 million SEK every year from 2017 to 2019 (Lindahl et al., 2019).
2.3.4 Green electricity certificate system
The green certificates scheme has existed since 2003 as a way for the government to create an incentive to increase the renewable electricity production. A renewable producer receives one certificate for each MWh renewable electricity generated, which can then be sold on an open market where the pricing is dependent on the supply and demand price. The buyers are electricity stakeholders which are obliged to purchase a certain percentage of the electricity they sell to their consumers, called the quota obligation. The percentage is decided by the government. The cost for purchasing the certificate is in turn added to the consumers bill meaning it is the consumers that pay for the certificate in the end as a way to increase the renewable electricity generation (Konsumenternas Energimarknadsbyrå, 2020a; Lindahl et al., 2019). The average weekly price for the certificate was around 0.15 SEK/kWh for the year 2018 (SKM, 2020).
2.3.5 Guarantees of origin
This electronic document is as a testimony for the origin of the electricity produced and was introduced in 2010. For every MWh the producer can apply for the guarantee of origin from the Government which can be sold, similar to the green electricity certificate. The buyers of this document are utility companies that may want to provide electricity from a specific resource to its users (Swedish Energy Agency, 2017b). The average value for guarantees of origin in Sweden for the year 2018 was only 0.01 SEK/kWh (Svensk Solenergi, 2018).
2.3.6 Tax credit for micro-producers of renewable electricity
Micro-producers of renewable electricity are valid for tax credit of 0.6 SEK/kWh that is fed to the grid, based on the Income Tax Act (Sveriges Riksdag, 1999). In order to be accounted as a micro-producer the fuse level of the building cannot exceed 100 A, the electricity is fed from the same connection as it is drawn and the grid owner is notified of the electricity generated. The amount of kWh electricity generated is also not allowed to be higher than the electricity drawn annually to be granted the tax credit and a maximum tax credit can be given to 30 000 kWh per year.
-21-
2.3.7 Grid benefit compensation
A prosumer also gains an added reimbursement from the grid owner. The grid owner compensates the energy loss reduction that the micro-producers provide by feeding its excess electricity to another consumer and use the electricity locally rather than transporting electricity from another area with the losses that entails. Depending on the grid owner, the compensation can vary between 0.02-0.1 SEK/kWh (Lindahl et al., 2019). For Vattenfall the compensation is 0.078 SEK/kWh for the southern part of the Swedish network (Vattenfall, 2018).
2.3.8 VAT exemption
VAT exemption for the electricity sold back to the grid is valid if the total renumeration made from the PV system is below 30 000 SEK per year, according to calculations made by Lindahl, such renumeration in mainly exceeded with a PV system sizing of 100-200 kWp, which is well above the average capacity of a residential PV system (Lindahl et al., 2019).
VAT is non-deductible for PV systems investment cost if part of the generated electricity meets the household load (Lindahl et al., 2019).
2.3.9 Tax redemption
On self-consumed electricity there is no tax for the PV system if the capacity is below 225 kWp, which is well above the average capacity size of a residential PV system (Lindahl et al., 2019).
2.4 Economics for both PV and Energy storage
2.4.1 The cost of PV
The cost for PV technology has consistently kept decreasing over years since 2008 where the PV market began to grow in Sweden, this was simultaneously as the international prices for the modules also decreased. However, due to the import duties set by the European Commission in 2013 the decline became more stagnant, where the import prices could not be lower than around 5.2 SEK/Wp, this limitation was however
removed in late 2018. This termination decreased the module prices with 14% in the year 2018 (Lindahl et al., 2019).
The declination in prices is also mirrored in the whole PV system cost, which in addition to the cost of the PV module also includes the costs of the inverter, control components needed for the module and the installation cost. Also, as the market for PV increases the installation firms can lower their prices due to the constant stream of orders and economy of scale. For single-family houses with an installed capacity of 5-10 kW the cost has decreased between the year 2010 to 2018 from 15-23 SEK/Wp to 12-18 SEK/Wp.
The cost of a PV system in 2018, taken as an average of the costs found from both the installation companies estimates and the Swedish direct capital subsidy program, is 14.6 SEK/Wp excluding VAT (Lindahl et al.,
2019).
2.4.2 The cost of battery
Li-ion energy storage like many maturing technologies is experiencing a decrease in costs owing to many factors, such as a higher production volume, material and performance improvements and competition in the supply chain. But, compared to other energy storage technologies, Li-ion battery has gained a much higher interest mainly due to the market growth of EV and other flexibility uses it can provide in stationary applications. This technology is also suitable as a complement to other technological developments such as variable renewable power generation from wind or solar energy (IRENA, 2017).
Li-ion battery costs around 6 000 to 38 000 SEK/kWh internationally depending on application and size (Das et al., 2018). In Sweden the cost are closer to the lower range of that price but can vary from size, manufacturer and application (Vattenfall R&D, 2019).
-22-
2.5 PV and Battery outlook in Germany
Germany has amongst the highest installation rate for decentralized PV systems and batteries in the world, which is why it was chosen as an inspiration for Sweden as to how another European country succeeded in installing such high volume of solar panels and decentralized batteries. To gain an understanding of how Germany managed to transform its energy sector, a study on such energy systems in the country was done. In 2018, around 3 GW of PV capacity was installed with a total installed capacity at 45.5 GW by the end of the same year. This amounts to around 1.2 million distributed PV systems in the country.
The reason for the PV boom in Germany can be directed to many factors, such as the long-term support schemes from the government, support from investors and an interest to install solar panels from the residential, commercial and industrial sectors (Masson and Kaizuka, 2019). The German energy policies aim to be completely nuclear free by 2022 and move towards a more diversified energy system (IEA, 2020). One incentive to reach this goal was the Feed-in Tariff (FiT) introduced in the year 2000 for PV systems smaller than 10 kW. This tariff is given for the excess electricity which is fed to the grid and created an incentive to install decentralized PV systems. The tariff value changes annually depending on the market development such as the declining PV prices and increasing rate of PV system installments (Masson and Kaizuka, 2019). The trend of the previous year’s show the FiT has been steadily decreasing and went below the retail electricity price in 2012. This also mirrors the annual PV installation rate, where the peak year was at 2012, as can be seen in Figure 6 (Kairies et al., 2019).
The reason for the decreases was for the overloading the solar production was causing to the grid. The majority of the PV systems were installed by households or farmers, which resulted in a large share of the installed capacity being located at the distribution side of the grid. During particularly sunny periods with low consumption, the distribution grid would become overloaded by the PV systems.
Figure 6: Cumulative and annual installation of PV in Germany (Kairies et al., 2019)
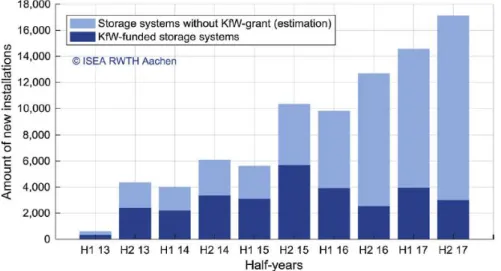
Decentralized energy storage (DES) became therefore an attractive option for both the households and the grid owners where the households could store their excess electricity and use it at another time as to not overload the grid. Germany had an incentive program for decentralized batteries which was active between 2013 to 2018 with the aim of increasing the self-consumption of small PV systems less than 30 kWp and to grow the battery market in the country. The annual installation volume of batteries and amount funded is shown in Figure 7. During this time period more than 32 000 decentralized batteries were funded with around 2 000 in the year 2018. The amount of batteries funded decreased with time, as shown in Figure 7, where 50% of all the battery installations in 2013 to 2015 were funded and during the last year, 2018, only 5% of the annual installations were funded. This showed how the incentive was successful in stimulating the decentralized energy storage market in Germany, around every other decentralized PV installation done
-23-
in 2018 had also installed a battery. In total, around 40 000 batteries were installed in 2018 and the total number of energy storages installed is estimated to be 120 000 that year (Masson and Kaizuka, 2019).
Figure 7: Battery installation in Germany with and without incentive for each half year from 2013 (Kairies et al., 2019)
2.6 Swedish electric power system
The Swedish electricity grid is today majorly uniform, where generation is produced at one end and the consumers, such as households and industries, are at the other. The grid is divided into three parts, the transmission grid, the regional or distribution grid and the local grid as shown in Figure 8. The transmission grid transports the bulk of the electricity throughout the country and has a voltage of 400 kV in order to have as little losses as possible (Jämtkraft, 2019). The regional grid and local grid are the transporter to the consumers with the local grid being connected to the end-users. The regional grid usually has a voltage between 40-130 kV but can also have less, whereas the local grid has a voltage of 230 V-20 kV (Svenska Kraftnät and Svensk Energi, 2014).
Figure 8: The physical and market pathways of electricity (Bjärke Energi, 2020)
The transmission system operator (TSO) is a government authority named Svenska Kraftnät (SvK) which has the role of maintaining and developing the transmission grid. The regional and local grid owners, also called the distribution system operators (DSO), are owned by around 160 electric companies, where the
Physical path Market path
-24-
three largest are Vattenfall Eldistribution, Fortum Distribution and E.ON Elnät Sverige (Svenska Kraftnät and Svensk Energi, 2014).
2.6.1 Electricity market
The electricity can be said to be divided into two pathways, the physical path and the market path, as shown in Figure 8 above.
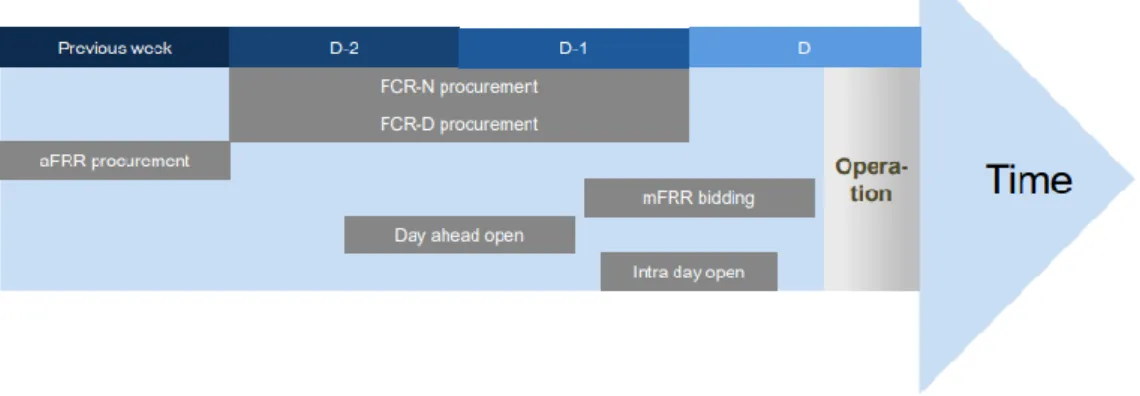
The Swedish electricity market is quite complex with several actors and marketplaces. The long-term electricity market is done at Nasdaq, where electricity can be purchased on yearly terms. The main electricity market in Sweden is usually through the wholesale market Nord Pool, where electricity producers sell their electricity to the electricity suppliers, which in turn sell it to the end-consumers, as shown in the market path in Figure 8 (Svenska Kraftnät, 2020a). There are two physical markets within the Nord Pool, the day-ahead market (Elspot) and intraday market (Elbas). The trading in the day-ahead market is done per hour and closes one day beforehand (Svenska Kraftnät, 2020b). With the intraday market, trading is done continuously during the day and closes an hour before delivery. The timespan for each of these markets is shown in Figure 9, the market for the frequency regulation reserves, FCR-N, FCR-D, aFRR and mFRR are explained further below. The actors buy or sell electricity so to adjust to the consumers electricity load closer to the delivery time. With VRE increasing, the intraday market is becoming more widely used for balancing the system during the day (Svenska Kraftnät, 2020c).
Figure 9: Timespan for the bidding and procurement of the different balancing markets in Sweden (Svenska Kraftnät, 2019a)
In addition, there are also the frequency regulating markets, which are procured to handle the momentaneous irregulates in the grid’s frequency. The trading is done at latest 45 minutes before delivery time between SvK and the balancing responsibility parties which is explained further in Section 2.6.2 (Svenska Kraftnät, 2019b).
2.6.2 Balancing and frequency regulation
The electricity grid has to constantly uphold a balance between the consumption and production of electricity, with a perfect balance the frequency is at 50 Hz for the system. However, deviations between 49.9-50.1 Hz are within the acceptable levels, if these values are exceeded it could potentially damage the grid components.
The Electricity suppliers have to deliver the same amount of electricity as its consumer use according to the Electricity Act (Riksdagsförvaltningen, 2020). However, there are often irregularities between the supply and the demand, therefore, the electricity suppliers also have the balancing responsibility to fulfill this obligation.
The system responsibility to ensure that there is a constant balance in the grid system lies on Svk and was decided by the Swedish government. Svk does not balance the irregularities by its own production or load units, rather, they buy regulating power as ancillary services from the balance responsibles which SvK then
-25-
activates. The energy producers that misjudged their consumption or production and caused the imbalance has to pay SvK the cost of restoring it, called the balance settlement.
The regulating reserves can either be up regulating or down regulating. If the frequency goes below 50 Hz the up regulating reserves are activated which is done either by increasing the electricity production or by decreasing the consumption. If the frequency goes above 50 Hz, down regulating reserves are activated, which means that either the electricity production is decreased, or the consumption is increased.
2.6.3 Frequency reserves
The regulating frequency reserves are divided into three levels, primary, secondary and tertiary reserves and vary with endurance and speed.
The reserves are bid by the balancing parties on the capacity they can deliver for each hour, the bid is then activated chronologically from the lowest bid, with the renumeration for the balancing parties to be “pay-as-bid” (Svenska Kraftnät, 2016). The bids value is meant to reflect the operational cost of providing the reserves with some additional costs for the risk and margins for providing the reserve. Other than the capacity renumeration, the reserves FCR-N and aFRR are also remunerated when their bid is activated. The amount of renumeration depends on the volume activated needed to restore the frequency.
The minimum bid size for the different reserves are shown in Table 2. The reserves bidding timespan is the longest for mFRR which can be procured 14 days before being activated and can be altered to 45 minutes before activation. The aFRR is bid once a week for the upcoming week and FCR is procured one to two days before being activated (Svenska Kraftnät, 2019b). The timespan for the frequency reserves are shown in Figure 9. More information on typically procured volumes can be found in Table 15 of Section 8.1.1.
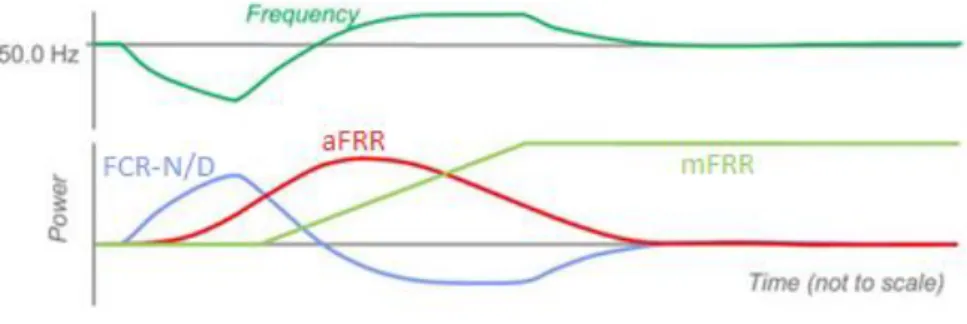
The automatic reserves are today only regulated by hydropower and so the requirements are also catered for conditions suitable for that technology. Svenska Kraftnät does, however, acknowledge the need to restructure the balancing markets and conditions to include other technologies such as DER in order to follow the regulations given by the European Commission (Svenska Kraftnät, 2017). How the frequency deviates and is regulated by the reserves is shown in Figure 10.
Figure 10: Timespan for the different activation and usages of frequency control (Eng et al., 2014)
The automatically activated reserves are divided into the primary and the secondary reserves. The primary reserves consist of FCR-N and FCR-D, and are first to activate during an imbalance, to make sure the frequency stays within the acceptable limit. These have the most rapid response and are activated automatically when the frequency deviates to the reserve’s activation levels shown in Table 2. FCR-D is only activated during major imbalances of production losses. The primary reserves stabilize the frequency, but not necessarily to 50 Hz, the secondary reserve, aFRR is then activated to bring the frequency back to the nominal value. The final, manual reserve and also the tertiary reserve is called mFRR, and is activated to unload the aFRR and maintain the frequency at 50 Hz (Eng et al., 2014). The manual reserves are the slowest to activate and is used to bring the frequency back to the nominal value and to restore the automatic reserves. The timespan of when the reserves are activated, and the frequency deviation is shown in figure 4 and the actual response times are shown in Table 2.
-26-
Table 2: Frequency reserves overview (Svenska Kraftnät, 2019c, 2019d, 2019a, 2019e, 2019b)
FCR-N FCR-D aFRR mFRR Activation upon [Hz] Frequency Deviation within 49.9-50.1 Frequency below 49.9 to 49.5 Deviation from 50 Hz remaining from FCR-N and/or FCR-D Deviation from 49.90 – 50.1 Hz
Response time 63% within 60s + 100% within 3 min
50% within 5s and 100% within 30s
100% within 120s 100% within 15
min (longer time is allowed)
Time frame for bidding their
capacity
One or two days prior to operation
One or two days prior to operation
Once weekly for the following week
From 14 days to 45 min prior to
operating hour
Min required active time
1 hour 1 hour 1 hour (max 3
hours)
Deactivated end of hour or until notified by SvK
Activates Automatic Automatic Automatic Manually by SvK
Symmetric production (Up
and/or Down)
Yes No (only Up) Yes (one direction
at a time)
Yes
Min Bid size [MW] 0.1 0.1 5 10 (5 in SE4) Required national capacity [MW] 227 427 150 Unlimited
Remuneration Capacity: Pay as bid Energy: In accordance to price of upward and downward regulation Capacity: Pay as bid Capacity: Pay as bid. Energy: In accordance to price of upward and downward regulation Energy: In accordance to price of upward and downward regulation
-27-
Primary frequency reserves
The primary reserves are called the Frequency Containment Reserves and is separated in Normal and Disturbed (FCR-N and FCR-D), FCR-D is only activated when the frequency deviates more than the acceptable frequency limits. The FCR are automatic reserves which are the first to be activated and prevent the frequency change further. They are activated automatically by the grid frequency, but at different deviations, shown in Table 2. FCR-N is activated during minor changes in frequency from the range 49.9-50.1 Hz and is symmetric meaning it can regulate both up and down. FCR-D is only regulating up and is activated during larger frequency deviations where there are operational disturbances, between 49.9-49.5 Hz. The primary reserves have the shortest response time to an imbalance, this is due to them being the first reserves to be activated (Svenska Kraftnät, 2019d). FCR-N should be activated to 63% in 60 seconds and 100% within three minutes. FCR-D is even faster as it is used when the production units are disturbed with 50% activated in five seconds and fully activated within 30 seconds. The national required capacity procured for each hour is 227 for FCR-N and 427 for FCR-D in 2018.
2.6.4 Secondary reserve
The automatic Frequency Restoration Reserve (aFRR) is the second reserve to activate and therefore the response time is also longer than the primary reserves, it needs to be activated within 120 seconds. aFRR unloads the FCR so that they be ready for the next frequency deviation and also bring the frequency back to the nominal value.
aFRR was only procured for certain hours in 2018, weekdays between the times 04-07 and 16-19, but is expected to be procured for all hours of the week from 2021 (Svenska Kraftnät, 2019f).
2.6.5 Tertiary reserve
The final reserve is the manual Frequency Restoration Reserve (mFRR), the purpose of this reserve is to unload the automatic reserves, so they are ready for the next disturbance and keep the frequency at the nominal value. It is activated manually by SvK and should be fully activated within 15 minutes but can take longer (Svenska Kraftnät, 2019d).
2.7 Energy storage characteristics and applications
Energy storage systems can be of various technologies, such as chemical, electrical, mechanical and thermal. This thesis focuses on Li-ion batteries as they are the most widely used technology within the DES for households as explained in Section 2.1.2. Li-ion batteries are categorized within the chemical energy storage.
2.7.1 Energy storage applications
What services BESS can provide is heavily dependent on how the power system is built, the legislation that applies to it and the power system market. These factors are constantly changing which means that the services provided also alter with time. Also, since all the services are essentially based on the act of the storage charging and discharging over a period of time, there are oftentimes no standard naming for the exact service between research papers and so different names can have the same meaning (Günter and Marinopoulos, 2016).
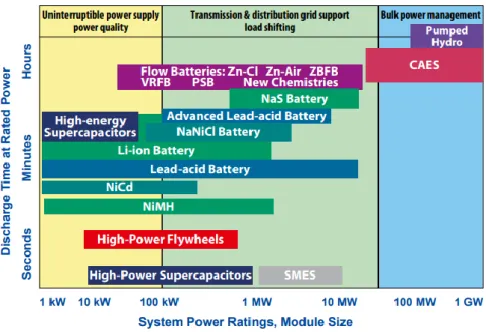
Some energy storage technologies are more suitable than others to provide grid services depending on their unique characteristics, such as the power it can discharge with. The Figure 11 below gives an indication on which technology is better suited for which scale and service, but according to the report from Sandia National Laboratories, it should be noted that these can change with time as each technology evolves and its prices decrease. It should therefore be noted that the figure is only meant to give a general idea of the technology’s capacity (Sandia National Laboratories, 2015).
-28-
Figure 11: Energy storage technologies based on their power rating and discharge times at rated power (Sandia National Laboratories, 2015)
Figure 11 shows that storage technologies such as pumped hydro and compressed air energy density (CAES) are able to discharge high amount of power for a long duration of time and therefore are suitable for large power management services. High-power flywheels and high-power supercapacitors on the other hand have smaller discharge times with less power; and are more suitable for power supply and quality services or grid support. As seen from Figure 11, Li-ion batteries are suited for services where the discharging duration is from minutes to hours. This should however not be confused with the battery’s response time which are in the time interval of milliseconds to seconds. Another advantage of Li-ion batteries is the high power and energy density combined with high efficiency (Das et al., 2018).
2.7.2 Key definitions of ESS
In order to understand the characteristics batteries some definitions are necessary to explain done below (IRENA, 2017).
• Energy: The capacity of the storage system, can also be considered to be the energy charged or discharged from the battery.
• Power: The rate of energy charges or discharged from the battery.
• Usable capacity: The amount of energy that can actually be discharged from the battery and be used.
• Installed capacity: The total amount of energy within the battery, batteries are often oversized as to not degrade the battery too much when discharging. Therefore, the usable capacity is larger than the usable capacity.
• State of Charge: The ratio of actual stored energy within the battery to the usable capacity of the battery.
-29-
3 Analysis method
To evaluate the mentioned case studies and answer the research questions, the following parameters self-consumption, self-sufficiency, total net present cost (NPC) and system payback time both discounted and simple.
3.1 Self-consumption
Self-consumption is defined as the solar electricity generated (𝐸𝑃𝑉) and consumed locally to the total electricity generated by the PV system (𝐸𝑇𝑜𝑡) (Beck et al., 2016). Having a battery (𝐸𝐵𝑎𝑡𝑡) in the system will increase the self-consumption as more of the PV generated electricity will be stored during excess generation and consumed locally during less generation. This parameter shows how much of the PV production is consumed locally and how having a battery can affect the system.
𝑆𝐶 = 𝐸𝑃𝑉+ 𝐸𝐵𝑎𝑡𝑡 𝐸𝑇𝑜𝑡
3.2 Self-sufficiency
The solar-sufficiency parameter shows the proportion of the load that is met by solar electricity (𝐸𝑃𝑉 and 𝐸𝐵𝑎𝑡𝑡) divided by the total electrical load (𝐸𝐷𝑒𝑚𝑎𝑛𝑑) (Cao, 2013). This is interesting to analyze when comparing to the base scenario with and without storage with the same demand.
𝑆𝑆 = 𝐸𝑃𝑉+ 𝐸𝐵𝑎𝑡𝑡 𝐸𝐷𝑒𝑚𝑎𝑛𝑑
3.3 Total net present cost (NPC)
The total net present cost (NPC) of a system is the present value for all the costs the system has over the project lifetime subtracted with the present value of all the revenue the system earns over the project lifetime, when taking the discount rate into account. It is an important parameter to use when comparing an investment.
The costs can be the capital cost, replacement costs, O&M costs, electricity bought from the grid and revenues can be the salvage value of the components at the end of the systems lifetime and the grid sales revenue made from selling excess electricity and provide frequency regulation (HOMER Energy, 2019a). The equation for NPC is shown below. The salvage value of the component is assumed as a linear depreciation to its lifetime and has the value of the investment cost of the module (HOMER Energy, 2019b)
𝑁𝑃𝐶 = 𝐼 + ∑𝐵𝑡+ 𝐶𝑡 (1 + 𝑑)𝑡 𝐿 𝑡=1 + 𝑆𝐿 (1 + 𝑑)𝐿 𝐼 – Initial capital cost of the system
𝐿 – Lifetime of project 𝐵𝑡 – Benefits from the system 𝐶𝑡 – Costs from the system 𝑑 – Discount rate
-30-
3.4 Payback time – Simple and Discounted
Another economic matric used is the payback time which calculated the amount of years the investment cost is recovered when compared to the base scenario with no investment (HOMER Energy, 2020). When installing a PV with a battery system an initial investment is done, these provide additional savings and income for each year. HOMER finds the year this cumulative income is equal to the investment cost. The pay-back period is calculated both simple and discounted. The simple payback time add the cumulative savings and income for each year and find the amount of years till it is payed back. The discounted payback time takes the discount rate of the project into account for each year. This parameter shows whether an investment is payed back within the project lifetime, how many years it takes and therefore if it is a valuable investment or not.
The simple payback time:
𝑆𝑃𝑇 = 𝐼𝐵
𝑆𝐵+ 𝑅 The discounted savings made throughout the project lifetime:
𝐷𝑆 = ∑ 𝑆𝐵+ 𝑅
(1 + 𝑑)𝑡 𝐿
𝑡=1
The discounted payback time:
𝐷𝑃𝑇 = 𝐼𝐵
𝐷𝑆 𝑆𝑃𝑇 – Simple payback time
𝐷𝑆 – Discounted savings 𝐷𝑃𝑇 – Discounted payback time
𝐼𝐵 – Initial capital cost of the PV and/or battery 𝐿 – Lifetime of project
𝑅 – Total revenue from frequency reserves 𝑆𝐵 – Annual saving from PV and/or battery 𝑑 – Discount rate
-31-
4 General methodology and assumptions
4.1 HOMER Grid
The modulating software HOMER Grid was used to calculate energy balance of PV and battery systems. HOMER stands for hybrid optimization of multiple energy resources and is developed by the National Renewable Energy Laboratory (NREL) which is intended to combine both the technical and economic aspects of an energy system. HOMER Grid focuses on PV together with storage components but also wind, CHP and backup generators can be added, and the software’s main focus is to optimize the value of behind-the-meter systems (HOMER Energy, 2019c).
4.1.1 Dispatch strategy
The dispatch strategy of HOMER Grid calculates how the electrical load should be served for every hour by the power generation sources in the system. The software has 48 hours knowledge beforehand from the current time step of the following:
• Electric demand for each time step
• The electricity price and the electricity selling price • PV production for each time step
• If power fee is included, the dispatch strategy also takes this into account by aiming to reduce the fee for each month (HOMER Energy, 2019d).
Based on this information the dispatch strategy optimizes how to best serve the load for the least cost for each time step. Having a battery in the system, the dispatch strategy also decides whether the battery should be charge or discharge to either the grid or the load for each time step.
The decision variable HOMER Grid optimizes for is to find the least NPC, dispatch strategy of the components and the power fee. For this study, the quantity of PV and battery sizing will be decided beforehand as the potential usage of the components is analyzed and not affected by todays cost of the components (HOMER Energy, 2019e).
The behind-the-meter services that are modeled in HOMER are explained in the next sections and are also shown in Figure 12.
Figure 12: Behind-the-meter services (Nguyen, 2018)
4.1.2 Increase PV self-consumption
The battery aims at storing the excess solar electricity generated rather than it being fed to the grid and discharges it to the household’s load as to increase the consumption of locally generated solar electricity. This ultimately reduces the electricity bought from the grid as well.