ACTA UNIVERSITATIS
UPSALIENSIS
Digital Comprehensive Summaries of Uppsala Dissertations
from the Faculty of Science and Technology
1131
Mine the Gaps
Evolution of Eukaryotic Protein Indels and their
Application for Testing Deep Phylogeny
ISSN 1651-6214 0346-5462 ISBN 978-91-554-8904-5
Dissertation presented at Uppsala University to be publicly examined in Lindahlsalen, Norbyvägen 18, Uppsala, Wednesday, 7 May 2014 at 10:00 for the degree of Doctor of Philosophy. The examination will be conducted in English. Faculty examiner: James McInerney (Department of Biology, NUI Maynooth, Ireland).
Abstract
Ajawatanawong, P. 2014. Mine the Gaps. Evolution of Eukaryotic Protein Indels and their Application for Testing Deep Phylogeny. Digital Comprehensive Summaries of Uppsala Dissertations from the Faculty of Science and Technology 1131. 58 pp. Uppsala: Acta
Universitatis Upsaliensis. ISBN 978-91-554-8904-5.
Insertions/deletions (indels) are potentially powerful evolutionary markers, but little is known about their evolution and few tools exist to effectively study them. To address this, I developed SeqFIRE, a tool for automated identification and extraction of indels from protein multiple sequence alignments. The program also extracts conserved alignment blocks, thus covering all major steps in preparing multiple sequence alignments for phylogenetic analysis.
I then used SeqFIRE to build an indel database, using 299 single copy proteins from a broad taxonomic sampling of mainly multicellular eukaryotes. A total of 4,707 indels were extracted, of which 901 are simple (one genetic event) and 3,806 are complex (multiple events). The most abundant indels are single amino acid simple indels. Indel frequency decreases exponentially with length and shows a linear relationship with host protein size. Singleton indels reveal a strong bias towards insertions (2.31 x deletions on average). These analyses also identify 43 indels marking major clades in Plantae and Fungi (clade defining indels or CDIs), but none for Metazoa.
In order to study the 3806 complex indels they were first classified by number of states. Analysis of the 2-state complex and simple indels combined (“bi-state indels”) confirms that insertions are over 2.5 times as frequent as deletions. Three-quarters of the complex indels had three-nine states (“slightly complex indels”). A tree-assisted search method was developed allowing me to identify 1,010 potential CDIs supporting all examined major branches of Plantae and Fungi.
Forty-two proteins were also found to host complex indel CDIs for the deepest branches of Metazoa. After expanding the taxon set for these proteins, I identified a total of 49 non-bilaterian specific CDIs. Parsimony analysis of these indels places Ctenophora as sister taxon to all other Metazoa including Porifera. Six CDIs were also found placing Placozoa as sister to Bilateria. I conclude that slightly complex indels are a rich source of CDIs, and my tree-assisted search strategy could be automated and implemented in the program SeqFIRE to facilitate their discovery. This will have important implications for mining the phylogenomic content of the vast resource of protist genome data soon to become available.
Keywords: indel, insertion/deletion, protein evolution, bioinformatics, non-bilateria,
eukaryotes, phylogeny
Pravech Ajawatanawong, Department of Organismal Biology, Systematic Biology, Norbyv. 18 D, Uppsala University, SE-75236 Uppsala, Sweden.
© Pravech Ajawatanawong 2014 ISSN 1651-6214
ISBN 978-91-554-8904-5
List of Papers
This thesis is based on the following papers, which are referred to in the text by their Roman numerals.
I Ajawatanawong P., Atkinson G.C., Watson-Haigh N.S.,
MacKen-zie B., Baldauf S.L. (2012) SeqFIRE: a web application for automat-ed extraction of indel regions and conservautomat-ed blocks from protein multiple sequence alignments. Nucleic Acids Res, 40:W340-W347. II Ajawatanawong P., Baldauf S.L. (2013) Evolution of the protein
indels in plants, animals and fungi. BMC Evol Biol, 13(1):140. [Highly Accessed]
III Ajawatanawong P., Baldauf S.L. An automatable method for high throughput analysis of evolutionary patterns in slightly complex in-dels and its application to the deep phylogeny of Metazoa. [Manu-script]
Appendix I: Ajawatanawong P. SeqFIRE: a users manual version 1.1. January 2014.
Contents
Insertion/Deletion ... 11
Indel versus gap ... 11
Mechanisms of indel formation ... 12
Classification of protein indels ... 13
Indels can be useful phylogenetic markers ... 14
Using indels as quantitative phylogenetic characters ... 15
Previous surveys of protein indels ... 16
Impact of indels on protein structure and interaction ... 17
Bioinformatic tools for protein indels ... 17
Animal Evolution ... 19 Phylum Porifera ... 20 Phylum Cnidaria ... 20 Phylum Ctenophora ... 21 Phylum Placozoa ... 22 Bilaterian animals ... 22
Hypotheses for early Metazoan phylogeny ... 23
Objectives ... 26
Materials and Methods ... 27
Software Development ... 27
Proteomic sources ... 27
Identification of orthologous proteins ... 27
Indel extraction and analyses ... 29
Expanded data sets used to search for metazoan CDIs ... 29
Summary of Paper I ... 30
SeqFIRE: an automated tool for indel analysis ... 30
Summary of Paper II ... 32
Identification of orthologous proteins ... 32
Evolutionary patterns of simple indels ... 33
Summary of Paper III ... 34
Evolutionary patterns in slightly complex indels ... 34
Future Prospects ... 36 Conclusions ... 37 Svensk sammanfattning ... 39
บทสรุป
(Summary in Thai) ... 42 Acknowledgements ... 46 References ... 51Abbreviations
aa Amino Acid
BLASTp Basic Local Alignment Search Tool for Protein CDI Clade-Defining Indel
DNA Dioxyribonucleic acid ECM Extracellular Matrix EF-1α Elongation Factor 1α EST Express Sequence Tag G+C content Guanine + Cytosine Content HTML Hypertext Markup Language I:D ratio Insertion:Deletion Ratio Indel Insertion/deletion JGI Joint Genome Institute LBA Long-Branch Attraction LSU Large Subunit
MCIC Modified Complex Indel Coding ME Minimum Evolution
mm Millimeter
MP Maximum Parsimony
MSA Multiple Sequence Alignment
NCBI National Center for Biotechnology Information NJ Neighbor-Joining
OTU Operational Taxonomic Unit
PAUP* Phylogenetic Analysis Using Parsimony (* and other methods)
PDB Protein Data Bank
PDF Portable Document Format PHP PHP: Hypertext Preprocessor PHYLIP Phylogeny Inference Package RGC Rare Genomic Change rRNA Ribosomal Ribonucleic Acid S Svedberg Unit
SeqFIRE Sequence Feature and Indel Region Extractor SIC Simple Indel Coding
SSM Slipped-Strand Mispairing SSU Small Subunit
Insertion/Deletion
Insertions and deletions are common genetic mutations. When an insertion occurs, a string of nucleotides is received into a sequence. Deletions are the opposite genetic event from insertions, in which part of a sequence is re-moved. A technique that can identify and visualize insertions and deletions is a “sequence alignment”. However, to distinguish insertions from deletions in a sequence alignment requires a symplesiomorphic (ancestral) sequence as a reference. Without this, we cannot identify the type of mutation, so we use the more general term “indel” to refer to a length variation among sequences without specified directionality.
All indels occur at the level of nucleotide sequences. Indels are less fre-quently found in sequence regions that encode proteins, because they will cause a frame shift mutation unless they are made up of multiples of three bases. Frame shifts can often cause loss of protein function, which can re-duce fitness of the organism. This is one reason that indels in protein coding sequences are generally much more rare than nucleotide substitutions. This thesis is aimed at understanding the evolution of protein indels, Therefore, the term “indel” will be used to refer to protein indels throughout the thesis. All protein indels result in the gain or loss of protein size and content, which can have an effect on protein structure and function. This may also reduce fitness, and therefore is another reason why protein indels are rare. The anal-ysis of indels is a relatively new area of research, so there is some indel ter-minology that must first be defined in order to avoid misunderstanding.
Indel versus gap
The goal of sequence alignment is to identify homologous positions among sequences. Addition of a gap (-) is a strategy used to deal with sequences that contain indels. It is important to clarify the difference between the term gap and indel. In the context of molecular sequence alignment, indel refers to a real genetic event, while gap refers to a space that is generated during sequence alignment, which seeks to reconstruct this genetic event (Giribet & Wheeler, 1999; Saurabh et al., 2012). However, if the alignment method is not accurate, gap and indel may refer to different positions, although they should be in the same place. In this case the gaps generated by the inaccurate methods are termed “pseudo-indels”.
Mechanisms of indel formation
There are a number of mechanisms that can generate indels in nucleotide sequences. One of the most common mechanisms is slipped-strand mispair-ing or SSM (Xmispair-ing & Lee, 2006). SSM is initiated by the mispairmispair-ing between nascent and template strands during DNA replication (reviewed in Levinson & Gutman, 1987; Garcia-Diaz & Kunkel, 2006; Fan & Chu, 2007). Mispair-ing usually occurs in nucleotide repeat regions, when the two DNA strands separate and then re-anneal out of alignment. The result will be a loop in one strand, and if DNA synthesis is continued, some bases will be gained or lost from the daughter strand. The consequence of the formation of a mispairing loop in the template strand is the generation of an insertion in the daughter strand. Alternatively, if the loop is formed in the template strand, the result will be a deletion in the daughter strand (Figure 1).
Figure 1. Simple diagram of slipped-strand mispairing (SSM). The pairwise se-quence on top of the figure shows the original sese-quences. If a loop is formed in the primer strand, it will cause an insertion in the daughter strand whereas if a loop is formed in the template strand, it will cause a deletion. The nucleotides with a black background show the polymerized regions.
Indels generated by SSM are relatively short (about 1-30 amino acids). There are a number of other mechanisms known to generate longer indels, such as DNA recombination (i.e., unequal crossing over between chromo-somes) and transposition (Li & Graur, 2000; Qian & Goldstein, 2001).
-ACGAGTAAAA!
-TGCTCATTTTTCGAT-!
-ACGAGTA A
AAGCTA
-!
-TGCTCATTTTTCGAT-!
AA!
-ACGAGTAAAA
GCTA
-!
-TGCTCAT TTCGAT-!
TT!
Classification of protein indels
There is no universally accepted classification system for indels, particularly protein indels. Primarily, indels are classified into either insertions or dele-tions, but pairwise comparison of sequences makes it difficult to distinguish the ancestral state of those sequences. Li (1997) divided indels based on size and mechanisms into (i) short indels (around 20-30 bases), which are main-ly caused by errors of the cellular machinery during replication, such as SSM, and (ii) long indels, which are caused mainly by unequal crossing over and transposition (Giribet & Wheeler, 1999).
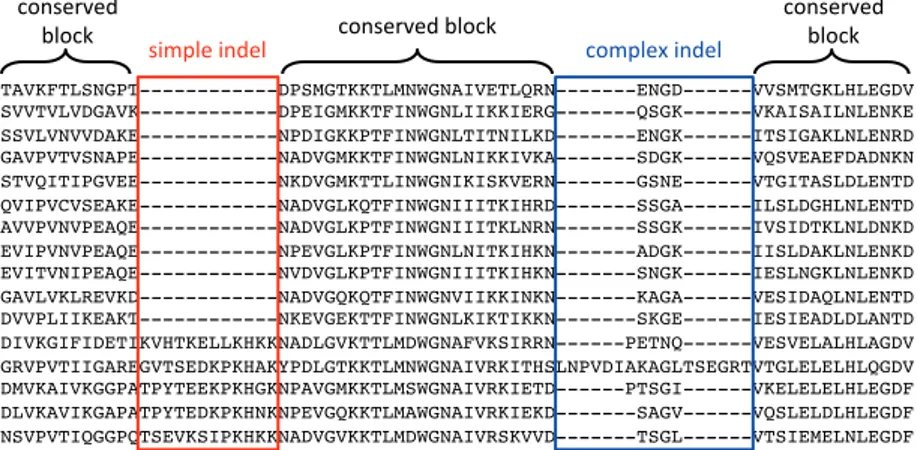
In this thesis, I propose an alternative classification for protein indels us-ing indel patterns and the number of implied genetic events. Based on these criteria, protein indels are classified into simple indels and complex indels (Ajawatanawong et al., 2012; Ajawatanawong & Baldauf, 2013). A simple indel comprises two clear states, present or absent. These indels appear to be caused by a single genetic event. On the other hand, complex indels are the results of multiple genetic events (Figure 2).
Figure 2. Examples of simple and complex indels, shown in the red and blue blocks, respectively. Gaps are indicated by a dash (-).
Another important criterion for indel classification that is also used in this thesis is the potential evolutionary information that the indel provides. De-fining these indels depends on a reference phylogeny. Based on this rule, indels can be divided into four different types (Figure 3) as follows.
• Clade defining indel (CDI): these are supporting a particular clade. CDI characters are consistent with internal branches of the reference tree. These indels maybe useful for assigning additional taxa to the reference phylogeny or help to resolve controversial relationships within the tree. • Singleton indel: this is an indel that is presented in only one sequence in
the dataset. By definition this indel will be present only on a terminal branch of the tree.
TAVKFTLSNGPT---DPSMGTKKTLMNWGNAIVETLQRN---ENGD---VVSMTGKLHLEGDV! SVVTVLVDGAVK---DPEIGMKKTFINWGNLIIKKIERG---QSGK---VKAISAILNLENKE! SSVLVNVVDAKE---NPDIGKKPTFINWGNLTITNILKD---ENGK---ITSIGAKLNLENRD! GAVPVTVSNAPE---NADVGMKKTFINWGNLNIKKIVKA---SDGK---VQSVEAEFDADNKN! STVQITIPGVEE---NKDVGMKTTLINWGNIKISKVERN---GSNE---VTGITASLDLENTD! QVIPVCVSEAKE---NADVGLKQTFINWGNIIITKIHRD---SSGA---ILSLDGHLNLENTD! AVVPVNVPEAQE---NADVGLKPTFINWGNIIITKLNRN---SSGK---IVSIDTKLNLDNKD! EVIPVNVPEAQE---NPEVGLKPTFINWGNLNITKIHKN---ADGK---IISLDAKLNLENKD! EVITVNIPEAQE---NVDVGLKPTFINWGNIIITKIHKN---SNGK---IESLNGKLNLENKD! GAVLVKLREVKD---NADVGQKQTFINWGNVIIKKINKN---KAGA---VESIDAQLNLENTD! DVVPLIIKEAKT---NKEVGEKTTFINWGNLKIKTIKKN---SKGE---IESIEADLDLANTD! DIVKGIFIDETIKVHTKELLKHKKNADLGVKTTLMDWGNAFVKSIRRN---PETNQ---VESVELALHLAGDV! GRVPVTIIGAREGVTSEDKPKHAKYPDLGTKKTLMNWGNAIVRKITHSLNPVDIAKAGLTSEGRTVTGLELELHLQGDV! DMVKAIVKGGPATPYTEEKPKHGKNPAVGMKKTLMSWGNAIVRKIETD---PTSGI---VKELELELHLEGDF! DLVKAVIKGAPATPYTEDKPKHNKNPEVGQKKTLMAWGNAIVRKIEKD---SAGV---VQSLELDLHLEGDF! NSVPVTIQGGPQTSEVKSIPKHKKNADVGVKKTLMDWGNAIVRSKVVD---TSGL---VTSIEMELNLEGDF!
• Homoplastic indel: These are indels that are in conflict with the refer-ence phylogeny. If they map to regions of the tree that are confidently resolved by other data, then it can be assumed that those indels arose in-dependently. However, if there are controversial relationships in the tree, these indels need to be considered as possible support for alternative hy-potheses.
• Ambiguous indel: These indel cannot be interpreted due to a lack of se-quences data from taxa that fall between taxa possessing the indel. These are particularly common for indels for deeper branches in the tree. Fur-ther taxon sampling is needed to identify the origin of the indel.
Figure 3. Examples of clade defining (CDI, red block), singleton (green block), and homoplastic (blue block) indels for the reference phylogeny shown on the left hand side. Correspondingly colored bars on the tree indicate the phylogenetic positions of respective indels.
Indels can be useful phylogenetic markers
Most molecular phylogenetic studies are based on substitutions found in DNA and protein sequences. The power of these phylogenies has advanced greatly, particularly with the development of improved evolutionary models (review in Whelan et al., 2001), phylogenetic noise reduction techniques (Townsend et al., 2012) and powerful search algorithms (Lewis, 1998; Hill
et al., 2005; Stamatakis et al., 2005; Stamatakis, 2006; Ronquist et al.,
2012). However, these analyses are still plagued by artifacts such as mis-identification of homoplasy when substitutions are near saturation, long-branch attraction (LBA) and independent substitution among sites (Wägele & Mayer, 2007; Philippe et al., 2011; reviews in Moreira & Philippe, 2000; Bergsten, 2005).
As an alternative approach to avoid these problems, Rokas and Holland (2000) advocated the use of rare genomic changes (RGCs) for reconstructing phylogenetic relationships. RGCs are larger-scale mutational changes that
! SVVTVLVDGAVK---DPEIGMKKTFINWGNLIIKKIERG---QSGK---VKAISAILNLENKE! SSVLVNVVDAKE---NPDIGKKPTFINWGNLTITNILKD---ENGK---ITSIGAKLNLENRD! GAVPVTVSNAPE---NADVGMKKTFINWGNLNIKKIVKA---SDGK---VQSVEAEFDADNKN! STVQITIPGVEE---NKDVGMKTTLINWGNIKISKVERN---GSNE---VTGITASLDLENTD! QVIPVCVSEAKE---NADVGLKQTFINWGNIIITKIHRD---SSGA---ILSLDGHLNLENTD! AVVPVNVPEAQE---NADVGLKPTFINWGNIIITKLNRN---SSGK---IVSIDTKLNLDNKD! EVIPVNVPEAQE---NPEVGLKPTFINWGNLNITKIHKN---ADGK---IISLDAKLNLENKD! EVITVNIPEAQE---NVDVGLKPTFINWGNIIITKIHKN---SNGK---IESLNGKLNLENKD! GAVLVKLREVKD---NADVGQKQTFINWGNVIIKKINKN---KAGA---VESIDAQLNLENTD! DVVPLIIKEAKT---NKEVGEKTTFINWGNLKIKTIKKN---SKGE---IESIEADLDLANTD! DIVKGIFIDETIKVHTKELLKHKKNADLGVKTTLMDWGNAFVKSIRRN---PETNQ---VESVELALHLAGDV! GRVPVTIIGAREGVTSEDKPKHAKYPDLGTKKTLMNWGNAIVRKITHSLNPVDIAKAGLTSEGRTVTGLELELHLQGDV! DMVKAIVKGGPATPYTEEKPKHGKNPAVGMKKTLMSWGNAIVRKIETD---PTSGI---VKELELELHLEGDF! DLVKAVIKGAPATPYTEDKPKHNKNPEVGQKKTLMAWGNAIVRKIEKD---SAGV---VQSLELDLHLEGDF! NSVPVTIQGGPQTSEVKSIPKHKKNADVGVKKTLMDWGNAIVRSKVVD---TSGL---VTSIEMELNLEGDF! KEEVHYADI---DDRNRIAVYCLK---DTYLPIKLLEKLMSLVNGCRVTGIPLSYL! KEDVHYSII---HTRRRLAVYCLK---DAYLPLRLMDKLMS---TGVPLDWL! KEDVHYSII---ETRRRLAVYCLK---DAYLPLRLMEKLMA---TGVPFSYL! KEDVHYSAI---ETRRRLAVYCLK---DAYLPQRLLDKLMY---TGVPLNYL! KEDVHHSII---ETRRRLAVYCLK---DAYLPQRLLDKLMYLTNGARVTGVPISFL! KEDVHHSIITDLQNGNAETRRRLAVYCLK---DAYLPQRLLDKLMFLTNGARVTGVPISFL! KEDVHHSIISDLQNGNSETRRRLAVYCLK---DAYLPQRLLDKLMY---TGVPISFL! KEDVHHSIISDLQAGNEETRRRLAVYCLKARYRNMQDAYLPQRLVDKLMY---TGVPMSFL!
tend to involve multiple nucleotide positions and are much more rare than single nucleotide substitutions (Rokas & Holland, 2000). Examples of RGCs include indels, signature sequences, transposon insertions and gene duplica-tion events.
It has been recognized for some time that indels are potentially powerful phylogenetic markers (Lloyd & Calder, 1991; Rokas & Holland, 2000). For example a ~12-aa insertion in the elongation factor 1α (EF-1α) protein was among the first evidence that animals and fungi are sister taxa (Baldauf & Palmer, 1993; Steenkamp et al., 2006). Six indels from four nuclear genes were used to root the phylogenetic tree of eutherian mammals (de Jong et al., 2003), and another insertion in EF-1α was proposed as support for the eo-cytes (extremely thermophilic, sulfur-metabolizing bacteria) as the sister group of eukaryotes (Rivera & Lake, 1992), an hypothesis that is receiving increasing support (Cox et al., 2008; Williams et al., 2013).
Rokas and Holland (2000) suggested the reason that RGCs such as indels should be such good phylogenetic markers is that they should be less prone to homoplasy than simple sequence substitutions. Theoretically, any charac-ter that occurs rarely should have lower rates of convergent and parallel evo-lution. In the case of protein indels, the complexity of the indel pattern should also make homoplasy (independent gain or reversal) easier to detect when it does occur.
Using indels as quantitative phylogenetic characters
Unlike many rare genomic changes, indels can be found in relatively large numbers and are much easier to find than other types of RGCs, especially when whole genome sequence data are available. This has led to interest in trying to reconstruct phylogeny based solely on indels. One problem in using indels as evolutionary chraracters is the lack of sophisticated models for weighting indels. The problem is complex enough with simple indels, which can be scored as presence/absence (0/1) in a simple character matrix (Aja-watanawong et al. 2012). However, even then, indels of all different lengths are weighted equally, which does not reflect their probabilities (Ajawatan-awong & Baldauf, 2013). Incorporation of indels into phylogeny becomes even more difficult in the case of complex indels, where there are multiple states that may be related to each other in different ways.
A number of methods have been proposed to score indels for phylogeny, primarily using parsimony (Young & Healy, 2003; Müller, 2006; Simmons
et al., 2007; Belinky et al., 2010). The three most commonly used methods
are “5th state” gap coding (all gaps positions scored separately), simple gap
coding (SIC, gaps scored as presence/absence only) and modified complex indel coding (MCIC, indels scored as multi-state characters corresponding to different indel states) (reviewed in Simmons et al. 2007). Simmons et al.
(2007) compared the performance of the six most commonly used methods of gap coding using simulated DNA alignments of varying accuracy. They found that 5th state coding out-performed all other methods, although this was largely because it over-weighted gaps (Simmons et al. 2007). Mean-while, SIC and MCIC performed similarly and all methods out-performed ignoring gaps completely.
The only large analysis of protein indels in phylogeny is by Belinky et al. (2010). They extracted over 1,000 protein indels from 11 animal proteomes and examined the effects of taxon sampling, indel length and coding meth-ods and the use of different ortholog subsets on parsimony tree reconstruc-tion. Their results from these data show that indels are sensitive to the same artifacts as substitution based phylogeny, most notably LBA and taxon sam-pling effects. They also confirmed that indels are rich in homoplasy. These and other analyses are beginning to reveal the fact that the idea that RGCs, such as protein indels are phylogenetic characters with low homoplasy turns out to be quite naive (Bapteste & Philippe, 2002; de Jong et al., 2003; Paper
III).
Previous surveys of protein indels
Most of the early work and even much of the current work on protein indels has been done by structural biochemists, because indels are the most chal-lenging parts of the protein structure to solve and to model (Pascarella & Argos, 1992; Pang et al., 2005; Cherkasov et al., 2006; Hsing & Cherkasov, 2008; Tóth-Petróczy & Tawfik, 2013). These surveys have been aimed pri-marily at understanding protein structure, function and interaction. These analyses have shown that most protein indels occur in loops at the surface of the protein structure (Pascarella & Argos, 1992; Benner et al., 1993; Romero
et al., 2006; Kim & Guo, 2010). Analysis of more than 5,000 indels from
protein tertiary structure shows that single amino acid indels are the most common type (Pascarella & Argos, 1992). This observation has been con-firmed with a number of analyses and surveys (Ajawatanawong & Baldauf, 2013). The frequency of indels also decreases exponentially with indel size (Ajawatanawong & Baldauf, 2013; Chong et al., 2013).
However, there are some indel-tolerant proteins that allow indels to occur within the secondary structure elements (α-helix and β-sheet), for example the maltose binding protein (Betton et al., 1993) and T4-lysosyme (Heinz et
al., 1993). Structural study of the 12-aa insertion in human EF-1α shows a
surface expose hairpin structure formed by aa insertion, whereas the 12-aa insertion is nonexistent among eukaryotic parasites, such as Leishmania
donovani, a species of intracellular parasitic protozoa that causes
leishmani-asis (Nandan et al., 2007). The 12-aa indel in human EF-1α is found near a small inhibitor ligands binding pocket. Molecular docking shows that
lig-ands cannot bind to the inhibitor site of human EF-1α because of the indel. This makes indel is a potential drug target for parasitic eukaryotes that ur-gently need to investigate for new medicines (Cherkasov et al., 2005; Nan-dan et al., 2007). Based on this idea, there is a survey of protein indels as a drug target among several parasitic proteomes (Cherkasov et al., 2006).
Impact of indels on protein structure and interaction
Hsing and Cherkasov (2008) released a database of structural indels extract-ed from all pairwise alignments of highly similar protein (>50% similarity) found in the Protein Data Bank (PDB). Analysis of indels with the secondary structure of proteins shows the amino acid bias in indels that tend to locate on the surface of protein. Moreover, indels are not only commonly found in loop (undefined structures), they are also found in α-helix and β-sheet.
Interestingly, analysis of amino acid sequences flanking at both ends of any protein indel from IndelFR database demonstrated high amino acid sub-stitution (poor amino acid similarity), particularly the nearest flank site has lowest similarity (Zhang et al., 2001a; Zhang et al., 2001b). Moreover, com-parisons of protein structures also show high conformation distance in the high amino acid substitution sites. Both indels and amino acid substitution might play an important role in the evolution and diversity of protein struc-ture and function (Zhang et al., 2010; Zhang et al., 2011a; Zhang et al., 2011b).
Recently, it was observed that protein indels tend to be more frequently found in essential proteins than in non-essential proteins (Chan et al., 2007). This observation was done using the complete knock out data for Bacillus
subtilis 168, Escherichia coli K12 and Saccharomyces cerevisiae. The
amounts of indels in essential proteins are significantly greater than in non-essential proteins in all three proteomes. Protein network analysis in S.
cere-visiae shows that the indel containing proteins have higher potential to
inter-act with other proteins (Chan et al., 2007). Furthermore, analysis of protein-protein interaction between S. cerevisiae and Drosophila melanogaster (fruit fly) shows that indel containing proteins have high variation of protein inter-action. The result suggests that indels can have a significant influence on protein interaction and it has been suggested that indels an important method for rapidly and significantly modifying interaction networks (Hormozdiari et
al., 2009).
Bioinformatic tools for protein indels
Computer software for indel analysis has been developed in the last decade. Most of them are developed for analysis of DNA indels in various purpose,
such as INDELSCAN for annotation of species-specific and non-species-specific indels from genome sequences (Chen et al., 2007), SeqState for annotation of character information for phylogenetic analysis (Müller, 2005) and SOAPindel for calling short indels from unmapped DNA sequences (Li
et al., 2013).
There are two databases of protein indels, Indel PDB – the collection of closely related protein indels (Hsing & Cherkasov, 2008) and IndelFR – the collection of indel flanking regions of domain proteins (Zhang et al., 2001b). Indel PDB database
Resently, I developed SeqFIRE, an automated web application for identi-fication and extraction of protein indels and conserved blocks (Ajawatan-awong et al., 2012). This program can also identify indels into simple and complex types. If the program detects simple indels in the alignment, Se-qFIRE will score those indels in a NEXUS matrix as present (1) or absent (0). Moreover, the program will provide the indel mask alignment (no indels in the alignment) in FastA format.
Animal Evolution
Early morphology based phylogeny of animals suggested that Porifera is a monophyletic sister clade to the remaining animals, or “epitheliozoa” (Fig-ure 4). This is based on the fact that sponges lack an epithelial layer, which is unique in this phylum. Among epitheliozoa, the Placozoans lack an extra-cellular matrix (ECM), whereas the remaining animals have this property. So, based on this feature it was inferred that the Placozoa should be the se-cond branch of metazoa with the remainder of taxa with ECM referred to as eumetazoa. Cnidaria and Ctenophora have ECM but lack bilaterial symmetry and therefore were assumed to branch next. These taxa are similar in nervous system (nerve net), extracellular digestion in gastrovascular carvity (bodu carvity), tentacles projection around the mouth, mostly diploblastic (mostly endoderm and ectoderm), etc. and some proposed they form a single clade (Philippe et al., 2009). However, Cnidaria spermatocytes lack acrosomes (an organelle locates at the head of sperm cells and containing enzymes for di-gesting egg cell coating), a common feature in Ctenophora and Bilatera (re-viewed in Dohrmann & Wörheide, 2013).
Figure 4. Animal phylogeny based on morphology (modified from Dohrmann & Wörheide, 2013).
Early molecular phylogeny of animals based on the 18S small subunit (SSU) and 28S large subunit (LSU) rRNA sequences (Figure 5B) also suggested
the monophyly of bilateria, but the tree seems to be ambiguous in the deep-est animal branches, commonly referred to as the “non-bilaterian animals” or “radiata”. Even sponge is the sister-taxa of the remaining animals, but the second deepest branch of animal tree becomes Ctenophore. Moreover,
Tri-choplax sp. and Cnidaria are form a clade and this clade be the sister taxa of
bilateria (Bridge et al., 1995; Kim et al., 1999).
Non-bilaterian animals have radial symmetry, or as corals and sponges - no symmetry (asymmetry). They contains four major phyla: Porifera, Cni-daria, Ctenophora and Placozoa.
Phylum Porifera
Poriferea or “sponges” can be found in both fresh water and marine habitats. Sponges are very diverse in shape and mostly asymmetric. They are multi-cellular but lack organs, nerves, and a circulatory system. Basically, sponges possess a lot of tiny pores (ostia) around the body that are used to pump wa-ter into a canal-like structure (aquiferous system), and drain the wawa-ter out from a larger pore (osculum). They develop a type of flagellated cell, called choanocyte (collar cell) that can catch food inside the water-pumping struc-ture.
Sponges can be classified into four classes: Demospongiae (demospong-es), Hexactinellida (glass spong(demospong-es), Calcarea (calcareous spong(demospong-es), and Ho-moscleromorpha. Phylogenetic analysis shows that every individual class is monophyletic group (Philippe et al., 2009; Pick et al., 2010). Although all sponges share the same basic morphology several molecular phylogenetic analyses still suggest the paraphyly of sponges (Borchiellini, 2001; Pennisi, 2003; Sperling et al., 2009). Topology of the paraphyly tree shows Der-mospongia is the first branch, follow by Calcispongia. The Homoscleromor-pha is the sister taxon of epitheliozoa (Sperling et al., 2009). Recently, the concept of sponge is a monophyletic group becomes again more popular (Thacker et al., 2013).
Phylum Cnidaria
Cnidaria are exclusively aquatic animals with >10,000 described species. They are diploblasts, i.e. they have two tissue types, endoderm and ecto-derm, which are separated by a non-cellular layer of meosglea, a gelatineous layer that separates inner and outer cell layers. They are named after the cnidocytes cells for capturing prey. They have radial symmetry and two basic body plans: either a polyp or a bell-like medusa. In some species, these are different stages in the life cycle, while in others one stage or the other appears to have been lost. There is a single opening into the body cavity,
which serves as both mouth and anus. The opening is surrounded by a num-ber of tentacles that contain cnidocytes. The cnidocytes possess capsules, called nematocysts, which contain poisonous fluid that is used to paralyze or killed their prey.
The phylum is divided in to four major classes namely, Anthozoa (sea anemones, corals, sea pens), Cubozoa (box jellies), Hydrozoa (hydras), and Scyphozoa (jellyfish). Phylogenetic analysis of complete SSU sequences of Cnidaria shows Anthozoa as the sister group to the other three classes (to-gether referred to as Medusozoa or Cubozoa + Hydrozoa + Scyphozoa) with 100% and 98% bootstrap supported in maximum parsimony (MP) and min-imum evolution (ME), respectively (Collins, 2002).
Phylum Ctenophora
Ctenophora are commonly called “comb jellies” and live in marine habitats worldwide. Their main distinguishing characteristic is eight rows of comb strips, which are arranged vertically from top to bottom of the body. These combs consist of thousands of cilia that are used for locomotion and scatter light, giving a rainbow effect. Many species are un-pigmented and nearly transparent, but most species have bioluminescence, which is produced from photocytes under the comb plates (Pang & Martindale, 2008).
Similar to Cnidarians, the Ctenophore body consists of a mesoglea sand-wiched between an outer layer of ectoderm and an inner layer of endoderm. They also possess a single opening to their body cavity. Due to such appar-ently strong resemblance to each other, the two groups were long classified together as phylum Coelenterata. However, this is no longer accepted, large due to the fact that ctenophores and cnidarians differ strongly in their modes of locomotion. The comb jelly moves by the movement of cilia at the comb plates, which are supported by a number of muscle cells, whereas jellyfish move by pumping water out of the medusa structure to force forward move-ment. Cnidarians also possess a string that is poisonous to prey, but cteno-phores use sticky tentacles for catching prey (Pang & Martindale, 2008).
Only the genome sequence of Mnemiopsis leidyi is available for Cte-nophora (Srivastava et al., 2010). Furthermore, ctenophore sequences show very long branches in multigene trees, suggesting that they may be affected by long-branch attraction (LBA) (Dunn et al., 2008; Kohn et al., 2012; Osigus et al., 2013). Thus there is considerable controversy regarding the exact position of ctenophores within the animal phylogenetic tree (reviewed in Dohrmann & Wörheide, 2013). Analysis of EST sequences from 150 genes and 77 taxa place ctenophores as the deepest branch of the metazoan phylogeny (Dunn et al., 2008). Likewise, Hejnol (2009) and his colleagues constructed a tree from a 1487-gene matrix, and the resulting tree also shows Ctenophora iplaced at the base of the Metazoa. An analysis of 242 genes
including data from the genome sequence of the ctenophore Mnemiopsis
leidyi also places ctenophores as the sister group of all other animals,
includ-ing Porifera (Ryan et al., 2013). Meanwhile a phylogenetic tree based on mitochondrial sequences places ctenophores as a sister clade of Hexacti-nellida sponges, within the phylum Porifera (Osigus et al., 2013), an even more surprising position.
Phylum Placozoa
In 1883, a German zoologist, Franz Eilhard Schulze, discovered a novel organism on the wall of a marine aquarium in Austria (Syed & Schierwater, 2002). This animal was flatted and round like a small disk, about 1-2 mm in diameter. Because of the simple body plan, it was thought to be a cnidarian larva for a century. However, histological, embryological and cell cycle studies showed its uniqueness, which clearly placed it in a new phylum: Placozoa (Eitel & Schierwater, 2010 and and references therein). Trichoplax
adhaerens is the only described placazoan, although there may be other yet
undiscovered species (Voigt et al., 2004). The body is flattened dorsal- and ventrally, and both surfaces are covered with cilia used for movement. De-spite being multicellular, Trichoplax feeds by phagocytosis, gliding on top of its food (organic detritus) and engulfing it.
Phylogenetic analyses give very different results regarding the position of Placozoa. This is probably complicated by the fact that there is only a single taxon to represent the entire “phylum”, so its sequences tend to form long branches in phylogenetic trees. Trees of LSU and SSU rRNA genes suggest
Trichoplax is a sister taxon of the Cnidaria (Kim et al., 1999). However,
analysis of the secondary structure of the SSU rRNA does not support this (Ender & Schierwater, 2003). Phylogeny based on 12 mitochondrial genes places Trichoplax as the deepest branch in the tree of animals (Dellaporta et
al., 2006). However, a phylogenetic tree reconstructed from 104 single-copy
nuclear genes placed Placozoa as the first major branch after Amphimedon
queenslandica, the only one sponge proteome at that time (Srivastava et al.,
2008).
Bilaterian animals
Bilaterians include the bulk of Metazoan diversity, and evidence supporting them as a monophyletic group is unambiguous (Philippe et al., 2005; Lartil-lot & Philippe, 2008; Paps et al., 2009; Simakov et al., 2013). Mostly they have bilateral symmetry (except for phylum Echinodermata) and a coelom, a gut with two openings. The bilaterians are divided into two monophyletic groups: protostomes (develops mouth before anus) and deuterostomes
(de-velops anus before mouth) (reviewed in Erwin & Davidson, 2002; Baguñà et
al., 2008; Lartillot & Philippe, 2008; DeSalle & Schierwater, 2008).
Molecu-lar data further divides protostomes into two monophyletic groups: Ecdyso-zoa (Arthropoda, Onychophora, Tardigrada, Nematoda, Nemetomorpha, Kinorhyncha, Loricifera, Priapulida) and Lophotrochozoa (Annelida, Bryo-zoa, Sipuncula, Mollusca, Nemertes, Entoprocta, Phoronida, Brachiopoda). Deuterostomes comprise the phylum Chordata, Hemichordata and Echino-dermata. However, this thesis focuses on the earliest branches of Metazoa, which predate the deuterostome-protostome split.
Hypotheses for early Metazoan phylogeny
Molecular data analysis of animal evolution has generated a large amount of incompatible trees reconstructed from different datasets and/or methods of analysis. Sequences for non-bilaterian animals have been rare until quite recently, and except for rRNA, are still available from only a few taxa. The classical analyses using sequences of 18S rRNA (Bridge et al., 1995; Kim et
al., 1999) showed a monophyletic Cnidaria + Placozoa (Figure 5B) as the
sister-group of Bilateria. Traditional and recent analyses of morphology places Porifera as the first branch of Metazoa (Figure 5A) (Mallatt et al., 2010), which is also seen in the 18S rRNA tree (Figure 5B).
Dunn and his colleagues (2008) published the first large multigene phy-logeny of Metazoa, comprising 150 genes from 77 animal taxa. Surprisingly, the phylogenetic tree placed Mnemiopsis leidyi (Ctenophora) as the first branch of the Metazoa with bootstrap support >90% (Figure 5C). This sug-gests early evolution of tissues, which must have been lost in Porifera or the complex morphology of M. leidyi evolved independently from the remaining animals. However, sequences for Placozoa were not available at the time.
Philippe et al., (2009) assembled a concatenated dataset of 128 protein coding genes from 55 taxa, including more outgroups (11), avoiding meta-zoa with long branches and including the Placometa-zoa and nine taxa of sponges that cover four major groups of sponges. Their tree supports a monophyletic group of Coelenterata (Cnidaria + Ctenophora), and places this group as sister to Bilateria (Figure 5D). Most importantly, this phylogeny shows a monophyletic Porifera as the deepest branch of Metazoa, which is in agree-ment with morphology and 18S trees (Figure 5A and 5B).
Meanwhile, re-analysis of the dataset of Dunn et al. (2008) with 17 addi-tional taxa, including Placozoa still places Ctenophora as the first split in Metazoa, and further shows the sponges as paraphyletic, which Demospon-gia branch first, then Homoscleromorpha (Hejnol et al., 2009) (Figure 5C). Alternatively, Schierwater et al., (2009) combined morphological characters along with 15 mitochondrial and 16 additional nuclear coding genes plus 18 genes from Dunn et al. (2008) study to build a phylogenetic tree. This tree
places all non-bilateria into a single clade, which they call urmetazoa, with
Trichoplax as the deepest branch within the urmetazoan clade (Figure 5F;
Schierwater et al., 2009).
Figure 5. Six hypotheses in metazoan evolution. The traditional point of view is based on animal morphology (reviewed in Dohrmann & Wörheide, 2013) (A). The most widely used molecular region for phylogenetic analysis is 18S rRNA (B). The third hypothesis suggests Ctenophora is the early branching of Metazoa (C). The fourth hypothesis suggests the monophyly of phylum Coelenterata, and shows that Porifera is the first branch of animals (D). The fifth hypothesis suggests that Placo-zoa is the sister-taxa of bilateria and still shows that Porifera is the sister-clade of the remaining animals (E). The last hypothesis suggests that the animal phylogeny is separated in to two monophyletic groups: bilateria and radiate (F).
Pick et al., (2010) suggested that the position of Ctenophora as the deep-est branch of Metazoa in the Dunn et al. tree (2008) is an artifact, due to
long-branch attraction. Using a new dataset with increased sampling of non-bilaterian animals and removal of the long-branch outgroups, they find Po-rifera to be the deepest branch of the animal tree. This is followed by sepa-rate branches for Ctenophora and Cnidaria. Placozoa in this tree is sister-taxon of bilaterian animals (Pick et al., 2010) (Figure 5E). However, phylo-genetic analysis using the genome sequence of Mnemiopsis leidyi (Ctenoph-ora) again placed Ctenophora as the deepest branch of animals (Figure 5C). The latter study also found genes for a set of neural components in the ge-nomes of M. leidyi and Amphimedon queenslandica (Porifera). This supports the argument that Porifera may have evolved from more complex ancestors by loss of cell differentiation (Ryan et al., 2013).
All these disagreements between phylogenetic trees reconstructed from expanded matrix datasets lead some to suggest that different genes may have different evolutionary history (Nosenko et al., 2013). This led the latter au-thors to suggest that concatenated-genes phylogenies might not be appropri-ate to solve ancient phylogenetic questions, such as the relationships be-tween major groups of Metazoa and instead there was a need for “ develop-ment of new, sequence-independent genomic markers” (Nosenko et al.,
2013)
Belinsky et al. (2010) extracted protein indels from 1,185 predicted orthologs. Those indels were non-single-aa indels for solving deep Metazoan phylogeny. The indel tree shows a monophyletic group of bilateria and Cni-daria as the sister-taxon of Bilateria. Nevertheless the tree seems to be sensi-tive to LBA and also have high homoplasy (Belinky et al., 2010).
Objectives
Aims of this thesis are
1. To develop a tool for automated identification and extraction of indels from protein multiple sequence alignments. The tool is meant to aid in the identification of potentially phylogenetically useful indels, be user friendly, and made available via a webserver and a downloadable form that can be implemented in a bioinformatic pipeline. (Paper I)
2. To analyze evolutionary patterns in a set of indels extracted from a broad taxonomic sampling of multicellular eukaryotes, focusing primarily on the simple (two-state) indels (presence/absence). This required the de-velopment of a semi-automated pipeline for identification of universal (among eukaryotes) protein orthologs and extraction of all indels using the tool developed for Objective 1 (Paper II).
3. To analyze general evolutionary patterns in the remaining, “complex” indels, extracted under Objective 2. (Paper III).
4. To analyze the full set of complex indels extracted under Objective 2 with respect to the deep phylogeny of Metazoa. (Paper III)
Materials and Methods
Software Development
In order to analyze general evolutionary patterns in protein indels, a bioin-formatic tool for extraction and analysis of protein indels is needed in order to build a large database to work with. To address this issue, I developed SeqFIRE (Sequence Features and Indel Regions Extractors), a web applica-tion for the identificaapplica-tion and extracapplica-tion of protein indels from an alignment. The core program was written in standard Python language, and the web interface was developed using HTML and PHP. The program contains two analytical modules: an indel region module and a conserved block module (Paper I, and see details of algorithm in chapter 2 and 3 in Appendix I). The official SeqFIRE website is available at the URL: www.seqfire.org.
Proteomic sources
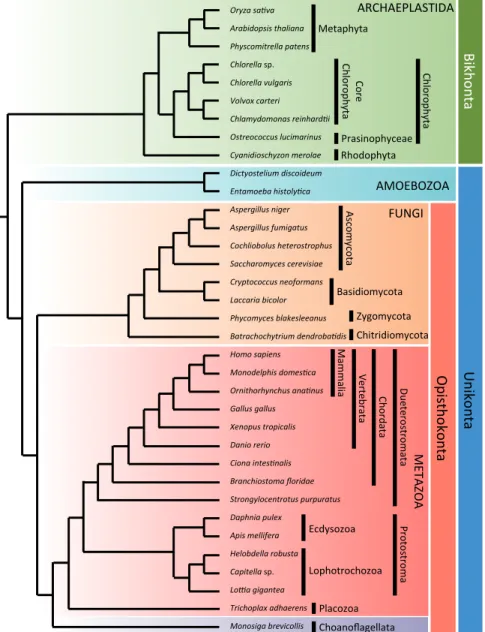
A set of 35 proteomes (Figure 6), representing a taxonomically broad sam-pling primarily of the three kingdoms of multicellular eukaryotes, namely plants, animals and fungi, were used for the identification of universal orthologous proteins. These proteomes comprise 15 animals, one choanoflagellate, eight fungi, nine Archaeplastida and two Amoebozoa. The complete proteome data were downloaded from the NCBI (Geer et al., 2010) and Joint Genome Institute (JGI) databases (Grigoriev et al., 2011). The evolutionary relationship of the 35 taxa is shown in Figure 6.
Identification of orthologous proteins
Using the complete proteomic data, I identified the universal orthologous proteins among those 35 taxa in a stepwise manner. I selected three starter proteomes, one each from plants (Arabidopsis thaliana, A), animals (Danio
rerio, D) and fungi (Saccharomyces cerevisiae, S). The orthologous protein
predictions between all possible pairwise combinations of those three prote-omes (S-D, S-A, D-A) were carried out using the program InParanoid (O’Brien et al., 2005). Then, I used Python scripts to screen the clusters for ones that had a single member from each of the three proteomes. Sequences
shorter than 250 amino acid residues were discarded because they are too short for reliable control trees. All proteins in the resulting clusters are re-ferred to here as seed orthologs.
Figure 6. Evolutionary relationships among the 35 eukaryotes used in this thesis (Hejnol et al., 2009; Parfrey et al., 2010).
For each cluster all seed orthologs were used as queries in protein similarity searches (BLASTp) against the remaining 32 proteomes. All hits above E-value < 1e-60 were collected and added to the appropriate clusters. Each
cluster was aligned using MUSCLE version 3.6 (Edgar, 2004a; Edgar, 2004b), and neighbor-joining (NJ) trees were constructed using SeaView (Gouy et al., 2010). Based on the NJ-tree, all out-paralogs were separated into a different file and all redundant (identical) sequences were discarded. In case of in-paralogs, only the shortest branch was retained. Long-branch sequences were discarded, as well as incomplete sequences (shorter than 250 amino acid residues). Each cluster was then re-aligned by MUSCLE before continuing to the downstream analyses.
Indel extraction and analyses
Protein indels were identified and extracted from all MUSCLE-aligned orthologous proteins using SeqFIRE standalone version 1.0 (Paper I). The indel extraction was run with a 50% similarity threshold, no amino acid sub-stitution group (all changes weighted equally), and with three positions for inter-indel space. All indels in the indel list format were stored in a single file. The characters of the indels, such as the indel ID, indel length, number of indel states, type of indel, etc. were stored in a database.
SeqFIRE automatically scores the extracted indels as simple or complex. The simple indels were then further classified into four different types based on their evolutionary patterns: singleton indels (present in only one se-quence), clade-defining indel (CDIs – consistent with a known phylogeny), homoplastic indels (inconsistent with a known phylogeny), and ambiguous indels (too much missing data to interpret). Complex indels also include one single dominant indels, which occur in one state plus singleton variants.
Expanded data sets used to search for metazoan CDIs
No CDIs for animals were found among the simple indels (Paper II). There-fore, to look for CDIs for deep branches of animals, I expanded the data sets to include sequences from the other four available non-bilaterian animal genomes. These are Amphimedon queenslandica (sponge, Porifera),
Nema-tostella vectensis (sea anemone, Cnidaria), Hydra magnipapillata (hydra,
Cnidaria), and Mnemiopsis leidyi (comb jelly, Ctenophora). These proteomes were searched using seed orthologs from Danio rerio (zebra fish) as a query for individual BLASTp searches on the genome web site of NCBI. Sequenc-es were added to the appropriate protein cluster filSequenc-es, then the clusters were re-aligned using MUSCLE in SeaView (Gouy et al., 2010). All indels were extracted from the resulting alignments using the standalone version of Se-qFIRE with the parameters stated previously.
Summary of Paper I
Ajawatanawong P, Atkinson GC, Watson-Haigh NS, MacKenzie B, Baldauf SL. 2012. SeqFIRE: a web application for automated extraction of indel regions and conserved blocks from protein multiple sequence alignments. Nucleic Acids Res 40: W340-W347.
Multiple sequence alignment (MSA) is a common task in sequence analysis. Most work emphasizes collecting information from the conserved parts of an alignment, i.e. universally alignable gap-free regions. Variable parts of the alignment are usually ignored or discarded, i.e. regions with insertions or deletions (indels). However, indel regions can carry powerful markers for evolution. A number of indels have driven important discoveries in molecu-lar evolution, such as the monophyly of animals and fungi (Baldauf, 1999), and the root of eutherian mammals (de Jong et al., 2003).
Part of what makes indels such potentially strong characters is that homo-plasy is thought to be rare to occur, and relatively easy to detect when it does. The probability of two different fragments of DNA with the same se-quences and same length integrating into the genome in the same spot is theoretically very low. The complexity of indel patterns should also make homoplasy easier to detect than for simple nucleotide substitutions. This complexity makes complete reversal of indels to the ancestral state also like-ly to be rare. However, phylogeneticallike-ly useful indels are still expected to be rare. Therefore, their identification requires sifting through large volumes of data, which is not feasible to do manually. For these reasons, we decided to develop a program for high-throughput analysis of protein indels, to look for potentially good evolutionary markers.
SeqFIRE: an automated tool for indel analysis
For paper I, I developed SeqFIRE (Sequence Feature and Indel Region Ex-tractor), a web application for identification and extraction of indel regions and conserved blocks from protein MSA. The main purpose of SeqFIRE is for identifying and extracting indels (“indel module”). However, in order to make the program more complete, I also included a module for the other major task of MSA analysis, i.e. data preparation for phylogenetic analysis (“conserved block module”).
The core program of SeqFIRE was written using standard Python lan-guage (without any special module). As a result, the user can run the standalone version of SeqFIRE or the pipeline standalone version of Se-qFIRE in any process without installing any Python bundle modules. To make SeqFIRE easier to use for non-bioinformatician researchers, a user-friendly interface was developed to make it easy to adjust the parameter set-tings and view the output. The web interface was developed using HTML and PHP. The program comprises two modules: the indel region module and the conserved block module. It is freely available at www.seqfire.org/.
SeqFIRE provides two modes of analysis for both modules: single align-ment and batch modes. The program was designed for analyzing aligned protein sequences, but nucleotide alignments can also be analyzed (requires setting substitution model to NONE). For the single alignment mode, the user can either copy the MSA and paste it into the input box or upload an input file. SeqFIRE also includes a standalone Python program for combin-ing files as input for the batch mode. This program, called SeqFIREprep, also splits the resulting output back into several output files.
SeqFIRE generates several different types of output. The main output for the indel region module is a sequential list of indels that also marks the in-dels as simple or complex. In addition, there are four other outputs: an anno-tated alignment in JalView and in text mode, an indel matrix, and a masked alignment (alignment with indel regions removed). The conserved block module generates six types of output: an annotated alignment in JalView and text mode, a full alignment including a conserved block profile (in FastA and NEXUS format), and a masked alignment in both FastA and NEXUS for-mats. I also wrote a simple online help manual as well as a more comprehen-sive manual, which is downloadable as a PDF file from the website and also included here as Appendix I.
At the request of one reviewer, I also performed a benchmark analysis of the SeqFIRE conserved block module against the only other widely used multiple alignment editor available at the time, G-Blocks (Castresana, 2000; Talavera & Castresana, 2007). This showed that SeqFIRE is more flexible and consistently retains substantially more regions of high confidence alignment than G-Blocks. The SeqFIRE website has recorded 2,359 hits over 20 countries since it went online in December 2011.
Summary of Paper II
Ajawatanawong P, Baldauf SL. 2013. Evolution of protein indels in plants, animals and fungi. BMC Evol Biol 13: 140.
Most large-scale surveys of indels have been aimed at understanding protein structure, since indels are one of the hardest parts of protein structure to model (Chen et al., 2007; Hsing & Cherkasov, 2008; Zhang et al., 2011). These studies usually identify indels from pairwise alignments of sequences. As a result, all indels are recognized as two state characters, i.e. present or absence. However, the requirements for identifying evolutionarily informa-tive indels are more complex. These indels must be identified from multiple sequence alignments, and their hosts must be orthologous proteins.
This led to the second objective of the thesis, using the bioinformatic tool SeqFIRE (Paper I) to analyze the phylogenetic potential of protein indels. To do this, I started by assembling a database of single or low copy number orthologous proteins from a set of largely multicellular eukaryotes, for which relationships among the major groups are well resolved. I then extracted all indels from this database using SeqFIRE and used the known phylogenies of the host organisms to evaluate evolutionary patterns in these indels.
Identification of orthologous proteins
To construct a dataset for protein indel analyses, I started by identifying orthologous proteins by all possible pairwise comparisons of three test pro-teomes. These included one representative each of the three major groups of multicellular eukaryotes, i.e. fungi (Saccharomyces cerevisiae), animals (Danio rerio), and plants (Arabidopsis thaliana). The universal proteins among these three proteomes were collected as potential ‘seed orthologs.’ The resulting seed protein clusters were automatically screened for two re-quirements - single copy in the three proteomes and >250 amino acids in length (Paper II).
The orthologous protein clusters was then expanded to include an addi-tional 32 eukaryotic proteomes using BLASTp. Target species were selected to give a broad taxonomic sampling of three major multicellular groups, plus two Amoebozoa. After parsing the BLAST results, a total of 299 putative
universal orthologous proteins among the 35 eukaryotic taxa of plants, ani-mals and fungi were obtained (Paper II).
Evolutionary patterns of simple indels
In total, 4,707 protein indels were extracted from these orthologs. One fifth of them (901 indels) are simple indels, and the remainders are complex in-dels (3,806 inin-dels). Because the number of simple inin-dels was large enough to identify significant patterns and this could be done using largely automat-ed methods, unlike complex indels, analyses in Paper II were focusautomat-ed pri-marily on the patterns of simple indels.
Indels were first analyzed in terms of basic patterns such as size-class fre-quency, host protein size. The simple indels were then divided into four cat-egories based on their evolutionary patterns. These catcat-egories are (i)
single-ton indels, indels found in only one taxon, (ii) clade-defining indels or CDIs, indels that support a specific clade in the known phylogeny, (iii) ho-moplastic indels, indels that conflict with the known phylogeny, and (iv) ambiguous indels, indels that could be CDIs but cannot be classified
be-cause of missing data from within the potentially relevant clade(s).
The largest proportion of simple indels is singleton indels (about 61%). Their distribution varies widely across an expanded phylogenetic tree with no apparent pattern except that insertions are consistently more common than deletions. Although these ratios also vary widely across the tree, again with no apparent pattern, the average insertion:deletion (I:D) ratio across a wide sampling of eukaryotes is 2.31. This ratio contrasts with non-coding regions (Petrov, 2002), for which deletions are more common than inser-tions.
Mapping of the 901 indels onto the known phylogeny showed that 9.7% were homoplastic. Nonetheless a total of 69 CDIs were found to be con-sistent with the given phylogeny. Simple CDIs were found to support mon-ophyly of all the examined supergroups (Metazoa, Fungi, Opisthokonta, Amoebozoa and Unikonta). Most of the CDIs supporting internal branches were for fungal clades (40 CDIs). A substantial number were also found for some Archaeplastida clades (13 CDIs). However, no simple CDIs were found to support any of the internal branches of animals.
Overall analyses in this paper show that among simple indels, evolution-arily informative simple indels are very rare (4,707 indels from 299 proteins yielded 69 CDIs). Furthermore I found that CDIs are less frequent than ho-moplastic indels. Therefore, using indels alone to reconstruct phylogenetic trees may be a very error prone method.
Summary of Paper III
Ajawatanawong P, Baldauf SL. 2014. An automatable method for high throughput analysis of evolutionary patterns in slightly complex indels and its application to the deep phylogeny of Metazoa. [Manuscript]
This paper consists of two parts. In the first half of the paper, I described analyses of general patterns in complex indels, similar to the analyses de-scribed in Paper II for simple indels. In the second half of the paper, I use this information to test some important questions in the early evolution of Metazoa using slightly complex indels.
Evolutionary patterns in slightly complex indels
Simple indels cover about one-fourth of all identified indels. In this paper (Paper III), I explored the evolutionarily patterns within the complex indels, which is the major group of indels. First I divided the indels by the number of states, which ranged from two to thirty-one states. However, it became apparent that two-state complex indels are really simple indels with addi-tional alignment columns included because the alignment adjoining the indel was poorly conserved and therefore fell below the SeqFIRE indel region cut-off (50% consensus). Therefore the two-state complex and simple indels were combined into a single bin and called “bi-state indels”. The remaining complex indels (3- 31 states) are then referred to as “multi-state indels”.
Analysis of I:D ratio in the bi-state singleton indels confirms the insertion bias pattern observed for simple singleton indels (compare to Paper II). Both indel types show a strong bias of insertions over deletions. In fact, the I:D ratio is even higher when the two categories are combined (2.66 versus 2.31 for simple indels alone, Paper II). I:D ratio continues to show wide taxon-specific variation from 1.0 to 6.9 (plus one outlier at 13.0). However, the distribution of these I:D ratios still shows no pattern across the phyloge-netic tree, e.g. there is no apparent relationship to taxonomic group, lifestyle (parasitic vs free-living, photosynthetic vs heterotrophic, single vs multicel-lular), G+C content, or genome size.
Three- to nine-state indels make-up about 75% of the multi-state indels, and the rest of the work described in this paper focuses on these. Unlike simple indels, homoplastic indels are less common than CDIs in multi-state
complex indels. So, those indels (three-state to nine-state complex indels) are combined with bi-state indels, called “slightly complex indels”. Analysis of CDIs in slightly complex indels shows a similar pattern with the CDIs from simple indels (Paper II). That is, a much larger number of CDIs are found to support branches of Fungi and Archaeplastida (506 and 289 indels, respectively). However, unlike with simple indels, among slightly complex indels, a number of CDIs are also found that support branches within Meta-zoa (99 indels). This confirms that slightly complex indels are a rich source of potential CDIs.
Insights into early Metazoan evolution based on indels
To further explore mechanisms for applying slightly complex indels to spe-cific phylogenetic questions, I chose to focus on early metazoan evolution. This is because most of the OTUs in the dataset are metazoan proteomes, and because Metazoa are the most taxonomically broadly sampled of the three major groups of multicellular eukaryotes, especially for the deepest branches in the taxon. Furthermore, from the CDI analysis in the previous section, I identified 42 orthologs that might host useful indels for early meta-zoan evolution. Therefore, four more species were added to the dataset, rep-resenting early branches of Metazoa (non-bilateria), i.e. one poriferan -
Am-phimedon queenslandica (demosponge), two Cnidarians - Nematostella vec-tensis (sea anemone) and Hydra magnipapillata (hydra) and one Ctenophore
- Mnemiopsis leidyi (comb jelly).
The total of 49 informative indels extracted from 42 orthologous proteins were scored as present/absent (0/1) and stored in a matrix. It was then used to reconstruct parsimony tree using PAUP* version 4.0 beta (Swofford, 2002). Six indels were identified in six different proteins that support Cte-nophora as the earliest branch of Metazoa. This is consistent with recent large multigene phylogenies, but not with phylogeny based on morphology or mitochondrial genes. Three indels were also found that support
Trichop-lax adhaerens as the closest sister-group of Bilateria, and one indel was
found suggesting that Cnidaria is paraphyly.
The early branching position of Ctenophore implies that the last common ancestor of Metazoa was more complex than traditionally postulated, and thus the morphological simplicity of Porifera represents a reduced state. It has been suggested that the early branching position of Ctenophora in large multigene phylogenies might be an LBA artifact, and phylogenetic analyses aimed at reducing possible LBA place Porifera as the earliest branch. How-ever, LBA is a quantitative artifact and not relevant to indel pres-ence/absence. On the other hand, there is abundant evidence for Cnidarian monophyly, suggesting that the indel discovered here is homoplaseous.
Future Prospects
The findings in my thesis are important for understanding indel evolution, particular with reference to their use as phylogenetic markers. There has also been a lack of a convenient tool to easily process the large amounts of data necessary in order to find and assess indels that are potentially useful for phylogeny. SeqFIRE version 1.0, which is presently available online, ad-dresses some of these needs, by making it possible to find large numbers of simple indels. However, my subsequent research shows that much useful phylogenetic information, at least for deep evolutionary branches is found in slightly complex indels. Therefore, in the future I plan to implement a new algorithm for the identification of slightly complex indels. There are also a number of other planned improvements, such as recognizing different input file formats (not only FastA format), such as NEXUS and PHYLIP. I will also automate the alignment step to fast iterative alignment methods, so the user can start with unaligned sequences or possibly re-align regions of the alignment that look interesting.
In my thesis, there are several steps that were done manually, especially the analysis of slightly complex indels. To make the searching of indels fast-er, I plan to create an automated pipeline for indel identification, extraction and analyses, using a user-defined input tree. It may also be possible to au-tomate steps in the analysis of slightly complex indels. This would be espe-cially useful, as some of the most interesting indels seem to be slightly com-plex, especially for older evolutionary relationships.
As I show in this thesis, indels can be powerful evolutionary markers not only in animal evolution, but also in other groups of organism. This is un-doubtedly true throughout the eukaryote tree of life. As more protist genome sequences become available, searching for the clade-defining indels (CDIs) for every supergroup of eukaryotes will be possible. These could be very useful for the study of deep eukaryotic evolution.
Conclusions
In my thesis, I developed an automated tool for identification and extraction of indels and conserved blocks, which are an important part of the prepara-tion of MSAs for phylogenetic analysis. This will be a useful tool for phylo-genetic research for many groups of organisms. All parameters in the pro-gram are fully adjustable, which allows the user to be able to extract indels and conserved blocks under a wide range of conditions. The core script is written in the standard module of Python language that is easy to modify, so that the pipeline can be adapted to any high throughput process (Paper I).
I have also explored the patterns of indel distribution, and as a result I propose that protein indels should be split into two basic types, simple and complex indels. This is based on the number of hypothesized genetic events that gave rise to the indel, but also on the practical consideration that it is easier to recognize evolutionary patterns in simple indels (Paper I). Because of this, it is possible to automate the search for simple indels, so that a large database can be assembled. As a result, analyzing the phylogenetic patterns of this simplest indel class can potentially yield a substantial amount of use-ful phylogenetic information with minimal user effort.
A survey of protein indels among plants, animals and fungi showed that complex indels are four times more frequent than simple indels in protein coding regions. In general these indels tend to be short (1-5 amino acid), and the most abundant indels are only a single amino acid long. The number of indels is linearly correlated with the length of the indel-host protein. Im-portantly, I found that insertions are more than twice as common as deletions for simple singleton indels. I also found potential CDIs for all examined major branches of Archaeplastida and Fungi, but none for Metazoa despite the fact that many more taxa were included in the study. This suggests that Metazoa have a slow evolutionary rate for universal single copy proteins (Paper II).
Exploration of complex indels suggested reclassification of all indels to bi-state and multi-state indels. Analyses of bi-state indels confirmed a string bias towards insertions in singleton indels, as well as a number of other pat-terns observed for simple indels as described in Paper II. CDIs supporting a number of important deep branches of Metazoa were also found in the pool of slightly complex indels. This confirms that complex indels are a reservoir of CDIs (Paper III).
Finally, I explored the early metazoan specific CDIs further, using addi-tional proteomitc data. Nearly all the CDIs identified were consistent with a single tree based on parsimony criteria. This tree places Mnemiopsis leidyi (Ctenophora) as the earliest branch of animals, branching before the single represent sponge, Amphimedon queenslandica (Porifera). The tree also sup-ports Trichoplax adhaerans (Placozoa) as the sister taxon of bilaterian ani-mals (Paper III).