Driving with automation
The association between subjective opinions of automated in-vehicle systems and quantitative measures of driving
performance Per-Anders Oskarsson er & o gf <C f n CO o < = Al CB < c & =
Swedish National Road and (j Transport Research Institute
Driving with automation
The association between subjective opinions of automated
in-vehicle systems and quantitative measures of driving
performance
Per-Anders Oskarsson
Master s thesis, 20 p The Cognitive Science Program Linkdping University
1999
Supervisors:
Erik Lindberg (Dep. of Education and Psychology, Linkoping University)
Swedish National Roadand 1999 12401
'Transport Research Institute
S 5 81 95 Linkoping Sweden Project:
University Collaboration
Author: Sponsor:
Per-Anders Oskarsson Swedish National Road and Transport
Research Institute (VTI)
Title:
Driving with automation - The association between subjective opinions of automated in-vehicle systems and quantitative measures of driving performance
Abstract
The purpose of this report was to investigate how drivers subjectively experienced trust and acceptance of automated in vehicle systems are associated with their measurable driving per-formance. Data from two previously performed driving simulator studies of the interaction with Adaptive Cruise Control (ACC) systems were studied. It was hypothesised that a lower acceptance of the ACC system was associated with a more aggressive driving style, for example higher driving speed and a shorter distance to the vehicle ahead. It was also hypothesised that higher trust in the ACC was associated with later intervention in critical situations. It was shown that lower acceptance of an automatic ACC was associated with a more aggressive driving style in situations where the drivers caught up with slower vehicles. It was also shown that trust in an automatic ACC was associated with later intervention when the drivers mistakenly thought that the ACC would brake. When a telephone task was performed together with driving with the automatic ACC, the driving measures were more homogeneously distributed. This implies that when drivers are more mentally loaded by a competing task, they are more inclined to hand over control of the driving task to an automatic system.
ISSN: Language: No. of pages:
Summary
To increase traf c safety and make driving more comfortable, automated in-vehicle systems are developed. Adaptive Cruise Control (ACC) systems, for example, assist drivers in the task of controlling driving speed and distance to the vehicle ahead. When such systems are implemented, it is essential that issues of driver acceptance, trust and situation awareness are taken into thorough consideration.
If automated in-vehicle systems are not accepted among the majority of the driving population, their frequency of use will probably be very low, and consequently also their contribution to the enhancement of traf c safety. The use of automated in-vehjcle systems is also dependent on drivers trust in the systems. Muir (1994) means that if operators trust the automation too much, they may become complacent and fail to override automatic control even when the automation is faulty. If that is the case, too much trust in automated in vehicle systems may have negative consequences for traf c safety in situations where drivers have to intervene. Finally, if an automated in vehicle system is to be accepted, the interaction with it must reasonably proceed with as little effort as possible. It is therefore necessary that the user
understands the system and the reasons for its activities; but without situation awareness, the
user will scarcely reach this understanding. Situation awareness can according to Endsley (1996) be divided into three levels: level 1) perceiving critical factors in the environment, level 2) understanding what those factors mean, and level 3) understanding what will happen within the system in the near future.
Because the supply of human attention is limited, working memory capacity may be the main bottleneck for situation awareness (Endsley, 1997). She means that these limitations can partly be circumvented by long-term memory stores, most likely in the form of mental models. Furthermore, she means that high levels of automation may reduce the operator s task to system monitoring, which in turn may have negative consequences for situation awareness.
Based on the discussion of trust and acceptance, the purpose of this study was to inves-tigate how drivers subjectively experienced trust and acceptance of automated in-vehicle systems are associated with their measurable driving performance. For this purpose, empirical data om two previously performed studies of driver interaction with ACC systems were further analysed. Both studies had been performed in the VTI (Swedish National Road and Transport Research Institute) driving simulator.
It was hypothesised that lower acceptance of the ACC system was associated with a more aggressive driving style, for example: higher driving speed and shorter distance to the vehicle ahead. It was also hypothesised that higher trust in the ACC was associated with later intervention in critical situations.
It was shown that:
0 Lower acceptance of the automatic ACC was associated with a more aggressive driving style in situations where the drivers caught up with slower vehicles.
0 Trust in the automatic ACC was associated with later intervention in situations where the drivers mistakenly thought that the ACC would brake.
0 When the mental demands increased, the drivers seemed more inclined to accept the sup-port of the informative ACC system. However, if they simultaneously performed a telephone task that competed with the driving task, no association between acceptance and mental demands were found.
- Acceptance of the automatic ACC was generally high, irrespective mental demands. 0 When the automatic ACC was used together with the telephone task, the driving measures
were more homogeneously distributed. Thus, when drivers are more mentally loaded by competing working tasks, they seem more inclined to hand over control of the driving task to an automatic system.
Table of contents
INTRODUCTION 3
PURPOSE ...5
THEORETICAL OVERVIEW 5 SITUATION AWARENESS ...5
Implications for road traf c... .. 6
Implications for accidents ... 6
Implicationsfor type ofinterface ... .. 7
Implicationsfor design ... .. 8
TRUST IN AUTOMATED SYSTEMS ...9
Implicationsfor accidents ... .. 10
ACCEPTANCE ... 10
Environmental in uence ... .. I 1 Individual user characteristics... .. I 1 Driver attitudes to systems... .. 12
Frequency of implementation ... 12
HYPOTHESES ... .. 13
Acceptance ofthe ACC ... 13
Trust in theACC... ..14
METHOD 15 DESCRIPTIONS OF THE DRIVING STUDIES ... .. 15
Driving simulator... .. I 5 Study of normal driving ... .. I 6 Study ofcritical driving ... ..19
SELECTION OF DRIVING SITUATIONS AND VARIABLES ... ..21
Stuay ofnormal driving ... ..21
Study ofcritical driving ... .. 23
RESULTS AND DISCUSSION 24 ACCEPTANCE OF THE ACC ...24
Association with driving speed... .. 24
Association with variability in driving speed... .. 27
Association with minimum time headway to the car ahead ... 29
Association with variability in time headway to the car ahead... .. 31
Summary ofthe associations with driving variables ... .. 33
Association with mental demands... .. 34
Summary of the associations with mental demands... .. 3 7 TRUST IN THE ACC...38
Association with time headway when braking was initiated... .. 38
Association with maximum braking force ... .. 40
GENERAL DISCUSSION 41 WHAT DO THE RESULTS TELL US? ... ..41
About acceptance... 41
About mental demands ... .. 41
About trust... 42
WAS THE PURPOSE OF THE STUDY FULFILLED? ... ..43
About the design ofthe study ... 43
About mental demands... .. 44
About situation awareness... .. 44
FUTURE RESEARCH ... ..44
General driving performance.... ... .. 44
Integrated systems ... .. 44
CONCLUSIONS ...45
REFERENCES 46
Driving with automation
The association between subjective opinions of automated in-vehicle systems and quantitative measures of driving performance
Introduction
In the wake of a never-ending sophisticated science of engineering, the twentieth century has turned into the privileged observer of the rise of a plethora of computerised automated sys-tems. Many of these systems have developed into truthful and indispensable companions in man s constant endeavours for safety and support. In high-risk areas, such as military
surveil-lance and guidance, nuclear power, aviation and railroad where accidents, but even small
mis-takes, can lead to devastating and incalculable consequences, automated systems have been used a relatively long time. In recent years, accelerating progress in computer science has also led to a more co st realistic possibility to develop comparable automated systems for the pur-pose ofprotecting us om many of the risks in the non-commercial working elds we meet in daily life.
One of the greatest risks facing ordinary people in everyday life is undoubtedly road traf-c. Therefore, research in traf c safety can also be considered as an area with implications for public health. One essential branch of this research is the development of different technical in-vehicle artefacts for surveillance of the ongoing traf c situation. The main purpose of these
devices is of course to make tra ic safer, but also to make driving more comfortable; which
hopefully in addition can be expected to result in safer tra c as a positive side e ect. The main types of devices developed so far are Collision Avoidance Systems (CAS), Adaptive Cruise Control (ACC) and navigation systems. However, research is also being carried out into sev-eral other types of devices, such as vision enhancement systems for driving in fog (e.g. Nilsson & Alm, 1996).
There are mainly two different techniques for the operation of these devices. They can either give a warning in order to alert the driver s attention, or simply momentarily intervene by taking over control and, depending on the current situation, steering away the vehicle or braking it. This means that automation can be implemented at different levels, where informa tive systems that give warnings have a lower level of automation than intervening systems. According to Endsley s (1996) de nition of levels of automation, informative systems are on level two, whereas the levels of automation of intervening systems range om three to ve (Table l). The term automatic systems that occurs in this text refers mainly to intervening automated systems (level 3-5).
Unless in-vehicle systems are introduced while considering the broader issues of driver acceptance, drivers may sabotage the systems and undermine their potential (Lee, 1997). Therefore, if the safety purpose of an automated in vehicle system is to be met, it must no doubt be received with acceptance among the majority of the driving population. Otherwise drivers will not use it; or perhaps even worse, if they useit without acceptance, it may lead to the development of strange and unsafe driving behaviour just in order to avoid activation of the
Table 1. The roles ofhuman and system at different levels ofcontrol and automation (adapted om Endsley, I996)
Level of automation Human System
1. None Decide, act
-2. Decision support Decide, act Suggest
3. Consentual AI Concur Decide, act 4. Monitored AI Veto Decide, act 5. Full automation --- Decide, act
It can reasonably be assumed that a basic prerequisite for acceptance of a technical de-vice is that the interaction between the user and the dede-vice can proceed smoothly with as little effort as possible. Otherwise the interaction will take up too much of the user s attentional resources, resulting in fatigue or bewilderment. These kinds of mental conditions are of course, according to the stated safety purpose of the systems, of the greatest importance to avoid. Therefore, when in-vehicle systems are developed, the whole range of human inherent cogni tive limitations must be given thorough consideration. Nowadays, this might seem a fairly ob-vious conclusion, but the awareness of the association between issues studied in cognitive psy chology and the human operator s interaction with the machine is comparatively recent. It was not before the late 19603 and 1970s that according to Hollnagel (1988), it was realised that the operator, as a human being, could not be described as a machine. This insight came om stud ies of operator performance in process control, where it was made clear that operators, as human beings, not only reacted to information presented on panels and meters, but also acted on the basis of their understanding of the context and the speci c task. Thus, the need to have a model of how the operator s mind worked, independent of the design of the man-machine system, was nally recognised.
To be able to interact effortlessly with an automated technical device, the user must con-sequently understand the system and the reasons for its activities. To facilitate this under-standing, we build mental models. Mental models can be described as our internal representa-tions of the environment, providing a mechanism for representing the understanding of the situation (Serfaty, MacMillan, Entin & Entin, 1997). Consequently, in situations where the driver needs to take over control, or react quickly and correctly to given warnings, under-standing ofthe ongoing processes in the traf c environment is necessary. This awareness of the ongoing situation is often denoted situation awareness (SA) (e.g. Endsley, 1997)
Situation awareness is obviously of fundamental importance for the driver s ability to interact effortlessly with a system. Therefore, an introductory overview of this concept will be given. This will also include a general discussion about how situation awareness is related to human interaction with automated systems. As already mentioned, situation awareness is be-lieved to be a basic foundation for the driver s possibility to attain acceptance of an automated in vehicle surveillance system. Therefore, the in uence of situation awareness is also discussed in the following sections, which focus on trust and acceptance of automated systems.
Purpose
The purpose of this study was to investigate how drivers subjectively experienced trust and acceptance of automated in-vehicle systems are associated with their measurable driving per-formance.
The background is that Nilsson and Nabo (1996) showed that both driving performance and subjective opinions were differently affected depending on whether an informative or an automatic ACC system was used. Furthermore, Nilsson (1996) showed that the use of an automatic ACC system in critical situations can lead to later intervention. That is, these previ-ous studies examined how these variables differed between the two ACC systems in variprevi-ous driving conditions. In this present study, which can be seen as a continuation of these previous studies, individual data were further analysed in order to examine explicitly how the subjective opinions of each ACC system were associated with the measures of driving performance under the various driving conditions.
Theoretical overview
Situation awareness
Imagine a critical dynamic situation characterized by high time constraints. There is no time to think, and all actions must be executed immediately. If an operator under such circumstances interacts with the interface of an automated system, and also has to intervene, understanding of the ongoing processes in the surrounding environment is decisive for the operator s possibility to in a more or less instinctive manner choose the right action. Therefore, it has been of inter-est to measure and evaluate people s ability to comprehend the state of their surrounding envi-ronment. A working eld especially characterized by critical situations with limited decision times is military aviation. With this in mind, it is scarcely surprising to nd Endsley (1996) re-marking that situation awareness is a term originally used among pilots. In 1991, a working group in the United States Air Force Staff produced the following de nition of the operator s situation awareness: apilot s continuous perception of self and aircraft in relation to the dynamic environment of ight, threats, and mission, and the ability to forecast, then execute tasks based on that perception (Waag & Bell, 1997).
Endsley (1997) gives the following formal de nition of situation awareness: the per-ception of the elements in the environment within a volume of time and space, the comprehen-sion of their meaning and the projection of their status in the near future. Furthermore, she divides situation awareness into the following three levels: level 1) perceiving critical factors in the environment, level 2) understanding what those factors mean, particularly when integrated together in relation to the person s goals, and level 3) the highest level that gives an under-standing of what will happen within the system in the near future.
Endsley (1997) states that because the supply of attention is limited, more attention to some information may mean a loss of situation awareness on other elements. She consequently emphasizes that working memory capacity may be the main bottleneck for situation awareness
when people are dealing with novel situations, and thus seriously constraining the decision making process.
Long-term memory also has consequences for situation awareness (SA). Experienced decision makers use long-term memory stores, mo st likely inthe form of schemata or mental models, to circumvent the limitations in working memory (Endsley, 1997). Furthermore, she means that a well-developed mental model provides: a) knowledge of the relevant elements of the system that can be used in directing attention and classifying information in the percep-tion process, b) a means of integrating elements to form an understanding of their meaning (level 2 SA), and c) a mechanism for projecting iture states of the system based on its current state and an understanding ofits dynamics (level 3 SA).
Endsley (1997) consequently claims that the use of mental models provides the decision-maker with default information. She claims that this may be decisive for achieving situation awareness in challenging domains where information is missing, or the operator is too heavily loaded to acquire all the necessary information.
Implicationsfor road traf c
Of the countless dangers facing man in the interaction with the machine, many threats seem, as
already mentioned, attributable to situation awareness. Furthermore, as long as there is a need to intervene in critical situations, it seems reasonable to believe that the need to maintain situa-tion awareness increases when the level of automasitua-tion increases. Therefore, measures to
maintain situation awareness appear most important in areas where the level of automation of the introduced systems is generally high. Such an area is certainly aviation. Eighty-eight per-cent of the aviation accidents reported over a four-year period by the NTBS (National Trans-portation Safety Board) as being caused by human error, were for example also reported to have a lack of situation awareness as a major casual factor (Endsley, 1997).
If situation awareness is of importance for aviation safety, then it surely must also be a central issue when automated systems are introduced in road traf c, where the time constraints are reduced even further by oncoming vehicles passing less than seconds away. In this light, the following fairly vivid description of this phenomenon appears more than plausible: Conducting a car along a busy road is more akin to ying a fast military jet at 200 feet through mountainous terrain than cruising across the Atlantic in a civil airliner (Harris &
Smith, 1997, p. 345).. Implicationsfor accidents
At the same moment an automated system fails or for other reasons calls for the operator s attention, the operator must generally already have formed a good mental picture of the on-going situation. Otherwise, the inherent time limits of fast dynamic situations may contribute to a serious deterioration of the possibility for successful intervention. Nevertheless, the very presence of an automated system can detrirnentally contribute to an inhibition of the operator s ability to maintain a high level of situation awareness. According to Labiale (1997) there is paradoxically a risk that the very introduction of information systems in the driving compart-ment risks increasing the problems of selective attention and compart-mental load for the driver, thus running counter to the initial objective of increasing the comfort and safety of automobile driving.
A problem with a high level of automation is that it may reduce the operator s task to system monitoring. For in-vehicle systems, this may have serious consequences for traf c safety. Since, according to Endsley (1996) the turning of a human operator om a performer into an observer can negatively affect situation awareness. She considers that the main problem when people are acting as monitors of automated systems is that they are equently slow in detecting problems that necessitate their intervention. She adds that when problems are de-tected, additional time is also needed to determine the state of the system and to suf ciently understand what is happening in order to be able to act appropriately. This problem is called the 0ut ofthe-loop-pe1formance-problem (Endsley, 1996). System monitoring is consequently a role which humans are not well suited to (Parasuraman (1997).
Measures to reduce this problem can, however, be taken. According to Endsley (1996), one method is to determine a level of automation that minimizes the negative impact on the operator s situation awareness. Then she considers that it might be possible to keep the op-erator actively involved in the decision loop, while simultaneously the load associated with doing everything manually is reduced. Consequently, she formulates the following requirement for the design process of automated systems. At a minimum, it should include steps to ensure that the needed information regarding the present state of the automation, and the state of the monitored parameters, is always present in a clear and easily interpretable format.
Implicationsfor type of interface
Information from in vehicle systems can be transmitted to the driver in different ways. The human visual system is conceptually the perceptual system closest connected to the driving task. Accordingly, visual displays, om traditional speedometers to modern computerised in-vehicle system displays, have frequently been used to present the driver with information. Nevertheless, in critical tramc situations where a correctly perceived warning or advice from an in-vehicle system is particularly essential for traf c safety, the driver s visual system is gen-erally already heavily loaded. Alternative methods for these systems communication with the driver have therefore been an issue of great interest. Among these alternative methods, audi-tory systems are probably mo st familiar to the public. However, there are also other ways of informing the driver. For instance, an in-vehicle system can attract the driver s attention to a critical situation, or indicate that the speed is too high, by applying a counter force in the gas pedal (e.g. Janssen & Nilsson, 1992).
Srinivasan and Jovanis (1997) made a study to examine whether there were any differ-ences in workload and choice of vehicle speed depending on whether a route guidance system presents the driver with visual or auditory information. Compared to the visual information, the auditory information led to a lower level of mean subjective workload. The participants also drove faster with the auditory system, since it allowed them to look at the driving scene more often compared to the visual system. Furthermore, the auditory system was the most preferred, but in spite of this Srinivasan and Jovanis (1997) cautioned that some participants found the auditory warnings to be irritating and therefore wanted to have the option to turn them off.
However, the main reason for the introduction of automated in-vehicle systems is, as already mentioned, to increase traf c safety. Hence, it is of the utmost importance to eliminate
all imaginable reasons for drivers to turn them off. The safety aspects of in-vehicle auditory systems therefore seem enormously dependent on their ability to manage the subtle balancing act of generating messages not experienced as intrusive, while still being intrusive enough to
alert the driver s attention. However, the major advantage with speech or auditory interfaces seems to be that they do not divert the driver s Visual attention from the driving scene.
Nevertheless, there are other problems linked to auditory information processing. One problem is that auditory information is transient and therefore may impose a greater memory burden on the user (Cook, Cranmer, Finan, Sapeluk & Milton; 1997). The length of a spoken auditory message should therefore be kept as short as possible. Kimura, Marunaka, and Sugiura (1997) suggest that the length of a voice message in a navigation system should be less than 5-7 seconds to avoid information overload. A system that warns the operator in critical situations must, on the other hand, give very short messages, or perhaps only acoustic signals. If auditory messages are presented as acoustic signals, it is essential that not too many signals are presented simultaneously. More than a few signals in a given situation can lead to confu-sion and overloading of the operator s auditory channel (Sanders & McCormic, 1993). They mention, as a terrible warning, that over 60 different auditory warning signals were activated in the Three Mile Island nuclear accident.
One solution might be multimodal systems where the user s memory burden can be re-lieved if direct auditory information is supported with a visual display that shows the system s status and veri es the most recent given auditory messages. Nevertheless, even the use of multimodal systems can imply obstacles for cognitive processing.The delivery of information across different modalities can have higher attentional co st than delivery utilising a single modality (Cook et al., 1997). They suggest that one reason might be that it takes greater amounts of time to switch between modalities than it does to switch attention within modali-ties. Another problem brought up by Cook et a1. (1997) is that there is a tendency of auditory signals to pre-empt or disrupt simultaneous processing of visual information. They suggest that the reason might be that attention is initially directed by sound, or that differences in the length between auditory and visual pathways might provide afaster route for auditory information. However, they claim that whatever the reason, this interruption of processing is signi cant, and has been accepted as a possible contributory cause in accidents.
Even if there obviously are complications connected with the implementation of multi-modal systems, they may still be the best solution in many situations. However, this seems to require a thorough concern of human cognitive limitations.
Implicationsfor design
When informative systems are used, the operator is often assumed to perform some kind of tervention when the system gives a warning or advice. If the informative system also is an in-vehicle system, reactions must generally be fast and correct. Therefore, when such systems are designed, considerations regarding limitations in human reaction and decision time must be taken. However, this does not seem to be a trivial matter of simply using the results from labo-ratory studies of human reaction and decision times.
The time taken to make a simple decision under simple conditions can be as short as 200 ms (Alm, Svidén & Waern, 1997). However, they add that decision making in slightly more complex situations, such as braking when seeing the brake-lights of the car in front, can in crease the reaction time by at least 5 times, which means 1 second or more on average. The
reaction time in a surprisal event is, for example, actually o en twice as long, or even longer,
compared to the reaction time for a prepared event (Sanders & McCormic, 1993). The reac-tion time also increases if either the complexity of the stimulus or the complexity of the
neces-sary response is increased. According to Sanders and McCormic (1993) it has been shown that choice reaction time increases if the number of stimuli increases, but also if the probability of an event decreases- They consider that ifthe number of stimuli and the probability of the event are represented as bits of stimulus information,there is a linear relation between reaction time and bits of stimulus information. This relationship is called the Hick-Hyman law (Sanders & McCormic, 1993).
However, there is also another advantage with systems adapted for longer reaction times. Dingus, Jahns, Horowitz and Knipling (1998) consider that extreme reaction times are more common and realistic because they include effects of age and cognitive impairments, and thus describe more of the population. They also state that longer reaction times are advantageous because they take day to-day driver episodes of divided attention into consideration.
Reaction time is, however, only one of many necessary parameters that must be consid-ered when automated systems are being developed. This fact has been rather wittily described by Parasuraman (1997, p. 44): To the extent that a system is made less vulnerable to operator error through the introduction of automation, it is made more vulnerable to designer error.
Trust in automated systems
A realistic standpoint seems to be that there is a positive relationship between the probability that a system provides accurate information and the user s feeling of trust in the same system. That this is the case, at least for in-vehicle navigation systems, has been con rmed in two similar studies (Kantowitz, Hanowski & Kantowitz, 1997a; Kantowitz, Hanowski & Kantowitz, 1997b).. Both studies were based on a simulated navigation system (an Advanced Traveller Informatics System, ATIS), which presented the participants with three levels of navigation information: 100% accurate, 71% accurate and 44% accurate information. It was shown that even if 100% correct information yields the best driver performance and subjective opinion, which may be considered rather obvious, information that was 71 % accurate,. still re-mained acceptable and usable. However, when accuracy dropped to 43%, driver performance and opinion suffered. Kantowitz et al. (1997b) therefore concluded that future research is needed to evaluate information accuracy between 44% and 70%. Kantowitz et al. (1997b) used a convergence score to measure the degree to which the participants followed a recom-mended route. They were able to Show that the convergence score was higher when the infor-mation was accurate than when it was inaccurate.
Another important factor for trust in automated systems seems to be the relationship between self-confidence and system-confidence. Kantowitz et al. (1997b) consider that in gen-eral, when trust exceeds self con dence, operators accept automated control. Consequently, they also suggest the reverse condition; when self-con dence exceeds trust, operators use manual control. This reasoning suggests that peak acceptance of automated systems may occur in situations with reduced self con dence, for example in complicated driving situations, which can arise, for instance, when driving in unfamiliar settings, heavy traffic or bad weather condi-tions.
Implicationsfor accidents
Even if the operator s trust in an automated system is normally considered essential for suc cessful interaction with it, too much trust can apparently cause problems. Nilsson (1996) in vestigated the effects of driving with an automatic Adaptive Cruise Control system (ACC) in critical situations. When the drivers caught up with a stationary queue, there were more colli-sions among the drivers using the automatic ACC compared to the unsupported control group. The drivers with the automatic ACC also had a somewhat higher speed when they were
appro-aching the queue; they also braked later. Consequently, theyapplied the maximum braking
force closer to the queue than the control group. According to Nilsson (1996) the explanation for this behaviour was probably that they had too large expectations of the automatic ACC. Thus, when they realised that they had to intervene, it was too late.
There are further studies supporting the idea that the risks associated with too much trust in automated systems increase with the level of automation of the systems. For example, Parasuraman (1997) considers that an automated system where the operator s task is reduced to system monitoring, can lead to over-reliance on the system. In addition, if the operator s task is restricted to observing the system, this also has negative consequences for situation awareness (Endsley, 1996). This problem is also discussed by Muir (1994) who means that if operators trust the automation too much, they become complacent and fail to override auto-matic control even when the automation is faulty.
The most apparent solution to this problem is perhaps a clear and comprehensive ac count ofthe system s limitations in the accompanying user manual. Unfortunately, manuals are far from always read. Thus, apart from saving the designer om legal responsibilities, the capacity ofa good manual to avoid accidents is often very poor. If possible, the best solution is perhaps to design system interfaces transparent enough to reveal the limitations of the system.
Acceptance
The possibilities of success for automated in-vehicle surveillance systems are largely dependent on the degree to which their use will be met by acceptance among the driving population. If a system is not received with acceptance, there will apparently not be any interest among the majority of drivers in using it, or even less in paying for it. In that case, a large-scale introduc tion can only be accomplished by legislation. That would probably be unfortunate, because the main idea with these systems is to comfort, help, support and guide the driver through compli-cated or dangerous situations. In addition, it will be very dif cult to create a system for the bene t of a driver who does not accept it; there is a risk that an introduction through legisla-tion of an unaccepted system might lead drivers to experience the purpose of the system as a constraint imposed by the authorities to supervise their driving. That this actually is an existing suspicion among drivers has been shown in PRO-GEN, a project within PROMETHEUS (Program for European Tra ic with Highest E ciency and Unprecedented Safety), where people s opinions about different Road Transport Informatics (RTI) systems have been inves-tigated. According to Alm et al. (1997) one of the opinions expressed in PRO-GEN was fear of the possibility that the authorities might use RTI systems to control and monitor the individ-ual driver.
While the level of automation seems to have consequences for the operator s ability to
maintain suf cient levels of situation awareness, there also seems to be a connection between
the system s level of automation and the operator s acceptance of the system. If the system s level of automation is too high, the operator is often excluded om the decision process.
Furthermore, even a short time exclusion of the driver from the vehicle control loop, can
according to Labiale (1997) increase the risk of a reduction of the psychological acceptance of the system. One of the consistent results in PRO-GEN was actually that RTI systems that in-terfere with the drivers direct control of the car will not be approved by iture users (Alm et al., 1997). This suggests that systems with higher levels of automation would receive less ac-ceptance than informative systems. On the other hand, it cannot be excluded that the results om PRO-GEN would have been different if the participants had been given the opportunity to drive with the systems in question before answering. That this actually might be the case was indicated by Nilsson and Nabo (1996) who showed that the preference for informative ACC systems was higher before a system had been used. On the contrary, the preference for automatic ACC systems was higher after driving with an ACC system. However, the investi-gated automatic ACC system was, according to Endsley s (1997) de nition of levels of auto-mation, only implemented at level four. Therefore, it cannot be excluded that the participants would have been less positive towards the automatic system if it had been completely auto-mated at level ve.
Environmental in uence
There are also indications that the degree of familiarity with the driving environment may be important when evaluating acceptance of an automated in-vehicle system. For example, the simulated navigation system study by Kantowitz et al. (1997a) showed that drivers unfamiliar with the road network were more apt to accept advice given by a navigation system compared to drivers in familiar surroundings. The main reason they give is that drivers have greater self-con dence in familiar settings. A similar study by Bonsall and Perry (1991) also showed that the drivers acceptance of the simulated navigation system generally decreased as their famili-arity with the road network increased. They considered that there may be a credibility problem; because many drivers often believe that their own knowledge of the road network is superior to that of the navigation system in familiar road networks. Ponsall and Perry also admitted that these drivers to some extent may be right; because the navigation system may not know about potential short cuts through backstreets, and if the system does not update its informa-tion fast enough, it may provide guidance based on the traf c situainforma-tion several minutes ago. In line with this reasoning, the study by Kantowitz et al. (1997b) showed that inaccurate traffic information was more harmful to trust in the system when the participants were navigating in a familiar setting. Consequently, they concluded that it might be easiest to achieve acceptance of navigation systems in rental vehicles, which are often used in unfamiliar surroundings.
Individual user characteristics
Automated systems have been used and accepted in aviation for a long time. However, com-pared to aviation there is another complication concerning acceptance of in-vehicle systems. These systems will have to accommodate all categories of users, diifering in a number of char-acteristics, such as age, experience and technical knowledge, compared to a pilot population, which according to Harris and Smith (1997) is comparatively homogeneous as a result of
selection and training. Therefore, they point out that it will be much more dif cult to maintain a user-centred design strategy in the implementation of in-vehicle systems. Such a strategy may, however, be important. For example, Hancock, Parasuraman and Byrne (1996), consider that the goal of an ef cient in-vehicle system will be met only if the design of the system ts the needs of the average driver. However, they add that the design must also be comple-mented to t individual and group differences. In other words, separate design solutions for different subgroups in the driver population may be necessary.
Age seems to be the group factor most predictive of accidents. Both the youngest and the oldest drivers are proportionally involved in many more accidents per million vehicle miles travelled than middle-aged drivers (Sanders & McCormic, 1993). The elderly are also a large and increasing part of the driving population and are therefore an important factor for in-vehi-cle system design (Hancock et al., 1996). There is an age related increase in disruption of working memory by a shift of attention during the time that material is being held there (Sanders and McCormic, 1993). Among the general cognitive decreases associated with age, this may be the mo st important factor for driving. This suggests that devices supporting the overview of the surrounding traffic at intersections may be especially valuable for the elderly. At the other end of the age-axis are the novice drivers, who according to Dingus et a1. (1998) have tutorial needs that differ from those of the experienced drivers.
Apart om the integrity problems connected with diagnosing the individual driver, indi-vidual design solutions within each cohort would be possible. The settings of the automated systems could then be adapted to the drivers individual cognitive abilities; such as short-term memory, retention and spatial capacity. The problems pertaining to diagnosing the drivers cognitive capacities could be avoided ifthe system allowed the driver to choose his or her indi-vidual settings. The possibility for the driver to choose an indiindi-vidualised setting of the system must, however, be considered with caution. If elderly drivers, for example, mistakenly drive with a warning timing tuned to drivers with a faster reaction time, then the system may instead increase the risks ifthey rely on the system (Dingus et al., 1998).
What is important is, however, that designers of automated systems have nally started to think about the problems of individual differences. The fact that a Collision Avoidance sys-tem (CAS) may have to be tailored to the individual driver has been rather aptly expressed by Tijerina (1995, p. 4): Finally, human factors engineering has learned the fallacy of the aver-age man , that is, trying to design a system to t the 50th percentile person .
Driver attitudes to systems
The positivity or negativity of drivers general opinions about computers and in particular in-formative systems, can be an issue with major effects on their acceptance of the advice given by in vehicle systems. Lee (1997) discusses driver attitudes towards navigation systems and re-marks that driver attitudes regarding the capabilities of the computer might lead the driver to reject computer generated trip plans even when they are appropriate.
Frequency ofimplementation
In addition, there is another important dimension of user acceptance, in particular for naviga-tion systems. The reason is that a naviganaviga-tion system must receive informanaviga-tion from a great number of vehicles in order to effectively detect traf c congestion. According to Wochinger and Boehm Davis (1997) the accuracy of the traf c information conveyed by a navigation
system is therefore dependent on the number of vehicles equipped with such systems. Conse-quently, ifa system is not accepted, an indirect consequence may be that it provides less usable information.
Frequency of implementation also seems to have consequences for acceptance of other types of in vehicle systems. This was con rmed in a study by Turrentine, Sperling and Hungerford (1991) where most drivers considered that such a technology as ACC might im-prove tra ic ow, but to be effective, would have to be on all cars, and should therefore be standard rather than optional. In this study, there was even a rather humorous suggestion that what was really needed was a device to control the speed of the driver in ont. Therefore, the reasoning about legislation is not uncomplicated.
Hypotheses
As already mentioned, the reason for the discussion about mental models and situation aware-ness was the belief that these concepts are of fundamental importance for users possibilities to develop higher levels of acceptance in the interaction with automated systems. The purpose of this study was, however, to investigate the relationship between drivers acceptance and trust in automated systems and their actual driving performance. To investigate this relationship, two driving simulator studies with automated systems of the Adapted Cruise Control (ACC) type were examined.
Acceptance ofthe ACC
The assumption was that drivers with higher acceptance of an ACC system are more inclined to adapt their driving to the ACC system compared to drivers with lower acceptance of the system. It was also presumed that drivers with lower acceptance of an ACC system have a more aggressive driving style. If this is the case, it can be believed that drivers with lower acceptance of ACC systems drive faster, have higher variability in driving speed, keep a shorter time headway to the car ahead, have a higher variability in time headway to the car ahead and brake harder (The time headway to the vehicle ahead is a measure of the time in seconds taken to drive the distance to the vehicle ahead at the current speed).
Consequently, the following hypotheses were formulated:
- Lower acceptance of an ACC is associated with higher speed.
0 Lower acceptance of an ACC is associated with higher variability in driving speed. 0 Lower acceptance of an ACC is associated with shorter time headway to the car ahead. 0 Lower acceptance of an ACC is associated with higher variability in the time headway to
the car ahead.
Notice that aggressive driving style is not an established term for the driving behaviour re-ected by higher speed, higher variability in speed, shorter time headway and higher variability in time headway. Therefore, it should be observed that the term aggressive driving style in this study bears no reference to violence.
Mental demands. It was also of interest to investigate the association between the acceptance of the ACC and the experienced mental demands of the driving task. The ACC systems are
constructed to support the driver; therefore, it can be assumed that acceptance of ACC sys-tems increases when mental demands increase. Consequently, the following hypothesis was formulated:
0 Higher acceptance of the ACC is associated with higher mental demands. Trust in the ACC
The risk that too much trust in automated systems may decrease the operator s ability to inter-vene in critical situations has been discussed (p. 10). For example, in the study of critical driv-ing situations by Nilsson (1996), four out of ten participants drivdriv-ing with the automatic ACC crashed into the rear of the car ahead when they caught up with a stationary queue. Nilsson believed that the explanation might be too much trust in the ACC system. It was also shown that the participants driving with the automatic ACC started to brake later than the control group who performed the same driving task without the support of an ACC system. It can therefore be believed that higher trust in an automatic ACC is associated with later reaction when intervention is necessary. It can also be believed that later initiated braking makes it necessary to brake harder. Consequently, the following hypotheses between trust in ACC sys-tems and driving performance were formulated:
- In critical situations, higher trust in an ACC is associated with later initiated braking.
o In critical situations, higher trust in an ACC is associated with harder braking.
Method
In order to investigate the formulated hypotheses, data from two previous studies of Adaptive Cruise Control (ACC) systems were further analysed. The study here entitled Study of normal driving was performed by Nilsson and Nabo (1996) and was entitled Evaluation ofapplication 3: Intelligent cruise control simulator experiment. The study here entitled Study of critical driving was performed by Nilsson (1996) and was entitled Safely e ects of adaptive cruise controls in critical tra ic situations. Both these studies were performed in the driving simula-tor at the VTI (Swedish National Road and Transport Research Institute).
Therefore, this chapter is introduced by a short description of the driving simulator. This is followed by a brief description of these previous driving studies. Finally, an account is given of why and how the driving situations and variables that have been analysed in this study were chosen.
Descriptions of the driving studies
These descriptions are rather brief and they mainly describe the driving situations and variables relevant for this study.
Driving simulator
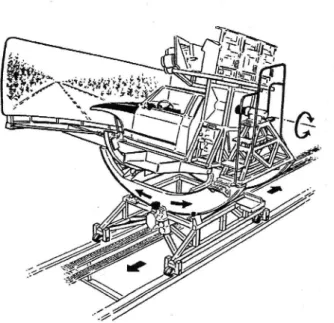
The VTI driving simulator has a moving base system that simulates accelerations in various directions through roll, pitch, rotations and linear lateral motions (Figure l).
w
' Rikki:
ill'1 I1""='~'
5::-Jilih :Ei 5'\ ll .
Figure l. The VTI driving simulator with the cover removed showing the moving base system s three degrees of freedom (from Nilsson, 1989).
For a realistic simulation, a visual system provides video pictures that are updated every 20 ms. The pictures are presented 2.5 metres in ont of the driver on a screen that covers 120° of the eld of vision. A road sight distance of up to 3000 metres can be simulated. Different types of sight conditions can be simulated, for example fog and darkness. The sound system consists of large bass range speakers for in asound generation and treble and midrange speak-ers for noise generation. There is also a vibration system simulating the normal vibrations from the contact ofthe tyres with the road surface (Nilsson, 1989).
The car body used in both studies was an ordinary Saab 9000 with automatic gearbox. Study ofnormal driving
Purpose. The main purpose of this study was to investigate the effects of different levels of automation on driver behaviour, workload andattitudes. For a detailed description see Nilsson and Nabo (1996).
Equipment. The driving task was performed in the VTI driving simulator (Figure 1). An ACC prototype from Saab was used. The range for its vehicle detection was 100 metres and road signs were read 50 metres before passing them. The ACC system operated in two different modes:
0 Informative ACC. The system only presented information and warnings. All decision making and manoeuvring was left to the driver.
0 Automatic ACC. The system automatically controlled speed and headway through the car s brake and throttle systems.
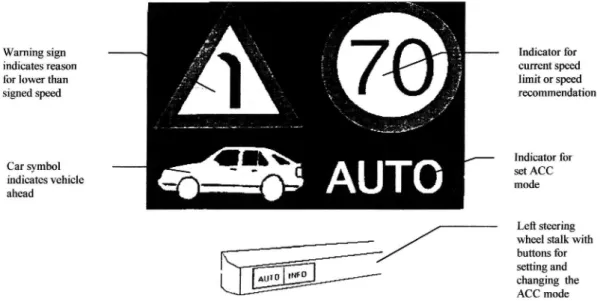
The visual display is shown in Figure 2. The ACC mode could be set by switches on the
Warning sign Indicator for
indicates reason current speed
for lower than limit or speed
signed speed recommendation
Indicator for
9 ? Symbol _ set ACC
indicates vehicle mode
ahead
Left steering wheel stalk with buttons for setting and changing the ACC mode
Figure 2. The ACC display and the left steering wheel stalk (adapted from Nilsson and Nabo, 1996)
left steering wheel stalk. If the speed limit was exceeded in the informative mode, the speed limit sign ickered and an acoustic signal was given. If the ACC recommended a speed that was lower than the signed speed limit, the reason was shown by the road sign symbol. If the distance to the car ahead was too short, the car symbol ickered together with another acous-tic signal. The warnings did not occur in the automaacous-tic mode, but the same symbols were shown to inform the driver of the relevant parameters for distance and speed control. If the driver braked or pressed the accelerator in the automatic mode, the ACC was transferred to the informative mode. The automatic mode could then be reengaged by a button on the left steering wheel stalk.
In Nilsson and Nabo s (1996) report, the investigated cruise control system was denoted Intelligent Cruise Control (ICC). In this report, it is consistently denoted Adaptive Cruise Con-trol (ACC). The reason is that the other cited report (Nilsson, 1996), from which data also have been collected and analysed, uses the term ACC. In addition, the systems investigated in these two reports are in principle the same. Therefore, to avoid unnecessary confusion, it was decided to use consistent naming. The reason for choosing ACC is that ICC is an older deno-tation nowadays replaced.
Design. Totally 60 people participated in the driving study. All were experienced drivers, 30 men and 30 women, between 23 and 57 years old. Twenty participants drove with the infor-mative ACC, 20 with the automatic ACC and the remaining 20 provided a control group by driving without any ACC. To investigate the impact of the workload for the different systems, each group was furthermore split into one group that used a telephone during driving and into another group that drove without using the telephone (Figure 3).
ACC mode
Auto Info Control
Without telephone 11 = 10 n = 10 n = 10
With telephone n = 10 n = 10 n = 10
Figure 3. Experimental design for test of normal driving
Driving task. The tra ic environment was an 80 km long highway with one lane in each di-rection. The signed speed limit was 90 km/h. Apart 'om slower tra ic in the same direction that occurred in the catching up situations, oncoming traf c was also simulated. The simulated sight condition was daylight and good Visibility. The following driving tasks were simulated: 0 Speed limited sections. The driving route contained four road sections, speed limited to 70
km/h. When the ACC was used, the system detected the 70-signs, and depending on set ACC mode recommended or reduced the speed to 70 km/h.
0 Curves. There were eight curves, each with alength of 200 metres. Four of the curves had a radius of 300 metres and four had a radius of 600 metres. A road sign narrow ben
preceded the 300-metre curves. When the ACC was used, the system detected the road sign, and depending on set ACC mode recommended or reduced the speed to 70 km/h. Catching up. On sixteen occasions, the participants caught up with vehicles driving slower. The speed of the preceding vehicles was half the participant s speed until the distance between them was 100 metres. Then, the speed of the preceding vehicles changed to 18 km/h slower than the participants speed until the distance between them was 75 metres. This was called the catching up point. The preceding vehicles then braked smoothly (lm/sz) until their speed was 80 km/h. After that, the speed of the preceding vehicles varied randomly between 80 and 88 km/h. If the participants had not overtaken the preceding ve-hicles after 75 seconds, these veve-hicles drove out to the right and disappeared.
Pure speed keeping. After driving, the participants were asked about how they had experi-enced the situations that had been characterized by pure speed keeping. Pure speed keeping was, however, not one of the originally designed driving situations. That is, the mean speed was not speci cally recorded for this driving situation.
The groups that used the telephone received fourteen calls during the driving session. At each call, the participants were given a working memory test that included both decision mak-ing and memorismak-ing. Each call was received approximately 30 seconds before a speci c drivmak-ing situation occurred. The telephone rang before eight of the sixteen catching up situations. The participants using the telephone were thus engaged with a working memory test on half of the occasions they caught up with a slower vehicle.
Performance data.
Speed. Driving speed in km/h was collected at a rate of 2 Hz. To obtain a measure of the variability of the speed, the standard deviation (sd) of the speed was calculated individually for each driver. Minimum and maximum speeds were also registered.
Time headway. In each catching up situation, the time headway to the vehicle ahead was measured in seconds. Measuring started at the catching up point. To obtain a measure of the variability of the time headway, the standard deviation (sd) of the time headway was
calculated individually for each driver. Minimum and maximum time headways werealso
recorded. Subjective data.
Attitudes. The participants answered questionnaires about their attitudes to automatic and informative systems. In order to estimate possible changes in attitudes during driving, the participants were given questionnaires about their attitudes both before and after driving. After driving, the participants were explicitly asked about their attitudes to the ACC system that they had used for each speci c type of driving situation. The answers to the attitude questions were given on a rating scale ranging from 1 to 7. A rating of 7 generally indi-cated a very positive attitude, whereas a rating of 1 generally indiindi-cated a very negative
attitude.
Workload. After the driving task was completed, the participants experienced level of workload during driving was measured with the NASA-TLX rating scale. The NASA-TLX rating scale measures six workload factors: mental demands, physical demands, time
sure, performance, effort and ustration. The answers are given on a continuous scale,
ranging from O 100 (Hart & Staveland, 1988). Study ofcritical driving
Purpose. The main purpose of the study was to investigate how ACC use affects driver be-haviour, acceptance and workload when drivers are exposed to critical traf c situations. Investigating how ACC use a ects traf c safety was also considered to be of interest. For a detailed description see Nilsson (1996).
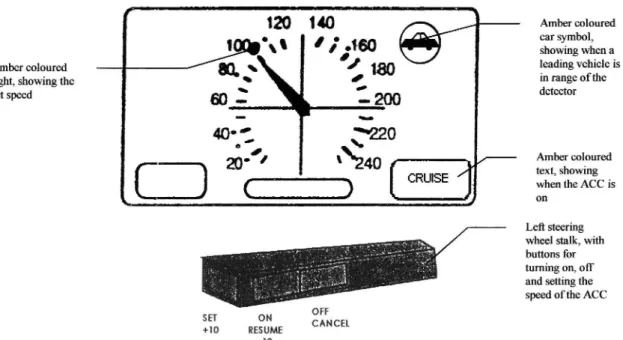
Equipment. A prototype of an ACC system that automatically controlled the driving speed and the distance to preceding vehicles was used. The detection range of the simulated distance sen sor was 3 - 130 metres. To avoid erroneous intervention when the ACC detected road signs along the road, stationary objects were ltered away. That is, the ACC did not react to station-ary vehicles. The ACC operated within the speed interval 30 - 130 km/h. The ACC interface was integrated with the speedometer (Figure 4). The ACC could be turned on and oh by switches on the left steering wheel stalk. These switches were also used to change the set speed.
Amber coloured car symbol, showing when a
Amber coloured leading vehicle is
light, showing the in range ofthe
set Speed detector
Amber coloured text, showing when the ACC is on
Le steering wheel stalk, with buttons for turning on, off and setting the
_ speed ofthe ACC
OFF SET ON
+10 RESUME CANCEL ~10
Figure 4. The ACC interface and the left steering wheel stalk (adapted from unpublished con-ference material relating to Nilsson, 1996)
Design. Totally 20 people participated in the driving study. All were experienced drivers, ten men and ten women, between 26 and 46 years old. Ten of the participants formed the experi-mental group, and drove with the ACC system. The remaining ten participants formed the control group, and drove without any ACC system.
Driving task. The tra ic environment was a 100 km long two lane motorway. The signed speed limit was 110 km/h. Faster cars that overtook the participants were simulated, as well as slower cars that the participants overtook. The visibility was approximately 400 metres. Each driver was exposed to three critical tra ic situations specially designed to investigate the limi-tations of the studied ACC. Accordingly, the participants in the control group, who drove an ordinary car without the ACC, were exposed to exactly the same traf c situations.
Car pulling out. The participants caught up with two leading cars in a row. In order to cre-ate an overtaking situation, the speeds of these cars were controlled in relation to the parti-cipants speed. When the partiparti-cipants had initiated the overtaking, and the distance to the leading car in the row was equal to their own speed minus the speed of the leading car s speed (or max 22 m/s) multiplied by 3.5 seconds, this car activated its left direction indi-cator and pulled out to overtake a car in front of it that was hidden from the participants. The ACC detected the overtaking car and braked with its maximum capacity. This was not su cient, so the ACC used the acoustic warning signal to inform the participants that manual braking was necessary to avoid an accident.
Braking hard. The participants caught up with a leading car. At the same time, they were overtaken by another car which was interactively controlled to lock them in. When the distance to any of these cars was less than 75 metres, these cars braked at 8 m/s2 until their speed had decreased to 43.2 km/h. When the participants approached a leading car, it was detected by the ACC, which showed the car symbol on the dashboard. When the leading car braked, the ACC braked with its maximum capacity. This was insuf cient to avoid a collision. Therefore, the ACC gave an acoustic warning signal to inform the driver that manual braking was necessary.
Stationary queue. A tra c congestion was simulated, where the participants caught up with a stationary queue of vehicles in both lanes in front of them. The ACC did not react to stationary objects. Thus, the system did not brake, nor did it warn the drivers. Therefore, to avoid an accident, the participants had to detect the stationary queue by themselves, and accordingly also take over control. Four out of ten of the participants driving with the automatic ACC crashed into the stationary queue. In the control group driving without any ACC, only one out ofthe ten participants crashed.
Performance data.
Speed. The driving speed in km/h was measured at three instances for each driving situa-tion: a) when the time headway to the vehicle ahead was shortest, b) when the time to col-lision was shortest, and c) when maximum braking force was applied.
Time headway. The minimum time headway to the car ahead was measured in each specific driving condition. When a participant crashed into the rear of the car ahead, this was indi-cated by setting the minimum time headway to an arbitrary value. The time headway when braking was initiated was also measured for each driving situation.
Maximum braking force. For each speci c driving situation, the maximum applied braking force was measured in Newton (N).
Subjective data.
0 Attitudes. All attitude questions were given after driving. The questions did not concern the speci c driving situations. Instead, the participants were asked about their experiences for the complete distance. The rating scale for the attitude questions (ranging from 1 to 7) was the same as in the study ofnormal driving.
- Workload. The NASA-TLX questionnaire was identical to that given in the study of nor-mal driving (p. 18, 19).
Selection of driving situations and variables
This is a description of how the driving situations and the variables that have been used in this study have been chosen.
Study ofnormal driving
Driving situations. The mean driving speed in the two curve situations was highly correlated with the driving speed for the total distance. It was therefore considered to be re ected by the measure of the mean driving speed for the complete distance, and was consequently excluded from the analysis. The speed limited driving sections were also omitted, mainly because of problems with the automatic ACC during this part of the driving study. The speed had not been automatically set to 70 km/h before a distance of about 70 m after the 70-sign was passed. The remaining driving situations chosen for the analysis were:
0 Pure speed keeping. Pure speed keeping was considered of interest because this is the most typical driving situation for the traditional speed keepers.
o Catching up. The situations where the participants caught up with slower vehicles were of special interest. That is because these are situations where the ACC system s extended feature of adapting its behaviour according to preceding vehicles comes into use.
Performance variables.
0 Mean speed. The mean speed was not separately recorded, neither for pure speed keeping nor for the catching up situation. Therefore, the mean speed for the complete distance was used in the analysis.
0 Standard deviation ofthe speed for the complete distance. A variation in speed may re ect an inability of adaptation to the traf c rhythm. Another reason for including the standard deviation of the speed in the analysis was that the use of an automatic ACC system rea sonably leads to smoother driving with lower variability in driving speed. That is, when drivers intervene and take over command, the result may be higher variability in driving speed.
0 Minimum time headway. An insuf cient following distance to the car ahead is the main cause of rear end crashes. Therefore, the minimum time headway was considered an im-portant measure of traf c safety. Consequently, it was also believed to be a good measure of the ability to adapt driving to the other traf c in the catching up situations.
0 Standard deviation ofthe time headway. The reason for including the standard deviation of the time headway is in principle the same as for the standard deviation of the speed.
The variables measuring the minimum time headway and the standard deviation of the time headway are, of course, only relevant for the catching up situations.
Subjective variables.
0 Acceptance of the ACC system. After driving, the participants were among other things asked about their acceptance of the ACC system in pure speed keeping and catching up. There was a small difference in the formulation of the question investigating the partici-pants acceptance of the system used. The participartici-pants driving with the automatic ACC system were asked how acceptable they experienced the behaviour of the system to be in each situation. The participants driving with the informative ACC system were asked how valuable they experienced the ACC system to be in each situation. This difference was, however, considered small. The answers given by the drivers with the informative ACC were therefore also interpreted as their rated acceptance of the ACC system.
0 Mental demands. This was believed to be the individual factor om the NASA-TLX rating scale of workload that has the greatest in uence on driving and which is most sensitive to the increased workload of the telephone task.
Use ofcellular telephone. The use of cellular telephones is increasing. The use of automated in-vehicle systems will probably also increase. Therefore, it is of interest to investigate how the use of a telephone affects the driver s interaction with an in-vehicle system.
The very use of the cellular telephone reasonably increased the participants mental workload by imposing a second mental task during driving. Driving in real traf c with an ACC system is not an isolated task. Instead, drivers workload can be increased by many other simultaneous tasks, such as tuning the radio, looking at the scenery or talking to passengers. The workload can also be increased if other in-vehicle systems are implemented. The way in which an imposed higher workload affects the driver s interaction with an automated system is therefore of general interest, for both the development and the integration of such systems. Logarithmic transformation. Normally distributed variables are an underlying assumption for the Pearson correlation coef cient; and standard deviations are not normally distributed. Therefore, standard deviations are generally logarithmically transformed before they are used as variables in correlation analyses. If some values are very small or equal to zero, a constant with the value of 1 is usually added before the transformation (Kirk, 1968).
Consequently, all standard deviations in this study were added with l and logarithmically transformed with the tenth logarithm as base (lg[sd + 1]).
Excludedparticipant. Due to certain problems with the interpretation of the documentation of one of the participants results, this participant was excluded from the analyses in this study. This participant belonged to the group that used the informative ACC system together with the telephone.
Excluded control group. The participants who belonged to the control group had not used any ACC system. According to the purpose of the present study, to investigate the association
between the participants acceptance of the ACC and their driving performance, the control group was excluded from the analysis.
Study ofcritical driving
Driving situations. Each of the described driving situations provided different time intervals before intervention was necessary. There may be reason to believe that decision time can affect the way in which trust, acceptance and driving in uence each other. Therefore, all three driving situations were chosen:
0 Car pulling out. The course of the events was very fast. There was no time for conscious deliberation. The car that pulled out in ont of the participants was supposed to be threat-ening enough to trigger braking as an overlearned re ex action.
0 Braking hard. There was time for very short conscious deliberation before braking had to be initiated.
- Stationary queue. There was rather much time for conscious deliberation before braking
had to be initiated.
Performance variables. The participants mean speed had not been measured. Instead, the participants speed was recorded when their maximum braking force was applied, when their time headway was shortest, and when their time to collision was shortest. These measures were not considered to mirror the participants general driving speed, but could as well be the result of intervention that was too late or individual differences in driving style. Consequently, the relationship between acceptance of the ACC and speed was not investigated. The following three variables that were used in the analysis, are all supposed to re ect vigilance and reaction time, which in turn might affect, or be a ected by, acceptance and trust in the ACC:
0 Minimum time headway. Notice that the minimum time headway in this study was recorded in critical traf c situations characterized by braking. That means that a short minimum time headway was probably the consequence if intervention was too late. Minimum time head-way could not, because of the meaningless value for the participants who crashed, be used for the correlation analysis ofthe stationary queue.
Minimum time headway when braking was initiated. 0 Maximum braking force.
Subjective variables. Note that the participants in this study, in contrast to the participants in the study of normal driving, were not asked about their subjective opinions in each speci c driving situation, but instead about their subjective opinions of the complete distance. The fol-lowing subjective variables were used in the analyses:
0 Acceptance. The participants rated acceptance of the automatic ACC for the complete distance.
Trust. The participants rated trust in the automatic ACC for the complete distance. Mental demands (see study ofnormal driving, p. 22).
Excluded control group. The control group was excluded om the analyses. The reason was the same as for the study of normal driving (see p. 22, 23).
Results and discussion
The signi cance level 5 % was chosen in this study. The group sizes inthis study were, how-ever, rather small. Consequently, the power of the analyses was also low. That is, it is only the rather high correlations that are signi cant. However, the size of a correlation does not gener-ally change, when the group size changes. That is, many of the non-signi cant correlations would probably have been signi cant if only the group sizes had been larger. Therefore, the possible meanings of some of the non-signi cant correlations have also been discussed. The interpretation that even non signi cant correlations may indicate a certain tendency has mainly been made when many of these correlations are pointing in the same direction. As a guiding principle, only correlations above .30 have been considered high enough to be of interest. The
interpretations of the non signi cant correlations have, however, because of the increased risk
that they might have occurred by chance, been treated with the greatest caution. If, for exam-ple, the values of one variable have been very homogeneous, these correlations have been de-noted as more uncertain and left without consideration.
Note that it is the transformed values of the standard deviations that are shown on the y-axis in the graphs. If the size of the original standard deviations is of interest, the following
formula retransforms them to their original value: 10 (transformed Standard de ation) 1.
Acceptance of the ACC Association with driving speed
The hypothesis was that lower acceptance of an ACC is associated with higher driving speed. Negative correlations between rated acceptance ofthe ACC and driving speed thus support the hypothesis.
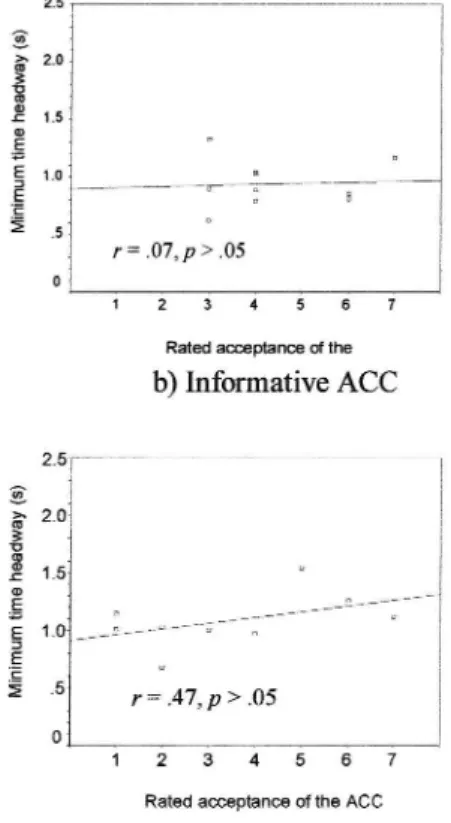
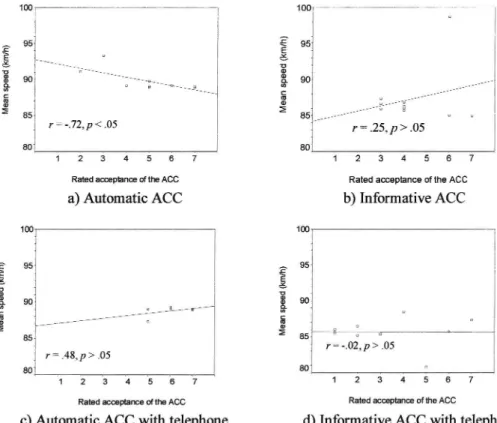
Study ofnormal driving in pure speed keeping. There was a non-signi cant low and negative correlation between the rated acceptance of the used ACC in pure speed keeping and the measured mean speed for the complete distance for the automatic ACC with the telephone (Figure 5 c).
For the informative ACC, the correlations were low and negative both when the tele-phone was used (Figure 5 b) and when it was not used (Figure 5 d). The nding that the corre-lations were negative is in line with the formulated hypothesis. This interpretation must,
how-ever, be treated with caution, because the correlations were not signi cant, which means that
the probability that they occurred by chance is greater than 5 %.
For driving with the automatic ACC without the telephone, there was practically no cor-relation at all (Figure 5 a). The graph shows that the reason for the lack of corcor-relation between the participants acceptance of the automatic ACC and speed might have been their very high and homogeneous ratings of acceptance for the ACC in this driving condition. The rated acceptance was also high and homogeneous for driving with the automatic ACC with the tele phone. This means that the low and negative correlation for this driving condition was more uncertain (Figure 5 c). The homogeneity of the participants driving speed was also high in this


![Figure 7. Study of normal driving in pure speed keeping. Correlations between rated accep- accep-tance ofthe ACC used and the transformed standard deviation (1g[sd + 1]) ofthe speed (km/h)](https://thumb-eu.123doks.com/thumbv2/5dokorg/4901447.134658/35.892.196.670.158.577/figure-study-driving-keeping-correlations-transformed-standard-deviation.webp)
![Figure 8. Study of normal driving in catching up. Correlations between rated acceptance of the ACC used and the transformed standard deviation (lg[sd + 1]) of the speed (km/h) for the complete distance for driving with the automatic and the informative ACC](https://thumb-eu.123doks.com/thumbv2/5dokorg/4901447.134658/36.892.180.398.232.608/catching-correlations-acceptance-transformed-standard-deviation-automatic-informative.webp)