PAPER WITHIN Production Systems AUTHOR: Mathilda Jonsson Egeman JÖNKÖPING May 2019
Adapting the lead time
tree model to include
immaterial activities
Extending the lead time tree model to enable
mapping, efficiency evaluation and waste
identification in order fulfillment processes
This exam work has been carried out at the School of Engineering in Jönköping in the subject area Production system with a specialization in production development and management. The work is a part of the Master of Science program. The author takes full responsibility for opinions, conclusions and findings presented.
Examiner: Mahmood Reza Khabbazi Supervisor: Jenny Bäckstrand
Scope: 30 credits (second cycle)
Abstract
Much research regarding efficiency in manufacturing industry has historically been focused on the material activities of the shop floor. However, companies that merely focus on material activities when trying to improve lead times, risk losing potential for improvements within immaterial activities such as planning, engineering, design, and purchasing, which often constitute the most time consuming parts of the order fulfillment processes. Engineer to order (ETO) products are particularly time consuming regarding their immaterial activities, and the customer is waiting for the products from the very beginning of the order fulfillment process. Shortening the lead time to customer for ETO products is therefore important for customer satisfaction. The aim of this study is to adapt an existing lead time tree model currently focused on material activities to also include immaterial activities, enabling a full visualization of all activities contained in order fulfillment processes. The lead time tree model would thereby be able to use as a tool when working on shortening the lead time to customer. A further aim of the study is to investigate how the adapted lead time tree model can be used in further areas as well, in addition to visualizing immaterial activities.
The adaption of the lead time tree model has been based on the original literary source of the lead time tree model. The original lead time tree model has been analyzed towards theoretical data from a literature study, and towards empirical data about immater ia l activities in order fulfillment processes for ETO products, from the case company Kongsberg Maritime Sweden AB (previously Rolls-Royce AB). The result of this has been an adapted lead time tree model that can visualize immaterial activities.
Several adaptions of the original lead time tree model have been made for it to be able to visualize immaterial activities, while still keeping the basics of the original model. The adapted lead time tree model comprises information that is normally kept separated and that is important when planning and improving a process. Additional informat io n that is needed for each specific case can also easily be included in the lead time tree. The adapted lead time tree model has proven to have additional areas of use within project planning, improvement work regarding lead time reduction and root-cause analysis, and as a boundary object for communication with both internal and external actors.
The adapted lead time tree model is presumably able to map and visualize immater ia l activities in other fields of business as well, other than manufacturing, as the nature of immaterial activities most likely remains the same across business environments. Keywords
Administrative processes, Boundary object, Critical path, Engineer to order, Information flow mapping, Process mapping, Time-phased product structure
Abbreviations
ii
Abbreviations
ATO ... Assemble to order CODP ... Customer order decoupling point CTO... Configure to order DDP... Delivery duty paid ED ...Engineering dimension ETO ... Engineer to order ETS... Engineer to stock EXW...Ex works KPI ...Key performance indicator MTO ... Make to order MTS ... Make to stock PD...Production dimension
Contents
1
Introduction ... 1
1.1 BACKGROUND ... 1
1.2 PROBLEM DESCRIPTION ... 1
1.3 AIM AND RESEARCH QUESTIONS... 2
1.4 SCOPE... 3
1.5 OUTLINE... 3
2
Theoretical background ... 5
2.1 CONTEXT FOR IMMATERIAL ACTIVITIES AND THEIR LEAD TIMES WITHIN MANUFACTURING INDUSTRY ... 5
2.1.1 Engineer to order... 5
2.1.2 Order fulfillment process ... 7
2.2 THE ORIGINAL LEAD TIME TREE MODEL... 8
2.2.1 Creating a lead time tree ... 8
2.2.2 Using the original lead time tree model for analysis ... 12
2.2.3 Using the original lead time tree model as a boundary object for communication... 13
2.3 CONCEPTS USED TO REGARD IMMATERIAL ACTIVITIES ... 13
2.3.1 Cross-functional flow chart... 14
3
Method and implementation... 15
3.1 OBJECTIVES OF RESEARCH AND REASONING STYLE ... 15
3.2 RESEARCH PROCESS ... 15
3.3 DATA COLLECTION ... 16
3.3.1 Literature study ... 16
3.3.2 Empirical case study ... 16
3.4 ANALYSIS OF DATA ... 17
3.5 RESEARCH QUALITY ... 18
4
Findings and analysis ... 19
4.1 FINDINGS FROM THE EMPIRICAL CASE STUDY ... 19
4.2 ADAPTING THE LEAD TIME TREE MODEL TO INCLUDE IMMATERIAL ACTIVITIES 19 4.2.1 Process mapping ... 20
4.2.2 Lead time table... 21
4.2.3 Lead time tree... 24
4.3 POTENTIAL WITH THE ADAPTED LEAD TIME TREE MODEL ... 26
4.4 AREAS OF USE FOR THE ADAPTED LEAD TIME TREE MODEL ... 26
4.4.1 Using the adapted lead time tree model for project planning ... 26
4.4.2 Using the adapted lead time tree model for improvement work... 27
4.4.3 Using the adapted lead time tree model as a boundary object for communication... 28
5
Discussion and conclusions ... 30
5.1 DISCUSSION OF METHOD ... 30
Contents iv 5.3 FURTHER RESEARCH... 31 5.4 CONCLUSIONS ... 31
6
References ... 33
Tables
Table 2.1 An example of a bill-of- material, based on Bäckstrand (2012)... 10Table 2.2 An example of a lead time table, based on Bäckstrand (2012) ... 10
Table 2.3 An example of a supply lead time table, based on Bäckstrand (2012) ... 11
Table 2.4 An example of a supply lead time compilation table, based on Bäckstrand (2012) ... 11
Table 4.1 Lead time table for Order Fulfillment Process X ... 23
Table 4.2 Cumulative lead time compilation table for Order Fulfillment Process X .. 24
Figures
Figure 2.1 The relationship between ETO and its CODP, based on Cannas, Pero, Rossi and Gosling (2018)... 6Figure 2.2 The relationship between ETO and its two-dimensional CODP, based on Rudberg and Wikner (2004) ... 7
Figure 2.3 An example of a product structure, based on Bäckstrand (2012)... 9
Figure 2.4 An example of a lead time tree, based on Bäckstrand (2012) ... 12
Figure 2.5 An example of a cross- functional flow chart ... 14
Figure 3.1 Data analysis used for this study ... 18
Figure 4.1 Cross- functional flow chart for Order Fulfillment Process X ... 20
1
Introduction
The introductory chapter presents the background for the research and narrows down to a problem description. The aim of the study is then stated, as well as the research questions developed to fulfill the aim. To conclude the chapter, the scope of the research is stated, and the outline for the thesis is presented.
1.1 Background
Much research regarding efficiency in manufacturing industry has historically, from Taylor’s Scientific Management in 1911 to Liker’s Lean Production in 2004 and onwards, been focused on production of tangible products and the physical activities on the shop floor, hereafter referred to as material activities. Efficiency in production is important for the satisfaction of the customer. However, when the products in question are customized, the order fulfillment process time that is spent on actual production is often a smaller part of the whole process time (Wikner & Rudberg, 2005). In customized production, non-material activities such as planning, engineering, design, and purchasing, hereafter referred to as immaterial activities, make up most of the order fulfillment process time. An order fulfillment process is defined by APICS (2017) as “the chain of events from the moment the customer places the order to the moment the order is fulfilled”. For collaborative customization, when manufacturing companies and their customers jointly agree and produce a customer specific product (Yalcin, 2009), also called engineer to order (ETO), the customer is waiting for the product from the very beginning of the whole order fulfillment process (Cannas, Pero, Rossi & Gosling, 2018; Rudberg & Wikner, 2004). Shortening the lead time to customer for ETO products is therefore important for customer satisfaction.
Feedback following a doctoral dissertation presented by Bäckstrand in 2012, on how to work with supplier relations in operations management, showed much focus on a specific tool included in the study. This tool, a lead time tree model included in the process to facilitate internal communication and used for visualization of supply chains, helped participants understand the true problems of their supply chain. It highlighted that most of their problems lied in internal processes and not merely in relations with suppliers, as they thought from the beginning. By working on improving internal processes first, before moving on to external processes, the companies saw immed iate improvements.
The lead time tree model is an operations management tool which defines and illustrates the process of producing tangible products by presenting the bill-of-material in a lead time-phased product structure, forming a visualization of the supply lead time. By using the tool, it is possible to see how the individual lead times for each component of the product are correlated and summed up into a total supply lead time, thereby being able to use it as a tool when working on project planning, and on shortening the supply lead time.
1.2 Problem description
The original lead time tree model enables keeping track of production lead time and is a useful tool for time planning of standardized products. However, the original lead
Introduction
2
time tree model does currently not cover lead times of customized products, as these products need work on immaterial engineering activities, prolonging the lead time to customer compared to standardized products.
Companies that merely focus on material activities in their order fulfillment processes risk making substantial errors in time and cost predictions for orders on customized products, impacting both quotation and execution work. Such errors may lead to delayed deliveries, budget overruns and resource shortages, ultimately resulting in reduced customer satisfaction and strained company finances. Only focusing on material activities when trying to improve the order fulfillment processes themselves, also results in lost potential for improvements within immaterial activities. It is therefore of the highest importance for manufacturing companies to keep track of total lead times.
A visualization of all lead times of the order fulfillment process, including both material activities and immaterial activities, would be of value when working on improveme nts. Potential of creating such a visualization is detected in the lead time tree model, where the foundation of the model could be adapted to not only include material activities, but also immaterial activities.
Using the lead time tree model to create a tool for visualizing order fulfillme nt processes, with focus on ETO products, would be to expand the view out from the material activities that the lead time tree model is focused on originally, and see the material activities as one part of the whole chain of activities within the order fulfillme nt process. The original lead time tree model would still be a very valuable tool when looking at material activities at a deeper level, and an adapted version of the lead time tree model, which also includes immaterial activities, would look at the order fulfillment process from a higher viewpoint.
1.3 Aim and research questions
As is said in the problem description, a potential new area of use for the lead time tree model is detected in creating a lead time tree model that could visualize the immater ia l activities of an order fulfillment process for ETO products. Once adapted, it could be of interest to research additional uses of the lead time tree model. The aim of this study is thereby:
To create a lead time tree model that can visualize the immaterial activities of an order fulfillment process for ETO products, and thereafter investigate additional
areas in which this lead time tree model can be used.
As the lead time tree model is originally created for tangible material activities, an assumption is made that some changes need to be made to the model in order for it to be able to handle non-tangible immaterial activities. This leads to the first of two research questions, which need to be answered in order to fulfill the aim of the study:
RQ1. What needs to be adapted in the lead time tree model for it include immaterial activities of an order fulfillment process for ETO products?
As the original lead time tree model has additional areas of use within improveme nt work, project management, and communication, it is interesting to see if an adapted model has the same capabilities. This leads to the second and last research question:
RQ2. Within order fulfillment processes for ETO products, how can the adapted lead time tree model be used in further areas, in addition to visualizing immaterial activities?
Crossing the findings from the two research questions should provide a comprehensive view of the lead time tree model as a tool to visualize the immaterial activities of an order fulfillment process.
1.4 Scope
The focus of this study is how the lead time tree model can be adapted to visualize immaterial activities within order fulfillment processes for ETO products. The process of developing ETO products has more immaterial activities than other manufactur ing strategies, as production for ETO products needs to be preceded by engineer ing activities. Order fulfillment processes and ETO products have been chosen as the scope of the study in order to investigate an industrial field containing multiple immater ia l activities, since this exam work is conducted within the subject area of production systems. However, the differences in properties are probably not that large between immaterial activities in order fulfillment processes and other immaterial activit ies, regardless of if the processes are conducted within manufacturing industry or any other business. Hereby follows that the results of this study should be applicable to other business areas as well.
The original lead time tree model is in this study intended to be adapted to include immaterial activities within order fulfillment processes. However, order fulfillme nt processes often include material activities as well. Material activities will be taken into account when creating a lead time tree, but from a higher viewpoint than in the origina l lead time tree model. Production and other material activities will be included as activities, interacting with the immaterial activities.
Immaterial activities in the study are defined as both active and non-active activit ies, regardless of if they are handled by a person or a machine.
The study uses experience based data from a case company and theoretical data from existing literature. It is not within the scope of this study to expose the adapted lead time tree to a real life project.
1.5 Outline
This master’s thesis is divided into five chapters, with this introductory chapter as the first one. The second chapter Theoretical background, presents theory on which the study is based, in order to provide a deeper understanding about the original lead time tree model, the context for immaterial activities and their lead time within manufacturing industry, and concepts which regard immaterial activities. The third chapter Method and implementation, describes how the study has been conducted. The fourth chapter Findings and analysis, covers the finding of the study, analyzed towards the literature study and the empirical study. The result of the fourth chapter is an adapted
Introduction
4
version of the lead time tree model, which takes immaterial activities into account. The last chapter Discussion and conclusions, presents a discussion and evaluation of the research and its results.
2 Theoretical background
The following chapter presents the theories on which the study is based. The chapter is divided into three parts: context for immaterial activities and their lead times within manufacturing industry, information about the original lead time tree model, and concepts used to regard immaterial activities.
2.1 Context for immaterial activities and their lead times within manufacturing industry
This sub-chapter provides theory regarding the context for how immaterial activit ies and their leads times are correlated within manufacturing industry.
2.1.1 Engineer to order
Engineer to order, ETO, is a manufacturing strategy where the products are unique ly designed and produced for the individual customer, i.e. purely customized. (Mattsson, 1987; Lampel & Mintzberg, 1996; Hilletofth, 2009; Cannas, Pero, Rossi & Gosling, 2018). The ETO strategy facilitates the customers to be closely involved in the decision making of the product, as all decisions regarding the product are made after the customer order is made. However, this also results in long lead times from the customer’s perspective, as no activities in the order fulfillment process are performed before the customer order is placed (Cannas, Pero, Rossi & Gosling, 2018; Rudberg & Wikner, 2004).
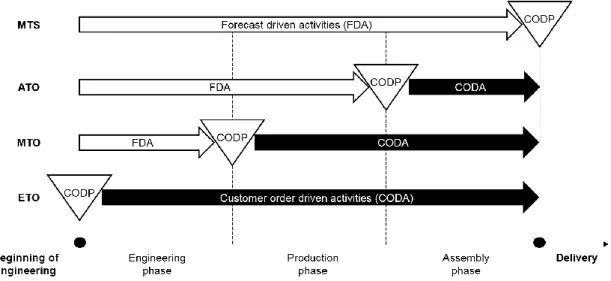
Figure 2.1 can be used to understand the ETO strategy, which shows different positions of the CODP and the resulting manufacturing situations. CODP stands for customer order decoupling point, which is the point in the product development process from where the activities goes from being done according to forecast to being done according to customer order (Wikner & Rudberg, 2005). When the ETO strategy is used, the CODP is placed at the very beginning of the order fulfillment process, see Figure 2.1. This means that all activities in the order fulfillment process, from the engineer ing phase (design of the product) to delivery, are executed according to customer order (Bäckstrand, 2012; Cannas, Pero, Rossi & Gosling, 2018, Rudberg & Wikner, 2004). What should be noted is that ETO products also can contain standardized components (Bäckstrand, 2012).
Theoretical background
6
Figure 2.1 The relationship between ETO and its CODP, based on Cannas, Pero, Rossi and Gosling (2018)
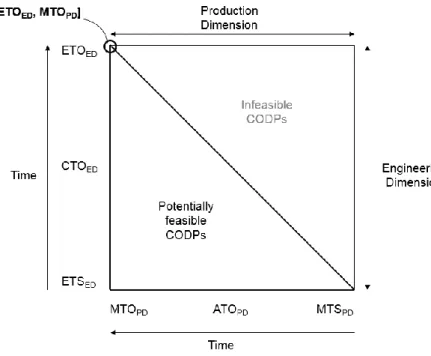
Figure 2.1 shows a linear approach to the CODP concept, which is the most commonly used way to explain CODP and the manufacturing strategies. However, this linear approach does not fully differentiate between engineering and production-related activities. In 2004, Rudberg and Wikner developed a two-dimensional CODP space, see Figure 2.2, which takes both the engineering and production dimensions of manufacturing into account, showing the differences between them. In the two-dimensional CODP space, ETO is placed at one extreme point of the engineer ing dimension, the vertical axis. This means that the product is both designed and engineered to order, and the production dimension of the order fulfillment process can therefore only begin after the engineering dimension is finished, i.e. the production dimension of ETO use the strategy make-to-order, MTO. The CODP of ETO products is therefore placed at the tuple of ETOED and MTOPD, where ED stands for ‘engineering
dimension’ and PD stands for ‘production dimension’, shown in Figure 2.2 as [ETOED,
Figure 2.2 The relationship between ETO and its two-dimensional CODP, based on Rudberg and Wikner (2004)
The two-dimensional CODP space is chosen to illustrate ETO in this study, as the immaterial activities discussed in this study are all part of the engineering dimension of the order fulfillment process. An adapted lead time tree model that can illust rate immaterial activities would therefore be more of help within the engineering dimensio n than the production dimension. The original lead time tree model can already facilitate the needs of illustrating lead times in the production dimension, as this dimension is purely focused on production related activities.
2.1.2 Order fulfillment process
An order fulfillment process is, as previously stated, defined as “the chain of events from the moment the customer places an order, to the moment the order is fulfilled ” (APICS, 2017). Which functions that are included in the order fulfillment process depends on the type of manufacturing strategy that the company is producing according to, i.e. ETO, MTO, ATO, MTS et cetera. When the company is using ETO, most of the functions within both the engineering dimension and the production dimension of product development are performed within the scope of the order fulfillment process, as the products are both engineered and produced after the customer has placed the order (Gosling, Hewlett & Naim, 2017).
The extent of the order fulfillment process towards the customer depends on the type of Incoterms rule being followed. There are seven Incoterms rules according to Incoterms® 2010, where the Incoterms rule ‘ex works’, EXW, implies the least amount
of responsibility as possible for the seller regarding distribution, and ‘delivery duty paid’, DDP, implies the most responsibility as possible for the seller regarding distribution. When a company is using EXW, distribution lies outside the scope of the order fulfillment process. EXW means, according to Incoterms® 2010, that the buyer is
responsible for transportation from the point in time that the seller places the goods at the disposal of the buyer at the seller’s premises i.e. warehouse, factory et cetera. This
Theoretical background
8
means that the seller is not responsible for loading the goods onto any collecting vehicle, nor does the supplier need to, when applicable, clear the goods for export. When a company is using DDP, distribution lies within the scope of the order fulfillment process. DPP means that the seller is responsible for transportation as well as to clear the goods for both export and import, pay any duty for both export and import, and carry out all customs formalities. The customer is responsible for unloading the goods at the named place of destination. (International Chamber of Commerce, 2010)
2.2 The original lead time tree model
This sub-chapter provides a deeper understanding about the original lead time tree model and its areas of use. The reference for this sub-chapter is Bäckstrand (2012) unless nothing else is stated. A fictitious example of an end product called ‘Product Z’ will be used to explain and illustrate the lead time tree model in this sub-chapter. Note regarding terminology
The ‘lead time tree’ is in the study by Bäckstrand (2012) originally named ‘time-phased product structure’, due to its visualization and addition of lead time to a product structure. The term ‘time-phased product structure’ is in this study exchanged to the term ‘lead time tree’, as this term allows extension to include immaterial activities. Lead time tree is also the term commonly used by the companies included in Bäckstrand’s study, the companies and organizations that have used the tool after the publication of the study, and by Bäckstrand herself. The decision to use the term lead time tree model from the very beginning of this report is to not confuse the reader by using two terms for the same model.
2.2.1 Creating a lead time tree
A lead time tree for a product is based on the information found in the end product’s product structure and bill-of-material, together with the lead times of its components (Clark, 1979). A description of how to create a lead time tree step-by-step is presented in the following sections.
2.2.1.1 Product structure
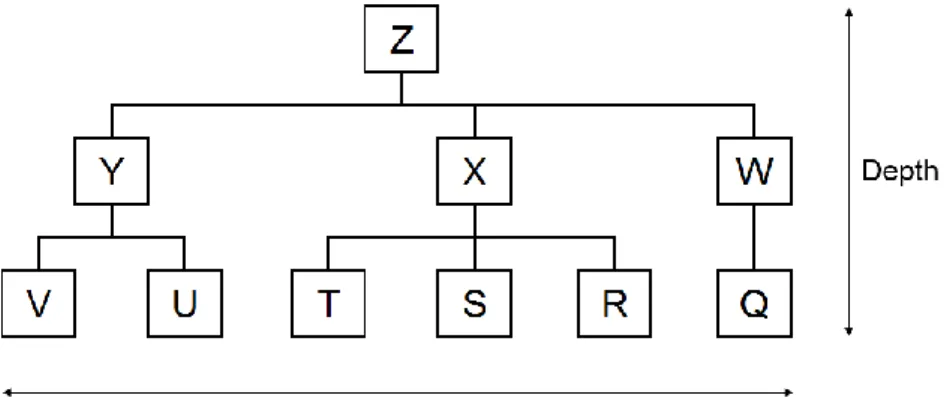
The product structure shows the content of the end product and specifies the order of production and assembly of its components. The product structure can be illustrated as a tree, which can be seen in Figure 2.3, where an example of a product structure for Product Z is shown. Y-Q refers to the components included in Product Z.
Figure 2.3 An example of a product structure, based on Bäckstrand (2012)
The format of the product structure determines how complex the end product is, and the product structure’s depth and width is crucial for its complexity. Each node in the structural tree, defined as a point in the structure where components intersect or branch, is a planning point, for example where components Y, X, and W intersect into Product Z. The deeper the structure you have, the more planning points there are. The structure depth thus influences the administrative effort required to control the product's material flows. With a deep structure, longer lead times follow. Each planning point involves administration and causes lead time supplements. The deterioration in the transparency and the increased complexity of material flows that follow with deep structures also prolongs the total lead times for producing the product. The complexity of an end product from a width perspective refers to how many articles that are included in each structure level. Broad structures mean that many articles must be available at the same time in order to start production at the overlying structure level. (Jonsson & Mattsson, 2016)
2.2.1.2 Bill-of-material
The bill-of-material lists the information given in the product structure, as well as more detailed information regarding the origin of each component. Components are in Bäckstrand (2012) referred to as ‘items’, why the ‘item’-term will be used in the tables of this sub-chapter. As can be seen in Table 2.1, which is an example of a bill- of-material for Product Z, the components are differentiated between if they are manufactured, purchased or sub-assembled. The last level of the bill-of- material is always constituted by purchased components.
Theoretical background
10
Table 2.1 An example of a bill-of-material, based on Bäckstrand (2012)
Item ID Item type
Z End product Y Sub-assembly V Purchased U Purchased X Sub-assembly T Purchased S Purchased R Purchased W Manufactured Q Purchased
2.2.1.3 Lead time table
When information regarding lead times for each component and sub-assembly is added into the bill-of-material, it turns into a lead time table. An example of a lead time table for Product Z can be found in Table 2.2. Lead times are divided into external lead times for purchased components, and internal lead times for manufactured components and sub-assemblies. A column for additional lead times is also added to the table if needed, if there are any delivery and/or production limitations that must be taken into account, such as safety lead time, time-to-storage, time marked for quality control, or deliver ies with a scheduled frequency. The column of additional lead time can be re-named to fit the nature of the lead time in question.
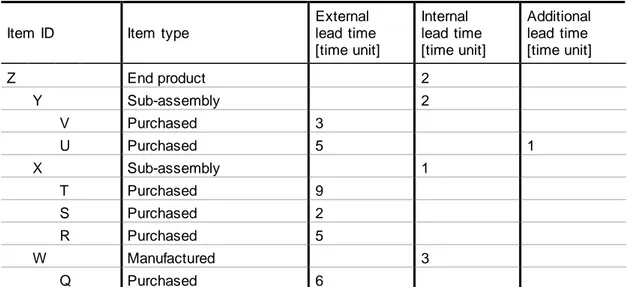
Table 2.2 An example of a lead time table, based on Bäckstrand (2012)
Item ID Item type
External lead time [time unit] Internal lead time [time unit] Additional lead time [time unit] Z End product 2 Y Sub-assembly 2 V Purchased 3 U Purchased 5 1 X Sub-assembly 1 T Purchased 9 S Purchased 2 R Purchased 5 W Manufactured 3 Q Purchased 6
The lead time tree model merges information from e.g. purchasing and production into a single table, information that is normally held separated. This facilitates people from all parts of the company to understand the overall set-up of the product’s lead time. The fact that the lead time tree model presents if the respective lead times are internal or external, it thereby shows which actor can influence the lengths of those lead times.
2.2.1.4 Supply lead time table
The lead time table provides a compilation of information from different parts of the company, but it does not present any new information about the lead times. By expanding the table to a supply lead time table, see Table 2.3, new information about the lead times can be read that previously had not been accessible, regarding when purchasing or production need to be initiated in order to keep the end product time plan.
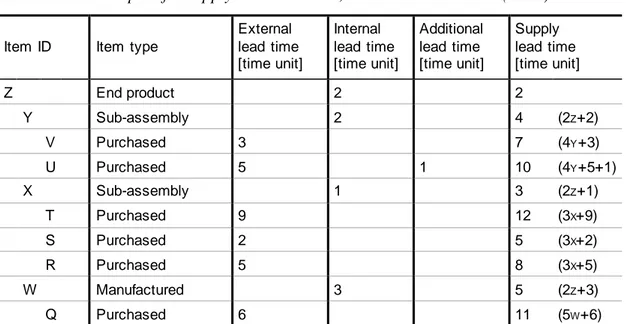
Table 2.3 An example of a supply lead time table, based on Bäckstrand (2012)
Item ID Item type
External lead time [time unit] Internal lead time [time unit] Additional lead time [time unit] Supply lead time [time unit] Z End product 2 2 Y Sub-assembly 2 4 (2Z+2) V Purchased 3 7 (4Y+3) U Purchased 5 1 10 (4Y+5+1) X Sub-assembly 1 3 (2Z+1) T Purchased 9 12 (3X+9) S Purchased 2 5 (3X+2) R Purchased 5 8 (3X+5) W Manufactured 3 5 (2Z+3) Q Purchased 6 11 (5W+6)
The supply lead time represents the time from component initialization until finalized production of the end product. The supply lead time for the individual component is calculated based on the supply lead time of its parent component, the internal or external lead time of the individual component, and the additional lead time of the individ ua l lead time if any, see Table 2.3. The calculation of the supply lead time for each component is indicated in brackets, and the parent component’s supply lead time is indicated with its component ID in lower-case letters.
2.2.1.5 Supply lead time compilation table
The supply lead times of the components can be compiled into a supply lead time compilation table, where the components are sorted in timely consecutive order, see Table 2.4. This table provides a simple overview of in what order and when purchasing or production needs to be initiated for each component to be able to keep the time plan for the end product, and is therefore a useful tool for planning purposes.
Table 2.4 An example of a supply lead time compilation table, based on Bäckstrand (2012)
Supply lead time [time unit] 12 11 10 8 7 5 4 3 2 Item ID T Q U R V S W Y X Z
Theoretical background
12
2.2.1.6 Lead time tree
As earlier mentioned, the lead time tree model combines information from the end product’s product structure and bill-of-material, and each component’s lead time through the supply lead time table. The lead time tree model can, easily explained, be compared to a product structure that has been tilted 90 degrees, where the length of each line corresponds to the lead time of each individual component, see Figure 2.4. The lead time tree model can therefore easily visualize how long it takes to produce the end product, as well as how the different components relate to each other in the end product.
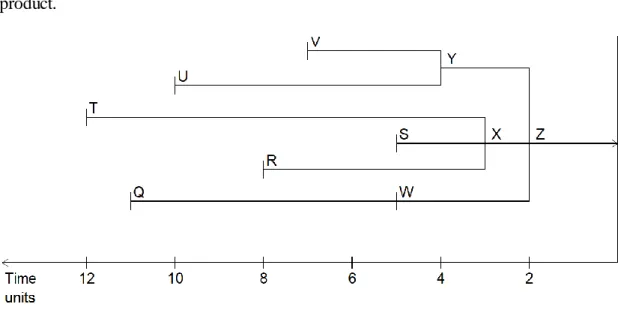
Figure 2.4 An example of a lead time tree, based on Bäckstrand (2012)
The lead time tree is created with backwards planning where the point in time when the end product is completed is set to zero (0). The horizontal axis represents the number of time units before completion of the end product that the components need to be purchased or manufactured. The component’s individual lead time is illustrated with a correspondingly long line, and marked with its component ID. As can be seen in the supply lead time table, see Table 2.3, Product Z needs two time units for its final assembly. The length of line Z in the lead time tree, see Figure 2.4, therefore corresponds to that lead time of two time units.
2.2.2 Using the original lead time tree model for analysis
The fact that the lead time tree model visualizes the lead time for the end product and all its constituent components in such a simple, easy-to-understand and fact-based way, makes it a useful tool for identifying and analyzing the end product's structure, both in terms of components and lead time (Bäckstrand, 2012). The visualization makes it easy to see and understand the magnitude of the lead times (Wikner, 2014). We can see in the lead time tree in Figure 2.4 that the cumulative lead time for the components and sub-assemblies T, X and Z results in the longest total lead time for Product Z, in this case 12 time units. This total lead time constitutes the duration of the process and is called the critical path, which will be further explained below in Chapter 2.2.2.1. The visualization of the critical path makes it easier to see where focus should be placed in order to reduce lead times, as well as to identify waste in the flow (Wikner, 2014).
The lead time tree model has also proven to be a useful tool for root-cause analysis. The visualization of lead times for the end product and its constituent components, and the understanding the visualization entails, aids systematic problem identification of the order fulfillment process. In such cases, root-causes can be identified and decisions regarding these can be fact based (Bäckstrand & Engström, 2017).
2.2.2.1 The critical path
The critical path is the series of successive activities in a process that requires the maximum time, which thereby gives the duration of the process (Butterfield & Ngondi, 2016; Park & Allaby, 2017). Activities on the critical path are called critical activit ies. Delays of critical activities delay the total lead time of the process, and subsequently, expedited critical activities speed up the process. Activities that are not on the critical path do not affect the duration of the process, if their delays do not exceed the duration of the critical path (Wong, 1964).
2.2.3 Using the original lead time tree model as a boundary object for communication
Information within a company is often kept locally and is not openly shared between different functions, which thereby complicates understanding of each other’s priorities and limitations. The lead time tree model combines this previously separated information into a single source of information, and the process of making the lead time tree forces the different functions of the company to work interdisciplinarily. The lead time tree model therefore works as a boundary object, a mediating tool between interdisciplinary functions (Bäckstrand & Engström, 2017).
The lead time tree model fulfills the characteristics of an effective boundary object that, according to Carlile (2002, cited in Bäckstrand & Engström, 2017), a boundary object needs to fulfill: “establish a shared language for individuals to present their knowledge, provide a concrete meaning for individual to learn about differences and dependencies across a given boundary, and facilitate a process where individuals can reflect together and transform their knowledge jointly”. The lead time tree model has proved to be a useful boundary object for the companies that participated in Bäckstrand's (2012) study. The people involved expressed new understandings in several fields. People from different departments within the companies could identify their part of the production as part of a chain. Departments that previously did not communicate in such a way have established a common language and have started to contact each other to see how changes in the own department affect the rest of the company. The lead time tree model has also been a tool for mediation in contact with suppliers, to show how the suppliers' lead times affect the focal company's ability to deliver to the end customer.
2.3 Concepts used to regard immaterial activities
This sub-chapter presents theory that supports immaterial activities, as opposed to material activities.
Theoretical background
14 2.3.1 Cross-functional flow chart
Cross-functional flow chart, also called function flow chart or swim lane flow chart, is a method often used to map and illustrate flows of immaterial activities. The method is described in several works of reference, for example in Petersson, Johansson, Broman, Blücher and Alsterman (2009) and in Jonsson and Mattsson (2016). The cross-functional flow chart creates a clear visualization of the whole chain of events within a process flow, as it shows the activities that take place, in what order they do so, and who are responsible for executing them. An example of a cross-functional flow chart can be found in Figure 2.5.
Process ID Function Y Function X Function Z Activity Activity Activity Activity Activity Activity
Figure 2.5 An example of a cross-functional flow chart
A cross-functional flow chart visually distinguishes the process flow between the functions (often departments, professions, or individuals) involved in the process and highlights the transitions between these functions. Each function in the mapped process is represented by a labeled lane, and every activity in the process is marked in order of time in the corresponding lane, connected by arrows, see the example flow chart in Figure 2.5. Documentation and other information that is a part of the mapped process are linked to respective activity. A cross-functional flow chart therefore clarifies what participants a process has, their respective responsibilities, and the informat io n transferred (Petersson et al., 2009). In all, the cross-functional flow chart is useful when mapping a process flow, and to identify its scope and level of complexity. This makes it into a useful tool for communication between functions (Jonsson & Mattsson, 2016).
3 Method and implementation
With presentations of the underlying objectives of research and reasoning style, this chapter provides detailed explanations and descriptions of the process of research, including data collection techniques and methods for data analysis, as well as a discussion regarding the research quality of this study.
3.1 Objectives of research and reasoning style
There are, according to Wacker (1998), two general objectives of research: theory-building and fact-finding. The purpose of theory-theory-building research is to build an integrated body of knowledge to be applied to many instances, while the purpose of fact-finding research is to build a lexicon of facts that are gathered under specified conditions. The aim of this study, “to create a lead time tree model that can visualize the immaterial activities of an order fulfillment process for ETO products, and thereafter investigate additional areas in which this lead time tree model can be used”, is, with these two objectives of research in mind, thereby based on theory-build ing research.
Theory-building research can be executed in two different ways, analytically or empirically, where analytical research uses deductive methods to build theories and empirical research uses inductive methods to build theories (Wacker, 1998). This study has mainly been conducted with a deductive reasoning style, which is linked to the hypothesis-testing approach to research (Williamson, 2002). The study has been grounded in theory and matched with empirical data, which means that the study has been conducted according to a deductive reasoning style with some inductive input. This ratio between deductive and inductive has however not been as large as to call it abductive.
One way of analytical theory-building is analytical conceptual research, as described by Wacker (1998). The purpose of analytical conceptual research is to add new insights into traditional problems through logical relationship-building. The aim of this study has been to develop an analytical conceptual model by logical reasoning and pattern-matching between theoretical and empirical data.
3.2 Research process
The research process of this study started with a feasibility study in order to frame the research problem. The feasibility study started with several conversations with Bäckstrand, whose research this study is based on, about the lead time tree developed by her and the possible development that the model could have towards being useable for immaterial activities. The doctoral dissertation by Bäckstrand from 2012, where the lead time tree model was presented, has in adjunction to this been deeply investigated. A literature review has been conducted to investigate if something similar to this study had been done in the past, which the literature review showed no signs of. Within the feasibility study, conversations have also been held with the case company of this study about the idea of the lead time tree model being adapted to also include immater ia l activities, and their view on if and how the adapted model could be useful for them and their processes.
Method and implementation
16
The research process continued with identifying what needed to be adapted in the lead time tree model for it to also include immaterial activities. Input from the case company has been studied simultaneously with the lead time tree model, to identify parts of the model that needed to be adapted for the model to be able to handle immaterial activit ies. Empirical data from the case company has been used within the study to base the adaption of the lead time tree model on how an order fulfillment process for ETO products works in real life. Data retrieved from discussions with key personnel at the case company, as well as from a process map of an order fulfillment process from the case company, has been used to create the adapted lead time tree model.
The data gathered during the study and the output created within the study have been analyzed continuously throughout the research process.
3.3 Data collection
The data collection of this study is divided into two parts: a literature study and an empirical case study. These are explained further in the following sections.
3.3.1 Literature study
A brief literature review has been conducted during the feasibility study, to see if something similar to this study had been done before. A search for publications that had cited Bäckstrand (2012) has been conducted at the citation databases Scopus and Google Scholar. On March 15th 2019, Scopus showed no results for Bäckstrand (2012),
while Google Scholar had 16 hits. The abstracts of the 16 publications found through Google Scholar have been investigated to see if they were relevant, and none of these had analyzed Bäckstrand’s (2012) research in a similar way that has been done in this study.
The literature studied during this study has mostly been retrieved with a citation pearl growing technique, with references from Bäckstrand’s (2012) doctoral dissertation and other sources seen as relevant, as well as recommendations from Bäckstrand herself and literature from the master’s program. Literature has also been searched for within subjects such as engineering to order, order fulfillment process, lean administrat io n, flow chart, and project planning. Results from the literature study have been limited to publications written in English and Swedish.
3.3.2 Empirical case study
An empirical case study at a case company has been conducted within this study to retrieve data regarding how a real life order fulfillment process for ETO products can look like, and to investigate what challenges the company faces with lead times for ETO products. The case company and the collection of empirical data are further presented in the following sections.
3.3.2.1 The case company: Kongsberg Maritime Sweden AB, previously Rolls-Royce AB
The case company in this study has been Rolls-Royce AB and more specifically the division Rolls-Royce Commercial Marine, located in Kristinehamn, Sweden. On April
1st 2019, Rolls-Royce Commercial Marine became acquired by Kongsberg Gruppen
ASA and the division thereby changed name to Kongsberg Maritime Sweden AB. The company manufactures propulsion products for offshore and merchant vessels and oil and gas platforms, such as propellers, water jets, thrusters, and maneuvering systems. The plant in Kristinehamn has 240 employees, of which 230 are white-collar workers and 10 are blue-collar workers. Almost all products produced by the company are ETO products. The production process, excluding assembly, is out-sourced to a variety of different suppliers, and focus is subsequently on research and development, customer specific engineering, procurement, and in-house product assembly. This made the company a suitable case company for this study, as the products are customized and engineered to order, and the order fulfillment processes within the company is mostly conducted by white-collar workers through immaterial activities.
3.3.2.2 Data collection at the case company
Discussions with key personnel at the case company have been held throughout the study. The discussion has resulted in information about their struggles with lead times for ETO products, their view on the lead time tree model, as well as problems and tasks that they would like the adapted lead time tree model to consider.
A standardized process map of an order fulfillment process has also been gathered at the case company. The process map has provided useful information on how a real life order fulfillment process for ETO products can look like, regarding its structure and activities, and has been used for the creation of the adaption of the lead time tree model in this study.
3.4 Analysis of data
The basis of this study has been the doctoral dissertation by Bäckstrand (2012) and the lead time tree model in particular. The original lead time tree model has been analyzed towards theoretical data retrieved from a literature study within the analyt ica l conceptual research, and empirical data retrieved from an empirical case study at the case company. As can be seen in Figure 3.1, the lead time tree model has passed through the theoretical and empirical data, to form a lead tree model, adapted to include immaterial activities.
Method and implementation
18
Figure 3.1 Data analysis used for this study
The analysis of data is presented in Chapter 4, where the theoretical and empirical data are joined to create the adapted lead time tree model.
3.5 Research quality
Two factors that can indicate the quality of a study are validity - that the study truly investigates what it is intended to, and reliability - that the study can be repeated with consistent results (Williamson, 2002; Yin, 2007).
It is often recommended to strengthen the validity of a study through triangulation (Yin, 2007), which can be done by using several sources of information and data collectio n techniques. Triangulation regarding sources of information has been executed as much as it has been possible, as the lead time tree model is a relatively new research. References from the doctoral dissertation by Bäckstrand (2012) have been studied and checked, to investigate that the theory which the original lead time tree model is based on has been used and interpreted in a correct way. Using both a literature study and an empirical case study have contributed to data collection triangulation regarding the input used to shape the lead time tree model. Both theoretical and empirical data are needed for the adapted lead time tree model to be useful.
The study has been conducted with a close relation to Bäckstrand herself. This relation has resulted in a study that is closely linked to the original research, as well as the interpretation of the lead time tree model being endorsed by the person who created it. The reliability of the study is strengthened as the research process has been thoroughly described in this chapter. A replicated study would however require a similar contact with Bäckstrand as has been the case in this study, to be able to repeat it with consistent results.
4 Findings and analysis
This chapter is initiated with a presentation of the data gathered from the empirical case study. Furthermore, an analysis of the theoretical background and empirical case study is presented, which results in an adapted version of the lead time tree model, together with a sub-chapter on the ways the lead time tree model can be used for analysis and communication.
4.1 Findings from the empirical case study
Discussions with key personnel at the case company resulted in information regarding how lead times in order fulfillment processes for ETO products are viewed from both an external and internal standpoint.
When it comes to ETO products, purchases usually start with different companies submitting quotes that the customer chooses from. The quotation contains price proposals and sketches of the products. The CODP is therefore placed after the customer has approved the company's quotation, and sketches of the products are then available when the order fulfillment starts. Price is an order winner, but the proposed lead time is also vital for the decision of which company the customer chooses to contract. As soon as the customer decides on which company they want to contract, they want the process to go fast and the lead times to be short. The case company experienced that demands to shorten lead times pose a challenge, and that one can lose orders because of not being able to deliver within the desired lead time.
With shorter lead times also comes lesser tied up capital. Postponing purchases as well as man-hours as late as possible is therefore something that the case company strive s for. This is something that will be taken into consideration when creating the adapted lead time tree model. Activities of immaterial activities should therefore be planned to be initiated as late as possible during the length of the order fulfillment process. However, this does not mean that all activities should be postponed until the last minute, but that the latest initiation of the activity should be stated when planning the process. A problem regarding project planning is how to plan a project when the resources are shared with other on-going projects. A tool that allows interdependencies would aid such project planning.
Studying the process map of a standard order fulfillment process at the case company provided valuable information of how immaterial activities work. The informat io n regarding this will be discussed continuously in the following sub-chapters, where the process of creating a lead time tree model adapted to include immaterial activities is followed.
4.2 Adapting the lead time tree model to include immaterial activities This sub-chapter presents the steps of creating a lead time tree adapted to include immaterial activities. The original lead time tree model and the theory behind it, described in Chapter 2.2, is the basis of the adaption. The lead time tree model is analyzed towards the theoretical background and the information obtained from the empirical case study about immaterial activities for ETO products in an order
Findings and analysis
20
fulfillment process. A fictitious example of an order fulfillment process will be used to illustrate the creation of an adapted lead time tree model in this sub-chapter, which will be called ‘Order Fulfillment Process X’.
As is discussed in Chapter 2.1.2, the scope of the order fulfillment process towards the customer depends on the type of Incoterms rule being used. This information therefore needs to be considered when creating each lead time tree, as the lead time tree will include different amount of activities depending on Incoterms rule.
The order fulfillment process is assumed to begin directly after the order has been made by the customer.
4.2.1 Process mapping
According to Bäckstrand (2012), the first step in making a lead tree for material activities is to map the product and its components into a product structure. As material activities and immaterial activities are structured in different ways, the way the product structure can draw the relationships between the constituent components cannot satisfy the needs of mapping processes. A corresponding way of mapping immaterial activit ies is to use a process map, which is a technique that meets the differences between the structure of a product and the structure of a process. The type of process map that is used in this study is the cross-functional flow chart described in Chapter 2.3.1.
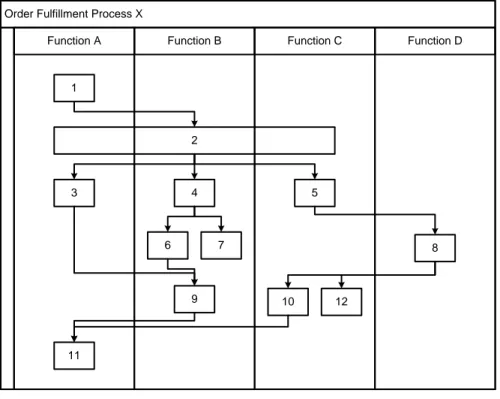
Figure 4.1 below shows Order Fulfillment Process X, mapped into a cross-functio na l flow chart. The structure of the order fulfillment process is inspired by the process map that has been studied at the case company, and shows different types of scenarios that an order fulfillment process can comprise. The example in Figure 4.1 will be followed in the remainder of this chapter.
Order Fulfillment Process X
Function A Function B Function C Function D
1 3 4 5 6 7 9 8 10 11 2 12
As can be seen in Figure 4.1, cross-functional flow charts and product structures are relatively similar to their appearance and in their structure, and they fulfill the same function, i.e. to show the relationships between the included activities. Cross-functio na l flow charts can also show which function that is responsible for each activity, which is shown by its lanes. Both internal and external functions can be displayed in this way in a joint cross-functional flow chart. Function D in Figure 4.1 is an external function. An activity can also involve several functions, which is illustrated by an activity that extends over the functions/lanes involved, see Activity #2 in Figure 4.1.
The most significant difference between product structures and cross-functional flow charts is the arrangement in which the flow is illustrated. For product structures, the end product is shown as the starting point, Product Z in Figure 2.3, and its constitue nt components are presented in descending order below it. This method is not suitable for illustrating processes. Instead, cross-functional flow charts show the first activity of the process as a starting point and its subsequent activities in timely consecutive order, i.e. in reverse order from product structures.
A difference between mapping the constituent components of a product compared to mapping activities in a process is that an activity in a process does not have to lead directly to another activity, see Activity #7 in Figure 4.1. That branch of the process is therefore broken with its last activity. Examples of such activities could be to write a project plan that needs to be available during the course of the project, or that a delivery confirmation must be sent to the customer, without the activity of writing the documents leading to new and subsequent activities.
4.2.2 Lead time table
In Chapter 2.2.1, it is described step-by-step how a supply lead time table is created for material activities and their constituent components. This supply lead time table forms the basis of the adapted lead time table, which will be used here to list the process' constituent activities and their respective lead times. The term ‘lead time table’ will be used hereafter to refer to the lead time table used for immaterial activities.
There have been some changes that needed to be made to the supply lead time table for it to fit immaterial activities. First, the supply lead time table listed the components with an indented hierarchical list to show the hierarchy and relations between components, with the end product at the top and as a starting point. This hierarchical indented list does not fit when listing immaterial processes, as immaterial activities are most easily listed with the first activity of the process as a starting point, and the following activit ies in a timely consecutive order, which is the opposite from listing products and its components in a parent-child relationship. The order of the activities is therefore included in the lead time table with the help of two columns, the activity’s predecessors and successors.
Another change needed to be made to the supply lead time table, was to include a column that lists which function that is responsible for each activity, as this informat io n is important when handling immaterial activities.
Instead of separating external and internal lead time, which is done in the origina l supply lead time table, external activities are in the lead time table marked with a grey
Findings and analysis
22
row. This makes it easy to see which activities that the company control directly, and which activities that are in the hands of external actors. Removing the column for external lead times also saves space in the lead time table.
The column ‘supply lead time’ in the supply lead time table needed to be renamed to include immaterial activities. This column is therefore named ‘cumulative lead time’ in the lead time table.
An example of a lead time table for Order Fulfillment Process X is presented in Table 4.1. The lead time table compiles the following information:
The activity’s ID.
A description of the activity, including what is meant to be performed during the activity and whether the activity is internal or external.
The function responsible for the activity.
The predecessor of the activity, i.e. the activity/activities that needs to be finished before the activity can be initiated.
The successor of the activity, i.e. the activity/activities that can be initiated as soon as the activity is finished. This information is needed when calculating the cumulative lead time.
The latest time unit for completion of the activity. An activity could have a date/other time unit when it must be finished, which should be noted here. The lead time of the activity. The lead time of the activity includes the whole lead
time for the activity to be finished, including non-value adding time.
The cumulative lead time of the activity. The cumulative lead time for immaterial activities and material activities is calculated differently than for materia l activities alone. The cumulative lead time for an activity is calculated by adding the activities lead time with its successor’s cumulative lead time. If an activity has multiple successors, the successor with the longest lead time is the one added.
Table 4.1 Lead time table for Order Fulfillment Process X Activity ID Activity description Responsible function Predecessor activity ID Successor activity ID Latest [time unit] of completion Lead time [time unit] Cumulative lead time [time unit] 1 Internal A - 2 2 16 (2+142) 2 Internal A, B, C 1 3, 4, 5 2 14 (2+124) 3 Internal A 2 9 2 8 (2+69) 4 Internal B 2 6, 7 3 12 (3+96) 5 Internal C 2 8 2 10 (2+88) 6 Internal B 4 9 3 9 (3+69) 7 Internal B 4 - 5 1 6 (1+5) 8 External D 5 10, 12 4 8 (4+410/12) 9 Internal B 3, 6 11 4 6 (4+211) 10 Internal C 8 11 2 4 (2+211) 11 Internal A 9, 10 - 2 2 12 Internal C 8 - 4 4
To clarify, the cumulative lead time for Activity #8 in Table 4.1 is calculated as 4+410/12.
10/12 means that the cumulative lead time for both Activity #10 and #12 is equally long and that either one of these could have been used to calculate the cumulative lead time for Activity #8. The cumulative lead time for Activity #7 is calculated as 1+5, which is the sum of its lead time and latest time unit of completion.
Additional columns may be added to the lead time table, if there is additiona l information about the process or activities that needs to be taken into consideratio n when creating the lead time tree.
Sometimes there is the possibility for activities in an order fulfillment process to be initiated in the middle of another activity. In order to show this in the lead time tree, it is recommended to divide the previous activity into two parts, where the subsequent activity can be initiated when part one of the first activity is completed. By dividing the activity like this, it clarifies exactly what needs to be done in the previous activity in order for the next one to be able to start, as well as it enables the illustration of the lead time tree to be kept as simple as possible.
4.2.2.1 Cumulative lead time table
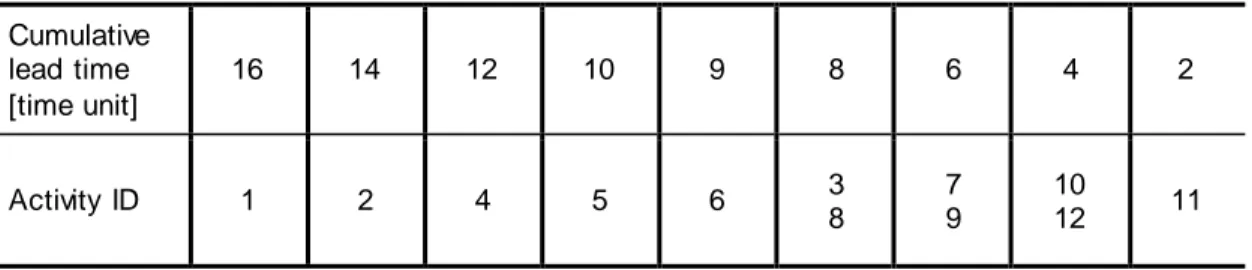
A supply lead time compilation table, which is described in Chapter 2.2.1.5, can be used for immaterial activities in the same way as it is used by Bäckstrand (2012), simply by being re-named to ‘cumulative lead time table’. Table 4.2 below presents the cumulative lead time from Table 4.1 in a compiled table, where only the activities’ ID and the respective cumulative lead times are presented.
Findings and analysis
24
Table 4.2 Cumulative lead time compilation table for Order Fulfillment Process X
Cumulative lead time [time unit] 16 14 12 10 9 8 6 4 2 Activity ID 1 2 4 5 6 3 8 7 9 10 12 11
The cumulative lead time compilation table can be used as a stand-alone tool for planning purposes, as it provides a compilation of the important time units of initiat io n for the activities.
4.2.3 Lead time tree
The lead time table compiles all the data needed to create a lead time tree for immater ia l activities. As the lead time table contains more data than the ‘supply lead time table’ does, together with the fact that immaterial activities often are more complex in their structures than material activities are, the lead time table has therefore been chosen to be included in the lead time tree, as a running list below the lead time tree, see the example of the lead time tree for Order Fulfillment Process X in Figure 4.2. Having the lead time table adjacent to the lead time tree makes the lead time tree easier to comprehend.
There are several differences between creating a lead time tree for material activit ies and for immaterial activities. The decision to initiate all activities as late as possible during the process, further described in Chapter 4.1, needs to be kept in mind when creating and analyzing the lead time tree.
The largest difference between creating a lead time tree for material activities and for immaterial activities, is that the number of lead time lines in the lead time tree can increase along the axis of time, i.e. the lead time tree can receive a larger structure width, which is discussed in Chapter 2.2.1.1. When comparing this to a lead time tree that considers components, then one component could not be separated into two or more components. Immaterial activities on the other hand do not work like that, and the completion of a single activity can lead to multiple activities being able to be initiated. When looking at Activity #9 in the lead time tree in Figure 4.2, one can see that this increase of lead time lines leads to a problem that has to be handled in creating the method of drawing a lead time tree. Activity #9 cannot be initiated until Activity #3 and #6 are completed, but Activity #3 can be completed four (4) times units ahead of Activity #6. A dashed line has therefore been drawn between Activity #2 and #3, to still be able to illustrate the relationship between Activity #3 and #9. The dashed line has been placed before the initiation of Activity #3 and not after, as activities have been chosen to be initiated as late as possible. The dashed line therefore implies that an activity that is placed after the dashed line can be initiated whenever during the course of the dashed line, but not later than when the solid line begin. However, it is recommended to initiate the activity as late as possible, to avoid tied up capital.
The fact that the structure width can increase with time also entails that the lead time tree needs to be created with both backwards and forwards planning, unlike the lead time tree for material activities that is only created with backwards planning. To create the lead time tree for immaterial activities, it is needed to alternate between the two, but with a start in backwards planning.
As described in Chapter 4.2.1, an activity in a process does not have to lead directly to another activity. An example for this is Activity #7 in Figure 4.2, where that branch of the process is broken with Activity #7. As Activity #7 has a set latest time unit for completion, the completion for the activity is set to 5 time units before the end of the process. If Activity #7 did not have a latest time unit for completion, the activity would have been placed at the very end of the whole process, with time unit of completion set to zero (0), to regard that activities should be finished as late as possible to reduce tied up capital.
Another difference between lead time trees for material activities and for immater ia l activities is that a lead time tree for immaterial activities does not have to be completed with a single activity, as opposed to the lead time tree for material activities which always lead to a single assembly of the end product, see Figure 2.4. This means that there can be multiple lead time lines that connect to the finishing vertical line that illustrate the end of the process and time unit zero. Final activities could for example be delivery of the product, and delivery of a material certificate for the product.
One thing that the original lead time tree model could not cater to, when adapting it to include immaterial activities, is that it does not present which function is responsible

![Table 4.1 Lead time table for Order Fulfillment Process X Activity ID Activity description Responsible function Predecessor activity ID Successor activity ID Latest [time unit] of completion Lead time [time unit] Cumulative lead time [time un](https://thumb-eu.123doks.com/thumbv2/5dokorg/5411867.138965/29.893.135.759.140.523/fulfillment-activity-description-responsible-predecessor-successor-completion-cumulative.webp)