Faculty of Natural Resources and Agricultural Sciences
Changed behavior in the house cricket
Acheta domesticus: Predetermined or an
effect of learning?
Förändrat beteende hos Hussyrsan Acheta domesticus:
Förutbestämt eller en effekt av inlärning?
Caroliné Olofsson
Independent project • 15 credits
Biology and Environmental Science – Bachelor´s Programme Department of Ecology
Changed behavior in the house cricket Acheta
domesticus: Predetermined or an effect of learning?
Förändrat beteende hos Hussyrsan Acheta domesticus: Förutbestämt eller en effekt av inlärning?
Caroliné Olofsson
Supervisor: Åsa Berggren, SLU, Department of Ecology
Examiner: Matthew Low, SLU, Department of Ecology
Credits: 15 credits
Level: G2E
Course title: Independent project in Biology
Course code: EX0894
Programme/education: Biology and Environmental Science
Course coordinating department: Department of Aquatic Sciences and Assessment
Place of publication: Uppsala
Year of publication: 2019
Cover picture: Caroliné Olofsson
Online publication: https://stud.epsilon.slu.se
Keywords: Personality, Crickets, Boldness, Animal personality, Learning
Swedish University of Agricultural Sciences
Faculty of Natural Resources and Agricultural Sciences Department of Ecology
The interest in animal personality have increased the last couple of decades and several studies have been made trying to explain why these differences in behaviour exist between individuals. Some of these studies have found that an individual’s personality changes as it ages and to explain these, theories focusing on genetic and phenotypic aspects has been used. Predictions that an organism’s experiences would change its behaviour have however ben made.
To test if learning was a reason for the animals changed behaviour, I tested if repeated behavioural would cause behaviour in the House cricket Acheta
domesti-cus, to change. The personality trait measured was boldness, an individual’s
will-ingness to expose itself to risks.
To measure boldness in the crickets, behavioural trails where a cricket´s willing-ness to exit out of a tube and into a novel environment was tested. The time it took for crickets to exit the tube was measured in two groups, one control group and one test group. The control group was tested once at the start of the experiment and once at the end while the test group that was tested multiple times throughout the experiment.
Results showed that a cricket´s emergence time decreased with repeated test trails in the test group. While no clear decrees could be seen in the control group. These results indicate that crickets did become bolder whit time in the test group but not in the control group. These differences between groups indicates that there might be a learning process going on.
Keywords: Personality, Crickets, Boldness, Animal personality, Learning
Abstract
Sammanfattning
Intresset för djurens personlighet har ökat de senaste decennierna och flera studier har gjorts för att förklara varför dessa skillnader i beteende finns mellan individer. Några av dessa studier har funnit att en individs personlighet förändras i takt med att den åldras och för att förklara detta har teorier som främst fokuserar på genetiska och fenotypiska aspekter använts. Förutsägelser om att en organisms upplevelser skulle förändra dess beteende har dock gjorts.
För att testa om lärande var en orsak till djuren förändrade beteendet, testade jag om upprepat beteendetester skulle orsaka ett förändrat beteende hos Hussyrsan
Acheta domesticus. Det personlighetsdrag som testades var en individs benägenhet
att utsätta sig för risker.
För att mäta risktagandet hos syrsorna testades hur villig en syrsa var gå ut ur ett rör och in i en ny miljö testades. Den tid det tog för syrsor att lämna röret mättes i två grupper, en kontrollgrupp och en testgrupp. Kontrollgruppen testades en gång vid experimentets början och en gång i slutet, medan testgruppen testades flera gånger under experimentet.
Resultaten visade att en crickets utgångstid minskade med upprepade tes-tongångar i testgruppen. Men inga klara skillnader kunde ses i kontrollgruppen. Dessa resultat tyder på att syrsorna blev mer risktagande med tiden i testgruppen men inte i kontrollgruppen. Dessa skillnader mellan grupper indikerar att det möj-ligtvis förekommer en inlärningsprocess.
List of tables 7 List of figures 8 Introduction 9 1 Methods 12 1.1 Study individuals 12 1.2 Behavioural trials 12 1.3 Statistical method 13 2 Results 14 3 Discussion 17 4 References 20 Acknowledgements 22 Appendix 1 23
Table of contents
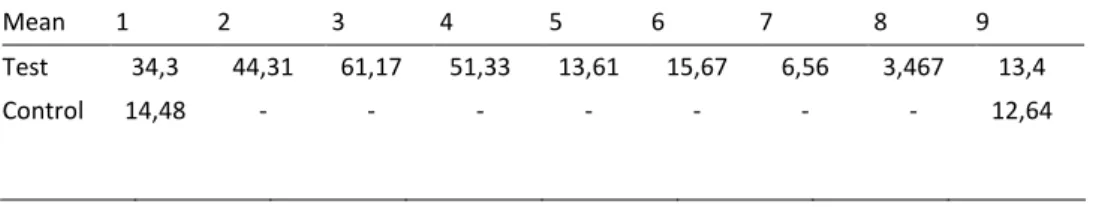
Table 1. Mean value of the time it took for the cricket to fully leave the tube from trial
1 to trial 9. 14
Table 2. Mean value for time it took for the cricket to first emerge from tube from trial
1 to trial 9. 15
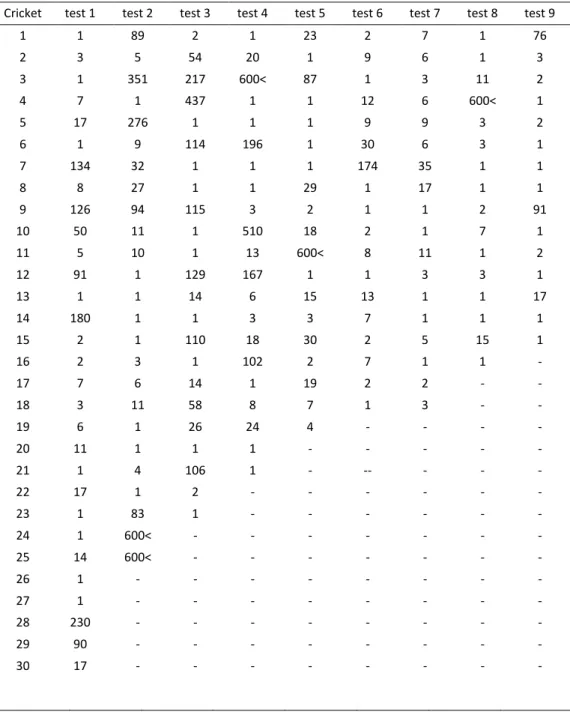
Table 3. Number of seconds it took for the crickets in the test group to leave the
tube. 23
Table 4. Number of seconds it took for the crickets in the control group to leave the
tube. 24
Table 5. Number of seconds it took for the crickets to leave the tube for the crickets that I was able to follow. 24 Table 6. Number of seconds it took for female crickets to leave the tube. 26 Table 7. Number of seconds it took for male crickets to leave the tube. 26
8
Figure 1. Mean value of the time it took for crickets to leave the tube entirely 15
Figure 2. Mean value of the time it took for crickets to first appear outside the tube.
15
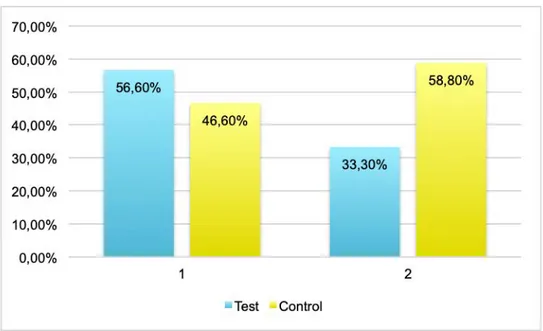
Figure 3. Proportion of the groups that did not leave tube instantaneously. 16
List of figures
Whether or not animals display different personalities is a burning question for ecologists. The fact that humans display different personalities is a wildly spread and accepted fact, but the possibility that animals would show the same type of pattern have long been unknown. The last couple of decades however this subject have reached increasing recognition and several studies have been made as an attempt to get answers (Reale et al., 2010). Traditionally the main focus in ecolog-ical studies have been on the group as a whole and assumptions about behaviour have been drawn from changes in the mean behaviour responding to changes in the environment (Sih et al., 2004). This even when individual differences in be-haviour have real consequences, both ecologically and evolutionary (Reale et al., 2007). The behaviour of an individual do for example effect how often they are encountered in the wild (and can therefore be both under- and over-represented when it comes to ecological observations), it has effects on how animals move and use space, what habitat they choose or their reproductive success (Merrick and Koprowski, 2017).
Personality or a behavioural syndrome is an organism’s predisposition to be-have consistent within a context. When studying behavioural syndromes, we look at within-individual and between-individual consistency. Within-individual con-sistency is if an organism shows similar patterns in a certain situation when ob-served multiple times. While between-individual consistency is a consistent differ-ence in behaviour among individuals (Sih et al., 2004). Typically the behavioural traits that are being measured when investigating personality among animals is sociability, activity, exploration, aggression and boldness (Armitage, 1986; Reale et al., 2007; Sih et al., 2004).
Many studies on the subject of animal personalities have shown that animals, over various taxa, do possess individual differences in behaviour. But the studies have mainly been performed on vertebrates, such as primates and other domesti-cated animals (Gosling, 2001; Gosling and John, 1999). In recent years however differences in behaviour among individuals has also been found among
10
brates and primarily among various kinds of crickets (Fisher et al., 2018; Niemela et al., 2012, 2012; Royaute and Dochtermann, 2017).
These variations in behaviour, among individuals in a population, have re-mained throughout the ages. Even though it might be expected that natural selec-tion would point behavioural traits into a more homogenic direcselec-tion, resulting in one optimal behaviour for a given environment (Sih et al., 2004). The studies per-formed on crickets have had as purpose to try and explain why these differences personalities exist in a population. The phenomenon of different behaviours has been explained by various theories such as pace-of-life syndrome, residual repro-ductive value (RRV), or based on the nutritional value of the individual’s diet (Fisher et al., 2018; Niemela et al., 2012; Royaute and Dochtermann, 2017).
The pace-of-life syndrome (POLS) is a theory that divides individuals in popu-lations into two categories based on a slow or fast pace of life. Where “slow” indi-viduals display a slow growth rate, they reach sexual maturity later in life and they also live longer. The individuals displaying the “fast” pace-of-life behave in the exact opposite way, they grow faster, reach sexual maturity earlier and have short-er lives. These two categories have been pared with diffshort-erent behavioural traits where the “fast” category is considered bolder and more exploratory whereas the “slow” category is more cautious. This theory however has only partly proved to be a reasonable explanation for differences in personalities. For example, there is a correlation between a short life and the inclination to show bold and exploratory behavioural traits (Fisher et al., 2018), but in general studies that support the theo-ry of POLS are few (Royaute et al., 2018)
The theory of residual reproductive value, or RRV, predicts that an individuals expected future fitness correlates with its personality (Wolf et al., 2007). When discussing the trade-of between RRV and a risky behaviour it is often referred to as the asset protection principle. The asset protection principle predicts that older individuals, that have already reproduced, should show of a bolder behaviour than younger individuals that would suffer a greater reproductive cost if they were killed or injured. They would therefore be more cautious (Clark, 1994). This theo-ry have gained some support (Moschilla et al., 2018) but in other studies it has been dismissed (Fisher et al., 2018). However the variable that seem to have the strongest link to personalities among crickets is age, where it has been shown that behavioural patterns change over time (Fisher et al., 2018; Niemela et al., 2012). Age can be paired with both RRV and POLS but since these theories have little support, it might be something else causing this change in behaviour.
The theories used to try explain different personalities are mostly associated with phenotypic or genetic variations. But one aspect that haven’t gained much attention in the study of personalities and behaviour among animals is ontogeny and how the transition between life stages affect the behaviour of an individual
(Stamps and Groothuis, 2010). Many things changes when an individual develop from juvenile to adult, for example their hormone levels change (Zera et al., 2007) and they might experience different levels of predation (Dangles et al., 2007).
And what about the experiences of the individual? Episodes that take place over the course of an individual’s lifetime is likely to leave a mark, shaping the behaviour of that individual. Fearful or anxious individuals might for instance have gone through traumatic events as juveniles. It is also likely that experience would cause behavioural traits to change throughout ontogeny and adults and ju-veniles would experience the environment in different ways. Behavioural patterns should change, when behaviours that worked well in a juvenile stage is not suita-ble in the adult stage (Sih et al., 2004). Not only does experience effect an individ-ual’s personality but personality has also been proved to effect learning (Sih et al., 2004) and boldness, or an animals willingness to expose itself to risks (Reale et al., 2007; Ward et al., 2004), has been linked to a greater ability to learn (Wilson and Stevens, 2005).
That crickets are capable of learning is not new. Several studies have found that crickets are capable of olfactory learning (Mallory et al., 2016; Matsumoto and Mizunami, 2005), it has also been seen that grasshoppers (close relative to crick-ets) are able learn to associate visual cues with dietary assets (Raubenheimer and Tucker, 1997). Therefore, it would make sense if experiences will also shape the individual’s behaviour. A prediction that experiences formed early in the devel-opment of an organism might change its personality (Sih et al., 2004) is in line with what recent studies in insects have found (Fisher et al., 2018; Niemela et al., 2012).
The aim of this study was to determine if a change in behaviour over an indi-vidual’s lifetime depends on a learning process (that the crickets habituate to the experiment) or if the change will take place even without repeated test trails (due to changes in age, or transition between life stages). As a study animal I used the House cricket Acheta domesticus. The study will be carried out testing 2 groups of crickets on the personality trait boldness. One group will be tested one time at the beginning of the experiment and one time at the end. The other group will have test trials preformed on them multiple times over the course of the experiment. Both groups will be from the same origin and in the same age.
12
1.1 Study individuals
The crickets used in this study are descendants from wild populations, but for the last couple of generations they have ben reared in captivity. To reduce bias caused by genetic homogeneity, the crickets where taken from 5 different family-lines all born between 2/1-19 and 2/2-19. This made them 14-10 weeks old at the start of the experiment. The crickets where kept in plastic containers (length 300 mm * width 240 mm * height 150 mm) and placed in a room at a constant temper-ature of 30°Cand a humidity of 40%. Crickets where feed ad libitum food (poultry pellets) and provided with salt stones. To distinguish the individuals from each other, each cricket was labelled with a unique colour cod on its neck shield. The experiment went on for 16 days and during this time the crickets, that started out as juveniles, reached adulthood.
1.2 Behavioural trials
At the beginning of the experiment crickets where divided into two groups, one test group and one control group. Both the test group and the control group went through behavioural trails to test their willingness to emerge into a novel environ-ment, with the difference that the control group where tested once at the start of the experiment and once at the end. While the test group was tested multiple times. The two groups where kept in separate containers, each containing 30 crickets. Initially the test population consisted of 30 individuals but due to mortality the population decreased over time, with 15 crickets remaining at the last trial (T1: n = 30 , T2: n = 25, T3: n = 23, T4: n = 21, T5: n = 19, T6: n = 18, T7: n = 18, T8: n = 16, T9: n = 15). The control population also consisted of 30 individuals at the start of the experiment, but like the test population it decreased. At the end 17 crickets
remained (T1 n = 30, T2 n = 17). Trials were performed on crickets belonging to the test population once every other day, with a total of 9 trails. The crickets that belonged to the control group where tested once at the start of the experiment and once at the end. The total length of the testing period where 16 days for both groups.
Test trails began with one cricket being put into a tube (70 * 20 mm), which was then sealed with two wads of cotton at each end. The tube where placed hori-zontally in the experimental arena, a plastic container (length 180 mm * width 180 mm * height 100 mm). After a 2 min acclimation period the wads were carefully removed.
Behavioural and time data were collected by registering the time it took for a cricket to emerge from the tube. Emergence time was set as when the entire body of the cricket was outside the tube. Test trails went on for a maximum of 600 s. From the data the individual got a corresponding score between 1 and 600. A cricket that did not emerge from the tube within the time limit was registered as a missing observation. The time it took for a cricket to first show itself outside the tube, without having fully exited it, was also recorded.
1.3 Statistical method
Data analysis were done in R 3.4.3. A generalized linear mixed-effects model was used to examine the data. I analysed whether sex of the cricket, if the cricket belonged to the test- or the control group, or the time that the cricket was tested had any effect on its time of first appearance and its emergence time.
14
In total 60 crickets were tested,and 228 behaviour trails preformed. The general-ized linear mixed-effects model showed that there was a significant difference in emergence time between test trails, the emergence time was faster with trials (p < 0,001). Whether the crickets belonged to the test- or control population also had a significant effect on the emergence time (p < 0,05). The mean value of emerge time changed from 34,3 s to 13,4 s from the first to last trail for the test population (table 1). This is a decreased emergence time of 20,9 s at the end of the experi-ment. The control population changed their emergence time from 14,48 s to 12,64 s in average, which gave them a decreased emerge time of 1,84 s (table1). Be-tween males and females no significant difference could be found (p > 0,05).
Table 1. Mean value of the time it took for the cricket to fully leave the tube from trial 1 to trial 9. Mean 1 2 3 4 5 6 7 8 9 Test 34,3 44,31 61,17 51,33 13,61 15,67 6,56 3,467 13,4 Control 14,48 - - - - - - - 12,64
The measurement of the time it took for crickets to first appear outside the tube show a similar pattern as the results for when the crickets emerge fully for the test population. Looking at the time spent in the tube with trials, the time spent hiding in the tube for the first two trails dropped with 9,34 s. Both values do however reach its peak at the third trial. The time it took for the test population to look out-side the tube changed from 26,16 s to 6,12 s over the trials (table 2). This change with number of trials was significant (p<.001). The control population changed their time for first appearance outside from 11,4 s to 5,1 s giving them a decrease
of waiting time with 6,3 s. The result was also significant (p > 0.001). A cricket that had a first appearance time and an emergence time that differed less than a second was considered to leave the tube instantaneously. The share of crickets that did not leave the tube instantaneously differed between the groups and can be seen in figure 3. In the control population the proportion changed from 56,6% to 33,3% while the proportion changed from 46,6% to 58,8% in the control population.
Table 2. Mean value for time it took for the cricket to first emerge from tube from trial 1 to trial 9. Mean 1 2 3 4 5 6 7 8 9 Test 26,16 16,82 26,65 19,71 4,66 5,72 2,94 1,93 6,12 Control 11,4 - - - - - - - 5,1
16
This study examined the variation in behaviour and the effect that repeated be-havioural trails had on the House crickets Acheta domesticus. An assumption was that repeated trails would cause the crickets to learn the test and act different than crickets that had not gone through repeated trails. The personality trait tested were boldness, which was tested by measuring a cricket’s willingness to leave a tube and exit into a novel environment. The variables that proved to have a significant effect on the emergence time was how many test trials the individual had experi-enced and if the crickets belonged to the test group or the control group. The sex of a cricked did not have a significant effect on the emergence time.
The fact that crickets who went through behaviour trails multiple times showed a greater reduction in in emergence time than crickets that were only tested at the beginning and at the end indicates that there might be a learning process going on. The test population shortened their time spent in the tube with 20,9 seconds whereas the control population only shortened their time with 1,84 seconds. This combined with the fact that the group that a cricket belonged to, proved to have a significant effect on emergence time suggests that there´s probably no difference between the first and the last trail for the control population. This indicates that crickets belonging to the control population had a constant behaviour throughout the experimented. But sense I´ve worked whit mean values I can´t be certain that each cricket displays the same personality at the last trail as they did at the first. It can however be said that the differences between individuals seem to be the same and the between-individual difference have thereby remained in the group. One part of the POLS theory say that bolder individuals live less long (Fisher et al., 2018). Applying this assumption to this study would mean that the crickets that did die during the experiment should have been the crickets that displayed a bold personality. Additionally, the crickets that remained at the end of the experiment should be the more cautious ones. However, my results indicate that the crickets are bolder at the last trail than the first. This might mean that the crickets remain-ing at the last trail is the ones that started out as cautious, but they have learned the
18
procedure of the trails and thereby become bolder. If this difference did not de-pend on learning the same pattern should have been seen in the control group.
However, this might all be a coincidence. In the wild bolder individuals are en-countered more often and expose themselves for greater risks (Merrick and Koprowski, 2017). It therefore makes sense that these individuals would die before the cautious crickets. My experiment where preformed in a laboratory environ-ment where the presence of predators is lacking, and it does not make sense that bold individuals would die. Could it be so that in a laboratory environment the cautious crickets die first? If there’s a correlation between being bold and being aggressive it might be that bold individuals attack (or interact aggressively) with cautious crickets causing them to die first. But since the deaths of the crickets have not been observed directly this is hard to know. The correlation between boldness an aggressiveness would be interesting to study further.
Looking at the share of the individuals that did not emerge from the tube in-stantaneously it can be seen that the test population have a higher share of individ-uals that starts emerging from the tube slowly before exiting completely in the first trail than in the last. Whereas the control population display the opposite pattern. It is thereby a higher share of crickets that inspect the new environment before exit-ing into it in the control population. While crickets in the test population exit into the arena without examining it as much. This indicates that the test population might already be aware of what is waiting for them outside the tube and it is there-by not necessary for them to examine the environment before exiting. While an individual from control population who haven not gained the same experience experiences that it exposes itself for a greater risk when exiting into the environ-ment.
On the other hand, the results can be looked at in another way. If we only look at the emergence time that the crickets demonstrated at the last trail it can be seen that the control group had an emergence time of 12,6 s and the test group one of 13,3 s. If only these values where compered it would look like the control group actually did better than the test group. At the start of the experiment the control group almost had a half as long emergence time as the test group did (34,3 s versus 14,5). This means that the control group couldn’t decrease their emergence time as much as the test group. Further, the results in emergence time for the test group show that the time it took for a cricket to leave the tube increased for the first two test trials. That the result for the first trial where lower than the following trails may be due to crickets expressing a panic behaviour, where they leave the tube very quickly trying to escape the situation. This may also be the case fort the con-trol group and if there where more panic behaviour expressed in the concon-trol group that would explain why the two groups has such a huge difference in emergence time at the start of the experiment. Considering this, that might mean that the two
gropes should have had the same emergence time to begin with. If this is the case, the groups should have had the same emergence time at the start of the experiment and they almost have the same emergence time at the end of the experiment. Re-sulting in there being no difference between the test group and the control group. The change in behaviour could therefore be something that would have happened even without the repeated trails. In that case the change might have more to do with the transition from juvenile to adult.
Results from this study suggest that there might be a correlation between re-peated test trails and learning. However, it was not possible to follow a cricket’s development during the entire experiment. The unique colour codes made it possi-ble to follow some of the individuals, while others id was lost due to moulting. It was therefore not possible to tell all individuals apart. The lost also made it impos-sible to know which of the crickets that died. Fore future studies it would be useful if the test populations were bigger, to make up for the loss and to get more infor-mation. To solve the problem whit not being able to tell the crickets apart one could keep them individually separated or only to work with adults. It is also pos-sible that the crickets experience the test trails as a stressful situation, and it may therefore be interesting to examine the level stress hormones in the crickets to see if this can have anything to with boldness. To test if the crickets actually learned the test rather than become bolder for some other reason one could test boldness in some other way and see if the effect remains.
In conclusion there is a difference between the groups that could be explained whit learning occurring. But this difference could also be explained with bold crickets causing the death of the more cautious crickets, or simply that a panic behaviour expressed by the crickets gave a misleading result. To determent what the actual reason was more research is needed.
20
Armitage, K., 1986. Individuality, Social-Behavior, and Reproductive Success in Yellow-Bellied Marmots. Ecology 67, 1186–1193. https://doi.org/10.2307/1938674
Clark, C., 1994. Antipredator Behavior and the Asset-Protection Principle. Behav. Ecol. 5, 159–170. https://doi.org/10.1093/beheco/5.2.159
Dangles, O., Pierre, D., Christides, J.P., Casas, J., 2007. Escape performance decreases during ontog-eny in wild crickets. J. Exp. Biol. 210, 3165–3170. https://doi.org/10.1242/jeb.004648 Fisher, D.N., David, M., Rodriguez-Munoz, R., Tregenza, T., 2018. Lifespan and age, but not
residu-al reproductive vresidu-alue or condition, are related to behaviour in wild field crickets. Ethology 124, 338–346. https://doi.org/10.1111/eth.12735
Gosling, S.D., 2001. From mice to men: What can we learn about personality from animal research? Psychol. Bull. 127, 45–86. https://doi.org/10.1037/0033-2909.127.1.45
Gosling, S.D., John, O.P., 1999. Personality dimensions in nonhuman animals: A cross-species review. Curr. Dir. Psychol. 8, 69–75. https://doi.org/10.1111/1467-8721.00017 Mallory, H.S., Howard, A.F., Weiss, M.R., 2016. Timing of Environmental Enrichment Affects
Memory in the House Cricket, Acheta domesticus. PLoS One 11, e0152245. https://doi.org/10.1371/journal.pone.0152245
Matsumoto, Y., Mizunami, M., 2005. Formation of long-term olfactory memory in the cricket Gryl-lus bimaculatus. Chem. Senses 30, I299-i300. https://doi.org/10.1093/chemse/bjh233 Merrick, M.J., Koprowski, J.L., 2017. Should we consider individual behavior differences in applied
wildlife conservation studies? Biol. Conserv. 209, 34–44. https://doi.org/10.1016/j.biocon.2017.01.021
Moschilla, J.A., Tomkins, J.L., Simmons, L.W., 2018. State-dependent changes in risk-taking behav-iour as a result of age and residual reproductive value. Anim. Behav. 142, 95–100. https://doi.org/10.1016/j.anbehav.2018.06.011
Niemela, P.T., Vainikka, A., Hedrick, A.V., Kortet, R., 2012. Integrating behaviour with life history: boldness of the field cricket, Gryllus integer, during ontogeny. Funct. Ecol. 26, 450–456. https://doi.org/10.1111/j.1365-2435.2011.01939.x
Raubenheimer, D., Tucker, D., 1997. Associative learning by locusts: pairing of visual cues with consumption of protein and carbohydrate. Anim. Behav. 54, 1449–1459.
https://doi.org/10.1006/anbe.1997.0542
Reale, D., Dingemanse, N.J., Kazem, A.J.N., Wright, J., 2010. Evolutionary and ecological ap-proaches to the study of personality. Philos. Trans. R. Soc. B-Biol. Sci. 365, 3937–3946. https://doi.org/10.1098/rstb.2010.0222
Reale, D., Reader, S.M., Sol, D., McDougall, P.T., Dingemanse, N.J., 2007. Integrating animal tem-perament within ecology and evolution. Biol. Rev. 82, 291–318.
https://doi.org/10.1111/j.1469-185X.2007.00010.x
Royaute, R., Berdal, M.A., Garrison, C.R., Dochtermann, N.A., 2018. Paceless life? A meta-analysis of the pace-of-life syndrome hypothesis. Behav. Ecol. Sociobiol. 72, UNSP 64.
https://doi.org/10.1007/s00265-018-2472-z
Royaute, R., Dochtermann, N.A., 2017. When the mean no longer matters: developmental diet af-fects behavioral variation but not population averages in the house cricket (Acheta domes-ticus). Behav. Ecol. 28, 337–345. https://doi.org/10.1093/beheco/arw164
Sih, A., Bell, A.M., Johnson, J.C., Ziemba, R.E., 2004. Behavioral syndromes: An integrative over-view. Q. Rev. Biol. 79, 241–277. https://doi.org/10.1086/422893
Stamps, J., Groothuis, T.G.G., 2010. The development of animal personality: relevance, concepts and perspectives. Biol. Rev. 85, 301–325.
https://doi.org/10.1111/j.1469-185X.2009.00103.x
Ward, A.J.W., Thomas, P., Hart, P.J.B., Krause, J., 2004. Correlates of boldness in three-spined sticklebacks (Gasterosteus aculeatus). Behav. Ecol. Sociobiol. 55, 561–568.
https://doi.org/10.1007/s00265-003-0751-8
Wilson, A.D.M., Stevens, E.D., 2005. Consistency in context-specific measures of shyness and boldness in rainbow trout, Oncorhynchus mykiss. Ethology 111, 849–862.
https://doi.org/10.1111/j.1439-0310.2005.01110.x
Wolf, M., van Doorn, G.S., Leimar, O., Weissing, F.J., 2007. Life-history trade-offs favour the evo-lution of animal personalities. Nature 447, 581–584. https://doi.org/10.1038/nature05835
22
I would like to thank my supervisor Åsa Berggren for guiding me through the process of writing this paper and for always being supportive of my ides.
I would also like to thank John who kept me company all those hours in the basement.
And last, I want to thank my crickets for being cooperative almost all of the time and not escaping nearly as often as they could have.
Here follow all the tables with the individual values for each cricket.
Table 3. Number of seconds it took for the crickets in the test group to leave the tube.
Cricket test 1 test 2 test 3 test 4 test 5 test 6 test 7 test 8 test 9 1 1 89 2 1 23 2 7 1 76 2 3 5 54 20 1 9 6 1 3 3 1 351 217 600< 87 1 3 11 2 4 7 1 437 1 1 12 6 600< 1 5 17 276 1 1 1 9 9 3 2 6 1 9 114 196 1 30 6 3 1 7 134 32 1 1 1 174 35 1 1 8 8 27 1 1 29 1 17 1 1 9 126 94 115 3 2 1 1 2 91 10 50 11 1 510 18 2 1 7 1 11 5 10 1 13 600< 8 11 1 2 12 91 1 129 167 1 1 3 3 1 13 1 1 14 6 15 13 1 1 17 14 180 1 1 3 3 7 1 1 1 15 2 1 110 18 30 2 5 15 1 16 2 3 1 102 2 7 1 1 - 17 7 6 14 1 19 2 2 - - 18 3 11 58 8 7 1 3 - - 19 6 1 26 24 4 - - - - 20 11 1 1 1 - - - - - 21 1 4 106 1 - -- - - - 22 17 1 2 - - - - - - 23 1 83 1 - - - - - - 24 1 600< - - - - 25 14 600< - - - - 26 1 - - - - 27 1 - - - - 28 230 - - - - 29 90 - - - - 30 17 - - - -
Appendix 1
24
Table 4. Number of seconds it took for the crickets in the control group to leave the tube. Cricket test 1 test 9
1 6 96 2 8 16 3 4 1 4 51 6 5 2 1 6 9 3 7 20 3 8 1 1 9 8 5 10 1 2 11 1 29 12 1 11 13 88 36 14 1 1 15 5 1 16 13 2 17 1 1 18 1 - 19 1 - 20 27 - 21 1 - 22 27 - 23 7 - 24 1 - 25 4 - 26 126 - 27 1 - 28 >600 - 29 2 - 30 2 -
Table 5. Number of seconds it took for the crickets to leave the tube for the crickets that I was able to
follow.
Cricket test 1 test 2 test 3 test 4 test 5 test 6 test 7 test 8 test 9 1 1 89 14 167 600 - - - -
Cricket test 1 test 2 test 3 test 4 test 5 test 6 test 7 test 8 test 9 2 3 5 58 600 - - - - - 3 1 351 1 102 19 - - - - 4 7 - - - - - - - - 5 17 1 14 6 - - - - - 6 1 276 - - - - - - -7 134 - - - - - - - - 8 8 9 26 - - - - - - 9 126 - - - - - - - - 10 50 32 - - - - - - -11 5 27 - - - - - - -12 91 94 129 1 - - - - -19 1 11 377 - - - - - - 20 180 10 - - - - - - -21 2 1 2 3 - - - - -22 2 1 1 24 - - - - -23 7 1 - - - - - - -24 3 1 1 1 1 - - - - 25 6 - - - - - - - - 32 11 - - - - - - - - 33 1 3 1 1 - - - - - 34 17 6 114 - - - - - - 35 1 11 217 - - - - - - 36 1 1 1 18 - - - - - 37 14 - - - - - - - - 38 1 4 1 8 1 1 1 1 1 39 1 1 110 1 7 40 230 83 1 196 - - - - - 41 90 600< - - - - - - -42 17 600< - - - - - - -ad 5 - - - 3 1 9 35 1 1 ad 6 - - - 13 15 2 6 1 1 ad 7 - - - 88 87 8 11 11 17 ad 8 - - - - 4 1 3 1 1 ad 9 - - - - - 9 17 600 1 ad 10 - - - - - 30 3 3 1 ad 11 - - - - - 1 3 1 2 ad 12 - - - - - 13 8 1 3 ad 13 - - - - - 7 7 2 2 ad 14 - - - - - 7 1 3 ad 15 - - 106 20 2 2 1 1 1
26
Cricket test 1 test 2 test 3 test 4 test 5 test 6 test 7 test 8 test 9 ad 16 - - 2 1 23 12 1 7 76
Table 6. Number of seconds it took for female crickets to leave the tube.
Cricket test 1 test 2 test 3 test 4 test 5 test 6 test 7 test 8 test 9 2 3 5 58 600< - - - - - 6 1 276 - - - - - - -7 134 - - - - - - - - 8 8 9 26 - - - - - - 9 126 - - - - - - - - 19 1 11 377 - - - - - - 24 3 1 1 1 1 - - - - 20 180 10 - - - - - - -32 11 - - - - - - - - 33 1 3 1 1 - - - - - 37 14 - - - - - - - - 38 1 4 1 8 1 1 1 1 1 39 1 1 110 1 7 - - - - 40 230 83 1 196 - - - - - ad 5 - - - 3 1 9 35 1 1 ad 7 - - - 88 87 8 11 11 17 ad 9 - - - - - 9 17 600< 1 Ad 16 - - 2 1 23 12 1 7 76 un - 1 1 1 1 1 1 - - Un - - 1 510 30 - - - - Un - - 54 1 - - - - - ad 8 - - - - 4 1 3 1 1 An 11 - - - - - - - 1 2
Table 7. Number of seconds it took for male crickets to leave the tube.
Cricket test 1 test 2 test 3 test 4 test 5 test 6 test 7 test 8 test 9 1 1 89 14 167 600< - - - - 3 1 351 1 102 19 - - - - 4 7 - - - - - - - - 5 17 1 14 6 - - - - - 10 50 32 - - - - - - -11 5 27 - - - - - -
-Cricket test 1 test 2 test 3 test 4 test 5 test 6 test 7 test 8 test 9 12 91 94 129 1 - - - - - 21 2 1 2 3 3 - - - - 22 2 1 1 24 - - - - - 23 7 1 - - - - - - -25 6 . - - - - - - -34 17 6 114 - - - - - -35 1 11 217 - - - - - -36 1 1 1 18 - - - - - 41 90 600< . - - - - - - 42 17 600< . - - - - - - ad 6 - - - 13 15 2 6 1 1 Un - - 1 1 1 2 6 3 1 Un - - - - 1 174 9 1 91 Un - - - - 2 2 1 15 - Un - - - - 18 1 5 - - un - - - - 29 - - - - ad15 - - 106 20 2 2 1 1 1 ad 10 - - - - - 30 3 3 1 ad 11 - - - - - 1 3 1 2 ad 12 - - - - - 13 8 1 3 ad 13 - - - - - 7 7 2 2 ad 14 - - - - - 7 1 3