ENERGY EFFICIENCY IN
COMMERCIAL
BUILDINGS IN SOUTH AFRICA
A study of interior ceiling temperature distribution and measures to decrease
the cooling demand in buildings in Pretoria, South Africa
ASTRID GÖTHBERG
JOSEPHINE TASEVSKI
School of Business, Society and Engineering
Course: Degree Project in Industrial Engineering
and Management with Specialization in Energy Engineering
Course code: ERA402 Credits: 30 hp
Program: M.Sc. in Industrial Engineering and
Management
Supervisor: Pietro Elia Campana, Mälardalen
University and Paul Sonnendecker, University of Pretoria
Examiner: Monica Odlare, Mälardalen University External partner: University of Pretoria
Costumer: Mälardalen University Date: 2020-06-04
Email: agg15004@student.mdh.se
ABSTRACT
This study aims to investigate opportunities to make commercial buildings in Pretoria, South Africa, more energy efficient, which is made by examining prerequisites in South Africa. To achieve this objective, barriers and measures to decrease cooling demand are investigated by a qualitative approach and a roof heat transfer model is developed to get a deeper
understanding of the ceiling temperature distribution. The heat transfer model is simulated in MATLAB and is further validated by conducting a two-case scenario sensitivity analysis and by comparing the results to previous research. The results show that there is a great correlation between the Global Horizontal Irradiance [GHI] and the interior ceiling
temperature and a higher GHI contributes to a higher ceiling temperature. The hot climate and the long summer period in South Africa indicate that there is a great demand for cooling during a year. Regarding barriers, the socioeconomic aspects in the country and the low electricity prices may contribute to less willingness to adapt to an environmentally friendly behaviour. As some technologies are still perceived as expensive, this may also provide a lower willingness to make changes regarding choices that contribute to a lower cooling demand and thus, energy consumption. Finally, it is concluded that there are several
measures that can be applied to decrease the cooling demand, such as constructional changes or enhancement of the heating, ventilation and air-conditioning [HVAC] operation.
Keywords: Ceiling temperature, Commercial buildings, Cooling demand, Energy efficiency, Heat transfer model, Mathematical modelling, Solar radiation, South Africa
PREFACE
This study is a degree project in Industrial Engineering and Management with Specialization in Energy Engineering at Mälardalen University in Västerås, written by Astrid Göthberg and Josephine Tasevski during the spring semester 2020. The study has been conducted in cooperation with Mälardalen University and University of Pretoria and we would like to begin to thank the Linnaeus-Palme institute and Mälardalen University for the financial aid, which enabled this project. We would also like to express our gratitude to our supervisors Pietro Elia Campana, Associate Senior Lecturer at Mälardalen University, and Paul
Sonnendecker, Researcher at Department of Chemical Engineering at University of Pretoria, for their guidance and support during this period.
Finally, we would like to thank Professor Philip De Vaal, head of Department of Chemical Engineering at University of Pretoria as well as the rest of the Department of Chemical Engineering at University of Pretoria for making us feel at home in South Africa and further support during the studies abroad. A great thanks is also directed towards Fredrik Berggren, International Liaison Officer at Mälardalen University, for supporting us with inquiries regarding the abroad exchange.
Västerås in June 2020
SUMMARY
As the world’s energy consumption is increasing, the importance of sustainability is greater than ever. The building sector is a major source to the energy consumption and in South Africa, buildings are not generally built with a great concern for energy efficiency, which contributes to an extensive demand for heating, ventilation and air-conditioning (HVAC) due to the hot climate in the country. Previous studies demonstrate that there are several
solutions and measures to decrease the demand for cooling, but due to the special prerequisites in South Africa there is a need for further investigation in the subject. This study is the first part of a bigger project at University of Pretoria that aims to investigate different solutions to decrease the cooling demand in commercial buildings in South Africa. To achieve this objective, barriers and measures to decrease cooling demand are assessed by conducting a literature study. Further, in order to attain a deeper understanding of the ceiling temperature distribution, a heat transfer model is developed which is illustrating how the ceiling temperature is affected by solar radiation and outside air temperature for an exposed roof of a typical commercial building in Pretoria, South Africa. The model is
validated by a two-scenarios sensitivity analysis, with the addition of solar panels directly on the roof as well as addition of insulation to the model, and by comparison to previous
research. The model is simulated in MATLAB with a timestep of 600 seconds has been applied.
The results show that the roof temperature peaks during the day when the solar radiation also is peaking. Due to the absence of solar radiation during the night, the roof temperature reaches its minimum level then. It can also be concluded that the roof temperature varies a lot during a day. The ceiling temperature peak is delayed compared to the roof temperature, since there is some time required for the heat to transfer through the roof. Further, it is also clear that the level of Global Horizontal Irradiance [GHI]has a significant impact on the interior ceiling temperature.
The greatest barriers explored in this study for implementing environmentally friendly
energy measures in South Africa are the low electricity prices and the extensive segregation in the country. The low electricity prices may contribute to an unwillingness to make changes regarding choice of energy sources but increasing the prices would probably mainly cause drawbacks to the poor people in the country, which is not in line with the country’s development goals. From the analysis of the applicable measures to decrease cooling demand, it can be concluded that there are several suitable solutions for the climate in
Pretoria, e.g. passive solar design, constructional and design changes as well as implementing enhanced, customized HVAC utilization. These solutions can be differently hard to
implement with regards to several aspects such as financial and socio-economical aspects as well as the level of knowledge required to implement them.
TABLE OF CONTENT
1 INTRODUCTION ... 1
1.1 Background ... 1
1.1.1 Buildings and energy efficiency ... 2
1.1.2 Building energy demand reduction ... 4
1.1.3 Process modelling ... 4 1.2 Problem definition ... 4 1.3 Purpose ... 5 1.4 Research questions ... 5 1.5 Delimitations ... 5 2 METHOD ... 7 2.1 Choice of method ... 7
2.2 Data collection and analysis... 7
2.2.1 Primary data ... 7
2.2.1.1. Setbacks for primary data collection ... 8
2.2.2 Secondary data ... 8
2.3 Modelling and simulation ... 9
2.4 Method discussion ... 9
3 LITERATURE REVIEW ... 11
3.1 Prerequisites in South Africa ... 11
3.1.1 Energy and electricity... 11
3.1.2 Economic situation ... 12
3.1.3 Technological development ... 13
3.2 Building construction and design ... 13
3.2.1 Construction material ... 14
3.2.2 Passive solar design ... 14
3.2.3 Insulation ... 16
3.3 HVAC operation... 16
3.4 Solar panels ... 18
3.5 Heat transfer ... 20
3.5.1 Conduction ... 21
3.5.2 Forward in time and central in space... 21
3.5.3 Convection ... 22
3.5.3.1. The convection coefficient ... 22
3.5.3.2. The external convection coefficient ... 22
3.5.3.3. The internal convection coefficient ... 23
3.5.4 Radiation ... 23
4 CURRENT STUDY ... 24
4.1 Modelling... 24
4.1.1 Weather depending variables ... 25
4.1.1.1. Sine curve approximation of the GHI ... 25
4.1.1.2. Sine curve approximation of the outside air temperature ... 28
4.1.1.3. External convection coefficient ... 31
4.1.2 The heat transfer model ... 32
4.1.2.1. Node 2 - Heat transfer through the external side of the roof ... 33
4.1.2.2. Internal nodes - Heat transfer between the different materials ... 34
4.1.2.3. Internal nodes - Heat transfer within the same material ... 34
4.1.2.4. Node n-1 – The interior ceiling ... 35
4.1.2.5. Node n – 2 cm from the ceiling ... 35
4.2 Sensitivity analysis ... 35
4.2.1 Scenario B – Solar panels ... 35
4.2.2 Scenario C - Insulation... 36
4.3 Temperature measurements... 36
4.3.1 Experimental farm ... 37
4.3.2 Engineering II ... 38
5 RESULTS ... 39
5.1 Heat transfer model ... 39
5.2 Sensitivity analysis ... 43
6 DISCUSSION ... 50
6.1 Yearly ceiling temperature distribution ... 50
6.1.1 Impact of exterior climate conditions ... 51
6.1.2 Validation and reliability of the heat transfer model ... 51
6.1.2.1. Sensitivity analysis ... 52
6.2 Barriers for making buildings more energy efficient ... 53
6.3 Measures to decrease energy demand from cooling ... 55
6.3.1 Passive solar technology ... 55
6.3.2 Construction material and insulation ... 56
6.3.3 Thermostat strategies ... 56
6.3.4 General discussion ... 57
7 CONCLUSIONS ... 58
8 SUGGESTIONS FOR FUTURE WORK ... 60
REFERENCES ... 61
APPENDIX 1: MATLAB CODE FOR SCENARIO A – THE EXPOSED ROOF ... 69
APPENDIX 2: MATLAB CODE FOR SCENARIO B – ADDITION OF A FLAT PV ARRAY TO SCENARIO A ... 76
APPENDIX 3: MATLAB CODE FOR SCENARIO C – ADDITION OF 20 CM INSULATION TO SCENARIO A ... 83
LIST OF FIGURES
Figure 1 - Total primary energy supply in South Africa by source, 1990-2017. ... 2
Figure 2 - Total final energy consumption in South Africa by sector, 1990-2017. ... 3
Figure 3 - A typical commercial building in South Africa ... 3
Figure 4 - Rand per US Dollar during 2015 ... 12
Figure 5 – Ceiling temperatures for the three different cases ... 20
Figure 6 - Roof thermal model ... 20
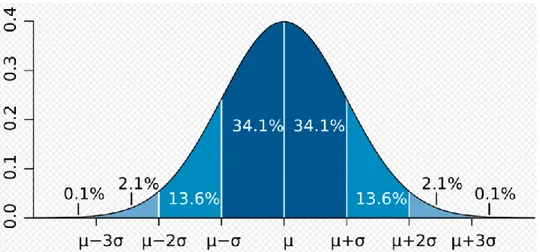
Figure 7 – A plot of normal distribution ... 26
Figure 8 – Illustration of the nodal distribution of the roof ... 33
Figure 9 – A small-scale version of a typical roof of a South African residential building ... 37
Figure 10 - Marley monarch tile specification in millimetres ... 37
Figure 11 - Sensor placement at experimental farm ... 38
Figure 12 – Measured monthly outside air temperature and GHI distribution in Pretoria, South Africa ... 39
Figure 13 –Temperature distribution during the summer in Pretoria ... 40
Figure 14 –Temperature distribution during the autumn in Pretoria ... 40
Figure 15 –Temperature distribution during the winter in Pretoria ...41
Figure 16 –Temperature distribution during the spring in Pretoria ...41
Figure 17 –A comparison of the interior ceiling temperature when decreasing the GHI... 43
Figure 18 – Simulated temperature distribution for the exposed roof ... 44
Figure 19 – Simulated temperature distribution for the roof with solar panels... 44
Figure 20 – Simulated temperature distribution for the roof with a 20 cm thick insulation . 45 Figure 21 – Simulated temperature distribution of the ceiling for a year ... 46
Figure 22 – GHI and outside air temperature during 27/2 and 24/3-2020 ... 47
Figure 23 – Measured ceiling and roof temperature at Experimental farm during the 27th of February to the 24th of March ... 48
LIST OF TABLES
Table 1 -Building measures for Engineering II ... 25
Table 2 - Material properties for Engineering II... 25
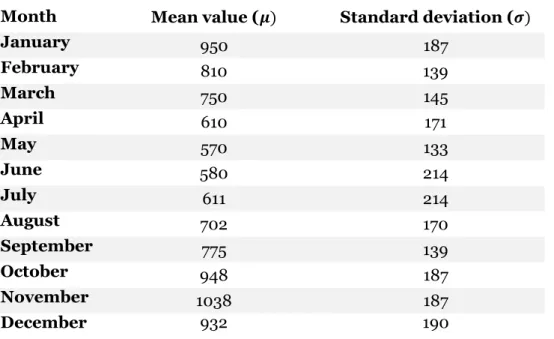
Table 3 - Input values to model the GHI distribution ... 27
Table 4 - Validation of the simulated average GHI for a year ... 27
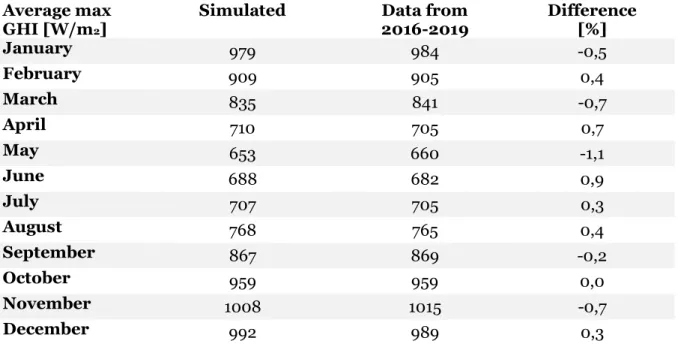
Table 5 - Validation of the simulated average maximum GHI for a year ... 28
Table 6 - Input values to model the temperature distribution ... 28
Table 7 - Validation of the simulated average temperature for a year ... 29
Table 8 - Validation of the simulated maximum average temperature for a year ... 29
Table 9 - Validation of the simulated minimum average temperature for a year ... 30
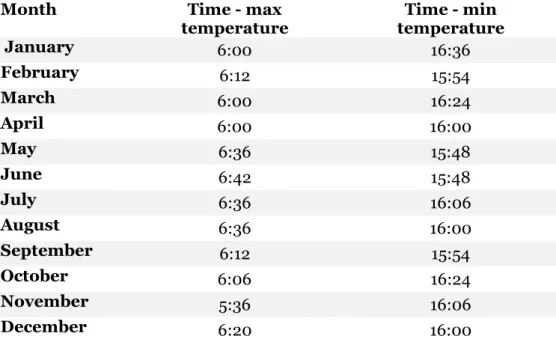
Table 10 – Summary of when the maximum and minimum temperature of the outside air occur during the year ... 30
Table 11 - Thermophysical properties of air at atmospheric pressure ... 32
Table 12 - Limitations of FTCS method ... 34
Table 13 – Approximated material properties for a solar panel ... 36
Table 14 - Material properties for glass fibre insulation ... 36
Table 15 – Temperature of the external side of the roof ... 42
Table 16 – Temperature of the ceiling ... 42
Table 17 – A comparison of the ceiling temperatures for Scenario A and B in December ... 46
Table 18 – A comparison of the ceiling temperatures for Scenario A and C in December ... 46
Table 19 - Comparison of the average GHI and temperature for March between 2016 and 2020 ... 47
NOMENCLATURE
Symbol Description Unit
A Area m2
C Constant when calculating Nusselt
number - Cp Specific heat kJ/kg, K d Number of days - dt Time step s dx Nodal distance m E Energy J Fo Fourier’s number - H Height m h Convection coefficient W/m2, K i Nodal number -
Ig Total horizontal radiance W/m2
k Thermal conductivity W/m, K
L Length m
m Constant when calculating Nusselt
number -
n Time step number -
Nu Nusselt number -
p Constant when calculating Nusselt
number - Pr Prandtl number - Q Heat W Re Reynold’s number - t Time T Temperature °C u Fluid velocity m/s V Volume m3 W Width m x Length m
y Average GHI and DIF ratio -
𝛼𝑡 Thermal diffusivity m2/s
𝛼𝑎 Absorptivity -
𝛿 Density kg/m3 ∆𝑅 Diffuse radiation W/m2 ∆𝑇 Temperature difference °C 𝜀 Emissivity constant - 𝜇 Mean parameter - 𝜎𝐵 Stefan-Boltzmann constant 5.67 * 10-8 W/m2, K4 𝜎𝑠 Standard deviation parameter -
𝜐 Kinematic viscosity m2/s
ABBREVIATIONS
Abbreviation Description
CAD Computer-aided design DIF Diffuse Radiation
DNI Direct Normal Irradiance GDP Gross Domestic Product GHG Greenhouse gas
GHI Global Horizontal Irradiance
HVAC Heating, Ventilation and Air Conditioning IEA International Energy Agency
IoT Internet of Things
IRP Integrated Resource Plan LBPL Lower Bound Poverty Line NDP National Development Plan
NOCT Nominal Operating Cell Temperature
OECD Organization for Economic Co-Operation and Development R&D Research and Development
SAURAN Southern African University Radiometrics Network SEA Sustainable Energy Africa
DEFINITIONS
Definition Description
Load
shedding Planned and controlled blackouts in different areas in order to prevent the electricity power system from a total blackout.
Outside air Air in the surroundings. Commercial
buildings Buildings that are used for commercial purposes (including office buildings, warehouses, and retail buildings).
1
INTRODUCTION
Around the world, the economic welfare and the increase of energy consumption have made the challenge of a sustainable future more recognized. Buildings represent an important share of the total energy demand and thus have a great impact on the environment (Yüksek & Tikanska Karadayi, 2017). In order to address the environmental problems, the impact from consumption worldwide must be decreased and the demand for fossil fuels needs to be reduced. South Africa is one of the countries that is heavily dependent on fossil fuel. The country is located at the most south point of Africa and has a subtropical climate where the warm season accounts for almost six months of the year. During this warm season, the average daily high temperature in the administrative capital, Pretoria, in northern South Africa is above 26.1 degrees Celsius (Weather Spark, 2016). Many buildings in the country are built at a time when energy efficiency was not regarded as important and the possibility to construct energy efficient buildings did not exist (Oguntona, Maseko, Aigbavboa & Thwala, 2019). Thus, these buildings lack features concerning energy efficiency such as insulation and double glassed windows, which due to the hot climate contributes to a high demand for cooling.
The following section will present the background to the problem regarding energy efficiency in buildings and narrow it down to three specific research questions.
1.1 Background
South Africa is the most industrialized country in Africa (Inglesi, 2010; Monyei & Adewumi, 2017) and the level of energy production in 2017 was 37.39% higher compared to the
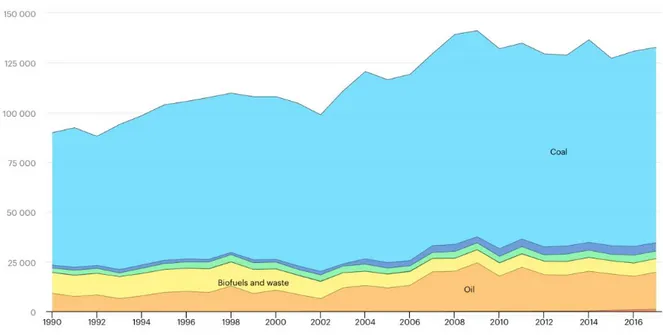
production in 1990 (International Energy Agency [IEA], 2020). The country is one of the most energy intensive nations in the world where coal is the primary energy source to meet the demand (Kohler, 2014; Indexmundi, 2019). More specifically, around 70% of the energy supply in the country originates from cheap, local coal combustion (IEA, 2020)., which can be seen in Figure 1. The energy intensity has partly arisen as a consequence of the cheap electricity prices in the country and the absence of public awareness (Inglesi, 2010). Since the late 2000s, Eskom, South Africa’s primary electricity supplier, has had some trouble to produce at the capacity demanded contributing to widespread blackouts (Inglesi & Pouris, 2010). As of then, Eskom has been conducting load shedding, which is planned electricity power blackouts, in the whole country in order to prevent total blackouts (Eskom, 2020; Sebitosi, 2008).
Figure 1 - Total primary energy supply in South Africa by source, 1990-2017. Source: IEA (2020) South Africa,
https://www.iea.org/countries/south-africa. All rights reserved.
The 2030 South African National Development Plan [NDP] visualizes an energy sector where energy will be efficient and reliable at competitive prices (Department of Energy in South Africa, 2019). The visions for the South African energy sector originate from the Integrated Resource Plan [IRP] 2010-2030 where a long-term expansion of the power mix and a smaller carbon footprint from the energy sector is also suggested (IEA, 2020). IEA (2020) states however, that the low electricity prices are an obstacle which affects the willingness to change. Yet, in order to attain energy security as well as contribute to a sustainable future, the need to be more energy efficient is evident.
1.1.1 Buildings and energy efficiency
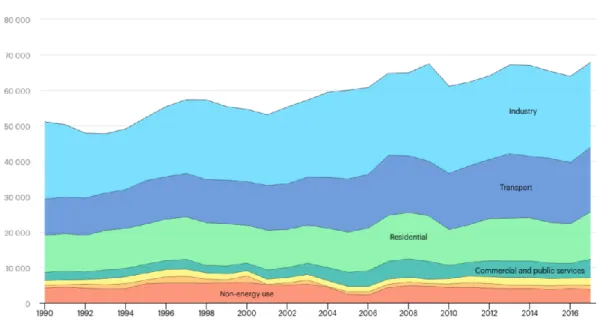
One major source of energy consumption and greenhouse gas [GHG] emissions is the building sector. The building sector accounts for approximately 40% of the world’s total energy consumption (Refahi & Talkhabi, 2015; Sustainable Energy Africa [SEA], 2017) and to achieve sustainability, this sector is hence of great importance. In South Africa, the
commercial and public service sector together with the residential building sector represent roughly 27% of the country’s total energy consumption (IEA, 2020), which can be seen in Figure 2.
Figure 2 - Total final energy consumption in South Africa by sector, 1990-2017. Source: IEA (2020) South Africa, https://www.iea.org/countries/south-africa. All rights reserved.
A typical commercial building in South African is similar to commercial buildings anywhere in the world and can be seen in Figure 3, but SEA (2017) states that commercial buildings in the country is commonly built without much concern for energy performance. Old and energy inefficient buildings along with the hot climate in the country contributes to a heavy dependency on energy consuming technologies such as Heating Ventilation and
Air-Conditioning [HVAC] systems in order to achieve an adequate indoor climate (SEA, 2017). SEA (2017) also state that using electricity for these technologies is very inefficient and expensive.
1.1.2 Building energy demand reduction
One way to achieve both substantial energy savings and to prevent energy shortages is to enhance the design or construction of a building (Cao, Dai & Liu, 2016). For this to be efficient, the local climate has an important role (SEA, 2017) and there are several elements that has to be concerned for both winter and summer periods (Pisello, Goretti & Cotana, 2012). Energy efficiency can for instance be achieved by improvement of insulation, through architectural changes or technological equipment, such as solar panels, being implemented on an already existing building (Jeanjean, Olives & Py, 2013). SEA (2017) also mentions passive cooling and lightning efficiency as essential elements for energy efficiency.
While there are many options to reduce the energy consumption in a building by enhancing or changing the design of it, it is not always feasible. There might be several barriers to enhance the design of a building from an energy efficiency perspective and to make extensive design changes. Oguntona et al. (2019) analysed barriers to retrofit buildings for energy efficiency means in South Africa. From this study, they concluded that there are many
barriers for this purpose such as high investment costs, low consumer attraction and absence of support from the municipality.
However, instead of making changes to the actual design, an emphasis can be put on saving energy and better utilization of the energy. For instance, energy-intensive technologies can be optimized. HVAC demand in buildings is a great contributor to energy consumption and the demand for heating and cooling, together represented one fifth of the global increase in final energy demand in 2018 (IEA, 2019a). Thus, there is in general a great need for utilization of HVAC to be enhanced.
1.1.3 Process modelling
In order to understand the demand for cooling, it is crucial to understand how the solar radiation and the outside temperature affects the ceiling temperature. One way to facilitate the understanding of the problem is to model the heat transfer mathematically. A model is an imitation of reality and it is a way of translating our real-world problem into an equivalent problem, which we then solve and attempt to interpret (Hangos & Cameron, 2001, p. 4). Although previous studies have been widely conducted on the topic of heat transfer
modelling through different materials and the effects of shading (Bigot, Miranville, Fakra & Boyer, 2009; Dominguez, Kleissl & Luval, 2011; Yang, Zhu, Burnette & Lu, 2001), the area of South Africa has not been extensively considered.
1.2 Problem definition
Buildings are a major source of energy consumption and GHG emissions where the demand for heating and cooling represents a great amount of the overall energy consumed.
Worldwide, buildings consume 40% of the total energy consumed and in South Africa the residential and commercial building sectors together represent about 27% of the energy consumed in the country. Old buildings with poor energy efficiency are greatly dependent on
energy intensive technologies to obtain a pleasant indoor climate and HVAC systems represent a great share of the energy consumed in buildings. This applies especially for the summers in South Africa when the average temperature is high, and cooling is greatly demanded. There are several solutions to decrease the energy demand from cooling in buildings, but usually, there are different barriers for implementation.
In order to understand how the cooling demand fluctuates, it is crucial to understand how the outdoor climate conditions affect the interior ceiling temperature and further the indoor temperature. One way to improve the understanding of the phenomenon is to model how the heat from outside transfers through the roof of the building. A number of studies have been conducted within the field but with slightly different conditions and prerequisites. Thus, there is a need to further investigate the subject.
1.3 Purpose
This study aims to investigate opportunities to make commercial buildings in Pretoria, South Africa, more energy efficient, which is made by examining prerequisites in South Africa. To achieve this objective, barriers and measures to decrease cooling demand are investigated and a roof heat transfer model will be developed to attain a deeper understanding of the ceiling temperature distribution. In the future, the model is intended to be used and
developed in order to investigate how an investment of solar panels affects the heat transfer and the ceiling temperature and thus the cooling demand.
1.4 Research questions
• How is the ceiling temperature in a typical commercial building in Pretoria, South Africa affected by solar radiation and outside temperature and how does it change during the year?
• What are the barriers for making commercial buildings more energy efficient in Pretoria, South Africa?
• Which measures may be applied in order to decrease the energy demand for cooling in a typical commercial building in Pretoria, South Africa?
1.5 Delimitations
Firstly, the main building considered in this project, called Engineering II, is a commercial building, which in the context of this study is referred to as a typical office building. Due to the different climate zones in different parts of South Africa, one region has been chosen as an area of focus for this study, i.e. Pretoria in north eastern South Africa.
This project is a part of a larger project at University of Pretoria that aims to investigate different solutions to decrease the cooling demand in commercial buildings and one of their main projects is to investigate how solar panels would affect the ceiling temperature, which in the beginning, were the aim of this study. Considering the prevailing situation with Covid-19 during this partial project, only a limited part of the full project could be conducted, and the installation of the solar panels are delayed. However, an approximated heat transfer model for the considered building is developed which aims to illustrate how the solar radiation and outside air temperature affects the ceiling temperature for an exposed roof. Further, the circumstances with Covid-19 was also a major setback in terms of the amount of primary data that could be collected. Even though a small amount of data could be collected from an experimental building set-up before the lockdown, the data collection in South Africa was projected to proceed for a longer period of time and with different circumstances, such as addition of solar panels. Due to an abrupt, extensive lockdown in the country from the 26th of
March throughout the project, the desired changes could not be made, and no data could be collected during this time.
Finally, to narrow down the scope of the study, the project is also limited regarding the measures and barriers that have been investigated. Regarding the barriers, the financial and socioeconomic perspective are primarily emphasised. For the measures, the main focus is building construction and design, operation of HVAC and passive solar design.
2
METHOD
For this specific case, a model of the heat transfer through the roof of an office in an office building at University of Pretoria have been developed by numerical discretization. Further, the effect of solar radiation and outside temperature on the ceiling temperature was
investigated by temperature measurements from an experimental set-up. In the following sections, the methodology of the project and the choices made are explained.
2.1 Choice of method
Morgan (2017, p. 13) states that there are two different methods in academic research to achieve the aim and objectives of the study; qualitative and quantitative methods. Scientists have developed a range of reasons for integrating the different strengths of qualitative and quantitative methods and there are different ways of combining the two (Morgan, 2017, p. 13). The first research question is answered by a combination called Preliminary qualitative
inputs to a core quantitative research project in order to increase the effectiveness of the
quantitative experiment by beginning with a qualitative study that helped to create an appropriate model (Morgan, 2017, p. 13). The second and third research questions are answered by using a qualitative approach.
In general, quantitative research concentrates on a set of purposes that are typically deductive, objective and general while purposes associated with qualitative research are typically inductive, subjective and contextual (Blomkvist & Hallin, 2015, p. 56). In this study, an abductive method is used, which is a combination of induction and deduction where the researcher moves between theory and empiricism and gradually develops the understanding (Tavory & Timmermans, 2019, p. 5). The first step in the methodological process is based on abductive logic and once the model has been formed, deduction is then applied by using data measurements as inputs in the created model. Induction is then used to evaluate the model and its result.
2.2 Data collection and analysis
The obtained data have been separated into primary and secondary data. According to Blomkvist & Hallin (2015, p. 115), primary data is gathered through own observations and experiments while secondary data is obtained from external parts.
2.2.1 Primary data
To attain primary data, temperature sensors was modelled with Computer-aided design [CAD] and further 3D-printed and installed, at both the office building called Engineering II and the experimental set-up, entitled Experimental farm. The temperature data gathered from the temperature sensors that were attached on the smaller experimental building set-up
was obtained from the 27th of February 2020 to the 24th of March 2020. This data was then
further used in order to explore how the interior ceiling temperature can change with different levels of solar radiance. The small amount of data that could be collected from the office building was available from the 10th of March 2020 to the 12th of March 2020 and was
only used to validate the temperature range achieved by simulating the model.
2.2.1.1.
Setbacks for primary data collection
One obstacle for the primary data collection was the period of time that temperature measurements could actually be conducted and gathered. The initial objective was to compare the results from the simulation with the measured temperature from the installed temperature sensors in order to validate and adjust the model for increased accuracy. This was supposed to be conducted with no air conditioning on. Some problems with the installation of the temperature sensors occurred though, which caused the initiation of the temperature measurements to be delayed. This caused the temperature measurements to only proceed during a short amount of time and resulted in useful data for the external side of the roof for roughly two days. The interior ceiling temperature measurements that could be gathered were only conducted when the air conditioning was left on and was thus excluded. Temperature measurements from the experimental set-up was initiated earlier and therefore, this data could be used.
2.2.2 Secondary data
Secondary data and background information regarding the project are based on both
qualitative and quantitative research methods, from different journals and books. Regarding the research articles, the online libraries of University of Pretoria and Mälardalen University was utilized. Data bases that were used were for instance Science Direct, Google Scholar and ProQuest and words that were searched for were for example “energy efficiency”, “cooling demand in buildings” and “heat transfer modelling”. To attain applicable information, articles with relevant titles, with words related to the subject, were read and assessed.
Previous research was also complemented with information from public websites and reports from different departments and organizations such as the Department of Energy in South Africa and International Energy Agency. The information was thoroughly reviewed in order to only use material that were considered credible and relevant for the research purpose. In order to decrease the risk of using dated information, older sources have been sought to be supported by more recent research.
Secondary data was primarily used to answer the second and the third research questions. For these questions to be answered, a literature review regarding prerequisites that states barriers for increasing energy efficiency in buildings and appropriate measures for
application in Pretoria, South Africa, was conducted, which is presented in section 3.1-3.4 Furthermore, a lot of variables of the model are weather dependent which meant that data regarding outside temperature and Global Horizontal Irradiance [GHI] needed to be obtained from secondary sources. Since the two regarded buildings, Engineering II and Experimental Farm, are allocated within a five kilometres radius, the same approximations
that are further explained in section 4.1.1 were used. Weather data was gathered from Southern African Universities Radiometric Network [SAURAN] from the station GIZ
University of Pretoria, which is also allocated within a five kilometres radius from both of the buildings (SAURAN, 2020).
2.3 Modelling and simulation
For the model development and simulation, Microsoft Excel and MATLAB were used. Microsoft Excel was primarily used to compile, analyse and process data while the heat transfer model was simulated in MATLAB.
An approximative mathematical model of the heat transfer through the roof of the office building was developed, which aims to demonstrate how the interior ceiling temperature changes with different GHI and outside temperatures. To complete the model, dimensions from one office in the building concerned as well as the properties of the construction materials was gathered. The construction material properties were collected from Virtualmaths (2020). The simulations were conducted with a time step of 600 seconds during a total simulation time representing an entire year. The MATLAB code for the heat transfer model can be found in Appendix A. The model was validated to the extent that it operates accurately by a sensitivity analysis and comparison to previous research. The MATLAB code for the heat transfer models for Scenario B and C can be found in Appendix B and C respectively.
2.4 Method discussion
The biggest setback to the project, is the limited amount of time, which caused the data collection and the scope of the project to not be as extensive as intended. The original intention was to further implement solar panels on the roof to see how this affected the temperature inside the office building. Due to the lockdown situation caused by Covid-19 this was not possible though. The limited time for conducting and gathering the temperature measurements also limits the credibility of the compiled data slightly.
The data from the office building was not thought to be enough to generalize and thus fully validate the model from it. Even though the model is validated to operate rather accurately by previous research, more data from the roof and the interior ceiling temperature
measurements would have been desirable to further validated the model and increase the trustworthiness though. For better data accuracy, data would preferably also have been collected during a longer period of time.
At the experimental set-up, both roof and ceiling measurements were gathered
simultaneously during a longer period. This data was thus thought to be useful in terms of comparing how the different solar radiation levels affect the interior ceiling temperature. The experimental set-up was thought to resemble a typical roof of a South African residential
house, and due to the quite large differences compared to the office building, a model for the experimental set-up was not thought to give as convenient results for the aim of the project as a model of the office building. Thus, the data gathered from the experimental set-up was only used for the comparison of different weather conditions on the interior ceiling temperature. Since the Experimental Farm is constructed of thin wood materials and tiles, there are obviously some differences of the thermal behaviour of an actual roof. The results can still be viewed as an indication of thermal behaviour of a roof though. The insulation applied in the set-up also contributes to a slightly more similar behaviour to an actual building.
In this study, the heat transfer model is used as a tool to estimate the temperature
fluctuations in the office ceiling affected by the heat transfer through the roof. The roof was considered as the most important heat entrance path to model in this project since the
original aim was to investigate how the implementation of solar panels would impact the heat transfer and further the indoor temperature.
For future work, the already constructed and installed temperature sensors at the office building, which are supposed to accumulate data for validation of the model, are also thought to be useful. Another approximation that has to be considered when evaluating the accuracy of the model is the fact that the roof in the office building does not actually have a constant thickness, which will also affect the reliability of the result.
3
LITERATURE REVIEW
In order to identify different possibilities to decrease the cooling demand in buildings in Pretoria, it is essential to investigate which measures that can be applied and which barriers that might affect the implementation. Thus, the next section will present some specific prerequisites for South Africa and measures that previously have been studied. This section will also present the fundamentals of heat transfer that is necessary when developing the heat transfer model.
3.1 Prerequisites in South Africa
The Organization of Economic Co-operation and Development [OECD] (2013) states that since 1994, the living standards and financial management in South Africa have experienced a great improvement. To achieve the country’s full growth potential there are still both structural and social challenges that have to be overcome such as high unemployment and among the largest segregation gaps in the world (OECD, 2013). In order to conclude which measures to reduce cooling that may be applied in South Africa, some prerequisites will be further presented below.
3.1.1 Energy and electricity
As previously mentioned, South Africa’s energy supply originates mainly from coal that contributes to a lot of pollutions and environmental problems. Even though there is a great potential for the use of renewable energy sources in the country, only 11% of the energy supply during the 2000s originated from renewables (OECD, 2013). Since the availability and demand for electricity has progressively been increasing, to meet the electricity demand, the electricity supplier is now conducting load shedding to maintain a functioning power grid (Eskom, 2020). The electricity demand can be derived mainly from the mining industry and even though roughly 84% (Trading Economics, 2020) of the country’s population have access to electricity, not all people can afford electricity for other purposes than lightning (Swedish Society for Nature Conservation, 2020).
By 2030, the NDP suggests that at least 90% of South Africa’s population should be able to access the electricity grid and thus, additional electricity capacity will be needed (National Planning Commission, 2015). The NDP further states that some of the existing capacity is objected to be shut down, while some new capacity will be implemented to 2030, where at least half of the new capacity should come from renewable sources. At the same time, the water demand is also sought to be decreased. The National Planning Commission (2015) also present objectives regarding the environment and sustainability, where the goal of
contracting at least 20 000 MW renewable energy is among one of them. Furthermore, the NDP emphasises the great sought for decreasing emissions and by 2030, one objective is e.g. to have zero emission building standards, and another was to establish carbon pricing (National Planning Commission, 2015). Since the first of June 2019, the first phase of the carbon tax scheme was initiated at a rate of 120 South African Rands [ZAR] per ton of carbon
dioxide equivalent (South African Revenue Service, 2020). According to South African Reserve Bank (2020), this represented approximately 8,13 US Dollars at the day of the carbon tax initiation, and at the first of April 2020, approximately 6,66 US Dollars.
3.1.2 Economic situation
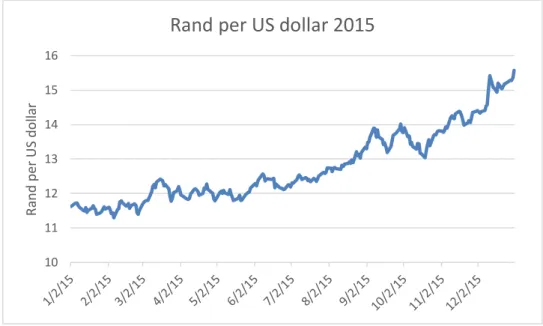
The prevailing poverty in South Africa is widespread and in 2015, 40% of the population was living below the Lower Bound Poverty Line [LBPL] (Department of Statistics South Africa, 2020), which then represented 647 ZAR per month (Department of Statistics South Africa, 2019). Figure 4 shows the value of South African Rands per US Dollars during that year.
Figure 4 - Rand per US Dollar during 2015 based on data from South African Reserve Bank (2020)
Today, segregation in the country is a fact and the gap between the rich and the poor is among the largest in the world, which contributes to an unsustainable social situation (Leck, Sutherland, Scott & Oelofse, 2012, p. 76). The Swedish Society for Nature Conservation (2020) state that the people who are contributing least to today’s environmental problems are the ones who are affected most by it from both social and wellbeing perspectives. Further, they state that it is common that industries that contribute to a large extent of the pollutions are located in poor neighbourhoods where labour is cheap. Since a lot of poor people live in these industrialized areas, they are more extensively impacted by pollutions caused by industry and due to poorer housing situations, they will also be significantly affected by environmental disasters if that would occur. According to Leck et al. (2020, p. 61), social problems are important to regard when making policy decisions and the Swedish Society for Nature Conservation (2020) also emphases the need for social barriers to be disentangled in order to further tackle environmental problems in this situation. Pressend (2012, p. 164) highlights that the South African government have not prioritized a holistic approach though and thus, simultaneous social well-being and environmental improvement is hard to achieve. The South African government states the need for a faster growing economy in a way so that all South Africans benefits from it to get the country out of extreme poverty and to reduce
10 11 12 13 14 15 16 R and per U S do lla r
inequality (National Planning Commission, 2015). It is for this purpose the NDP was actually developed. Primary challenges to be addressed and met in the country are for example that the economy is unsustainably resource intensive, the high level of corruption and the divided society (National Planning Commission, 2015). To further address these challenges, the 17 Sustainable Development Goals (SDGs) have now also been linked to the country’s NDP (Department of Statistics South Africa, 2020).
3.1.3 Technological development
South Africa stands before many challenges since they need to reduce their social, economic and environmental problems. The NDP further acknowledges that crucial elements to enable socio-economic development is through educated and inventive people (National Planning Commission, 2015). Thus, science, technology and innovation play a vital role. The National Planning Commission (2015) highlight that due to globalization, access to technology and skills has increased in many poor and middle-income countries like South Africa. Further, they state that interconnections between different countries have also lowered obstacles regarding the expansion of knowledge. While globalization has contributed to increased access to vital assets, they also emphasise that it is still essential for South Africa to enhance its innovativeness and technological progression. For this purpose, greater investments in Research and Development [R&D] and better utilization of existing resources is needed though (National Planning Commission, 2015).
According to OECD (2019), compared to other OECD countries, South Africa is among the bottom ten countries considering spending on R&D. More specifically, below 1% of their Gross Domestic Product [GDP]. In 2019, all OECD countries in total spent more than 2.4% of the GDP on R&D (OECD, 2019). In the NDP, many goals regarding the expansion of
education and innovation can be found though, and one objective is to expand the outputs from science, technology and innovation by increasing spending on R&D from the
government and concerned industries (National Planning Commission, 2015).
3.2 Building construction and design
There are several constructional elements that are important for the energy efficiency of a building. The envelope of the building as well as the geometric design can influence the energy performance substantially (Kheiri, 2018). Kheiri (2018) mentions the utilization of sustainable renewable energy resources, such as sunlight, for the purpose of increasing the energy performance of buildings. This can be applied either passively by solar thermal energy or actively by applying photovoltaics [PV] integrated to the building that generate energy or solar systems for water heating. Thus, the need for non-renewable energy can be decreased and the energy performance is enhanced.
3.2.1 Construction material
To a certain degree, the energy demand in a building is dependent on the capacity of thermal storage of the construction materials (Karlsson, Wadsö & Öberg, 2013). As previously
mentioned, SEA (2017) claim that heavy materials, including for example concrete and brick, have a positive influence on the energy performance of a building and Betongforum (n.d.) state that heavy materials compared to lightweight materials can provide a comfortable indoor environment for a longer period of time in both cold and warm climates. Betongforum (n.d.) also state that concrete is a well-established and reliable construction material that is used in several types of buildings for e.g. floors, walls and building frames and beams. The widespread utilization of concrete has developed due to the material’s sustainability, fire safety and now more commonly its thermal properties (Betongforum, n.d.). The great heat storage capacity of concrete can be utilized, both to achieve comfortable indoor climate and reduce temperature fluctuations, as well as for energy saving purposes (Svensk Betong, 2020). Svensk Betong (2020) claim that energy savings in buildings with great heat excess, levels like offices, from heat storage by concrete elements can be achieved to about 10–40%. Romeo and Zinzi (2013) investigate in cool materials, which they define as materials that are able to maintain cold while exposed for solar radiation. As examples of cool materials, they mention tiles, asphalt shingles, metal roofs, elastomeric coatings and single-ply membranes. These materials are stated to have a great ability to reduce solar radiation and does thus constrain an increase of surface temperature. At the same time, these materials also have the capacity to emit heat to the sky during night-time and dissipate gained heat, contributing to that the roof stays cooler and further reduce the heat transfer into the building (Romeo and Zinzi, 2013). Romeo and Zinzi (2013) further state that roofs constructed with these
materials can be called cool roofs. In their study, they compared how different technologies impact the cooling demand at a public building in southern Italy during cooling season. It was concluded that even though all technologies explored decreased the cooling demand with at least 30%, their cool roof application reduced the cooling demand with 54%. They finally state that an even better result can be achieved by combining cool roof applications with other technologies, where cool roofs in combination with shading was the most efficient solution decreasing the energy demand up to 78%. Moreover, they highlight that cool roofs have a greater impact on the savings if the ratio of the roof surface to the building volume is high though and savings in a building with several floors can be anticipated to be relatively lower.
3.2.2 Passive solar design
SEA (2017) propose ten suggestions of passive solar design that can be applicable in South Africa e.g. building orientation and material, shading, landscaping and surface colours. Orientation regards the fact that orientation in a specific direction will cause a warmer or colder indoor climate. This also plays an important role in creating an accurate passive cooling, where outlets can be placed in a way so that cross ventilation appears. SEA (2017) also remark that the properties of heavy materials will allow the heat absorbed during the day to keep the building warm during nights and the other way around with cold absorption during the night. Shading includes e.g. shading of windows in rooms that are exposed to
sunlight in a way that will let sunlight in during the winter when the sun is lower but will shade the window during summer. Landscaping involves adding different kinds of trees or shrubs for shading and wind protection. Lastly, SEA (2017) also mentions that roofs and facades that are light coloured will contribute to reflection of undesirable solar radiation during the summer. Bashirpour-Bonab (2019) conducted a study on the energy consumption in buildings in different climates where it also was concluded that the colour of the facade affects the energy demand in a building. A darker colour will absorb more heat than a light one and thus contribute to a higher surface temperature. In the previously mentioned study by Romeo and Zinzi (2013), they also investigated the impact of applying light paint, with high solar reflectance and thermal emittance, on roof surface temperature. From their study, a decrease of the maximum temperature difference at the roof could be decreased from 48 °C to 26 °C. Not only did this have a positive impact on the energy performance, but the thermal stress to the roof was also reduced, contributing to a longer roof system lifetime. Further, the temperature difference between the roof and the air during a period of nine days could also be decreased from 20 °C to 5 °C by applying the cool coating.
Bashirpour-Bonab (2019) also investigated the implementation of green roofs and stated that they can be useful in order to reduce energy consumption. Refahi and Talkhabi (2015, p. 595) defined a green roof as “the use of vegetation covering on the roof of a building”. In their study, they also concluded that the application of a green roof will contribute to an abundant reduction of energy demand where the effect on energy consumption is greater in buildings with fewer floors. Jaffal, Ouldboukhitine and Belarbi (2012) observed a passive cooling effect during hot months and further state that the implementation of a green roof can reduce the risk of extreme temperatures of the roof and high temperature variations. They suggest that this is achieved from both solar shading and thermal resistance and that this contributes to a longer roof lifetime. The impact of green roofs is more efficient in hot climates to reduce cooling demand but can also have an impact in colder climates to reduce heating demand (Jaffal et al., 2012). Jaffal et al. (2012) also state that the greatest effects from green roofs occur when there is thin or no insulation, which makes green roofs a suitable measure to retrofit old buildings rather than when constructing new buildings. Further, they also highlight the importance of the prevailing climate for the solution to be effective.
Pisello, Piselli, and Cotana (2015) further investigate the opportunity to implement Cool-Green roofs, which are developed for application in both new and present buildings. Besides all the advantages that a regular green roof has, this solution does also include having vegetation with properties of a typical cool roof material, i.e. light colours and high thermal reflectance. The authors also suggest that the vegetation should be periodical, meaning that it should represent an element of absorption during cold months, and during hot months it operates reflectively. In addition, the visual impact is low. For the specific case of central Italy, which Pisello et al. (2015) investigates, a typical Mediterranean dryland shrub that does not require that much maintenance is suggested for implementation of green roofs. Their experiments show that the suggested Cool-Green Roof can reflect more than 6% compared to a concrete roof and an increase of 7% compared to a traditional green roof with grass.
Further, compared to a concrete roof, the solution also contributes to substantial reductions in overheating hours during summer and a minor percentage of overcooling hours during winter. A thin insulation layer is stated to may contribute to an improved effect.
3.2.3 Insulation
There have been several studies conducted regarding the energy savings that can be made from optimizing insulation in buildings in different climates with regards to material and insulation thickness. Wati, Meukam and Nematchoua (2015) states that external insulation can decrease the demand for both heating and cooling in tropical climates. Further, Melo and Lamberts (2009) state that there are more elements that contribute to the thermal
performance of the insulation such as the shape and size of the building, internal thermal load and type of air conditioning system. The climate conditions are also highlighted as a factor of great importance for whether the insulation have a positive or negative effect on the yearly thermal load. Chvatal & Corvacho (2009) investigated the risk of overheating the building during the summer by adding insulation. They found that the energy consumption can be considerably reduced by increasing the insulation thickness in countries that have a long heating period and short and mild summer. However, they state that a highly insulated roof may cause a rise in the indoor temperature above acceptable comfort limits which is a problem that occur more often in countries with long summer periods, high outdoor temperatures and high solar radiation exposure.
Al-Jabri, Hago, Al-Nuaimi and Al-Saidy (2005) state that insulation is an unpopular energy saving option in some areas despite the fact that it can have a positive impact on the indoor climate due to the high investment costs and the requirement of experienced labour. Kolaitis et al. (2013) conducted a comparative study of external and internal insulation where they concluded that for an identical insulation area, the cost of investing in internal insulation is approximately 50% compared to external insulation. Romeo and Zinzi (2013) compared insulation to external shading in southern Europe and concluded that insulation has a slightly greater effect on cooling demand compared to external shading. Wang and Zhao (2018) on the other hand found that glazing and shading are more efficient for energy performance than insulation at locations with hot summers and warm winters. The climate subject for their research has similar summer temperature conditions to northern South Africa, but the warm winter climate has a somewhat higher winter temperature than Pretoria. Wati et al. (2015) also studied the impact of shading on the optimal insulation thickness. They concluded that with a higher shading level, the optimal insulation thickness can be decreased by 0.029 to 0.036 cm per percentage of solar radiation blocked, depending on the wall orientation.
3.3 HVAC operation
Except for the building construction and design, there are several opportunities to reduce the energy demand for HVAC utilization. SEA (2017) suggest that an ideal indoor temperature range between 19 °C and 25 ° C and according to Kheiri (2018), half of the building energy consumption can be connected to HVAC systems. HVAC systems are used to achieve and maintain a pleasant indoor environment with regards to temperature and are of great
importance in countries with hot climates like South Africa’s. In a fully air-conditioned office building, an HVAC system may contribute to 30-60% of the total energy consumption of the
building (SEA, 2013). If the HVAC system is not properly dimensioned or operated, a lot of unnecessary energy can be consumed without fulfilling its purpose (Budaiwi & Abdou, 2013). SEA (2017) states that there are low-cost actions with short pay-back time such as
implementing sensors and timers to control the utilization. They also mention more costly opportunities, like replacement of whole systems, which consequently has a longer pay-back period. These kinds of changes also require a high level of know-how and experience. SEA (2017) also highlight the passive techniques like shading and reflective covering as choices to reduce energy consumption from HVAC utilization.
Mora, Carpino and De Simone (2018) state that there are not only physical factors such as building size and age, climate and HVAC system design that are important when regarding the energy consumption in a building. One of the main factors driving air-conditioning demand in buildings is the occupancy (Peng, Rysanek, Nagy & Schülter 2017). As previously mentioned, an HVAC system may contribute to a great share of the total energy consumption in a building. Optimizing the system’s utility as well as creating a good understanding for occupants’ behaviour are thus also crucial elements (Peng et al., 2017). Capozzoli, Savino Piscitelli, Gorrino, Ballarini and Corrado (2017) conducted a study of how the occupancy pattern in office buildings affects the energy consumption of HVAC systems. Their study showed that by optimizing an HVAC system by an operation schedule with respect to the occupancy pattern, a significant reduction of energy consumption could be seen.
3.3.1 Thermostat strategies
According to IEA (2018), cooling is the fastest growing end-use in buildings as its energy demand more than tripled between 1990 and 2018 and the growing use of air conditioners in commercial and residential buildings is expected to continue over the next three decades. Wang, Pattawi and Lee (2020) suggest that most people do not have the expertise to control the HVAC system efficiently which results in unnecessary energy consumption due to overheating, overcooling and operation without occupancy. Although turning off the HVAC system during the unoccupied period could save energy, such a saving requires a consistent occupancy pattern and it could also risk putting users in thermal discomfort if they are in the building when the HVAC system is off. This has made scientists investigate the impact of diverse thermostat settings on energy consumption (Moon & Han, 2011; Wang et al., 2020; Escrivá, Segura-Heras & Alcázar-Ortega, 2010; Afroza, Shafiullaha, Urmeea, & Higginsc, 2018).
Wang et al. (2020) demonstrated that an occupancy information-based control algorithm can save about between 11% and 34% of energy without significantly risking the occupants’
comfort level. It is also suggested that an adaptive control model has a more tangible saving impact as Internet of Things [IoT] products can easily integrate outside temperature. Depending on the locations, they also conclude that adaptive control can save up to 54% of energy consumption, and the occupancy information can add additional energy saving impact by 20%. Compared with the most wasteful control strategy (fixed setpoint - always on), adding a thermostat with adaptive – occupancy driven control strategy can lead to less than one year of payback period regardless of location (Wang et al., 2020).
Escrivá et al. (2010) examined how different combinations of pre-heating and switching off the device during a short period of time would affect the energy demand and comfortability during the winter. The result showed that the most energy efficient alternative was a
combination of pre-heating during off-peak periods, switching off at midday, when the temperature reaches its maximum, and switching off in advance in the evening.
Further, Moon and Han (2011) investigated different setback periods and different set-point and setback temperatures for different climate conditions and found that by applying night-time setback as well as night- and daynight-time setback methods can save significant energy for cooling in a hot climate.
3.4 Solar panels
Even though South Africa relies heavily on the country’s availability of coal for energy supply, the southern regions of Africa experience a lot of sunshine throughout a year. Most areas in South Africa have a yearly average of more than 2 500 hours of sunshine and an average solar radiation of 4,5 to 6,5 kWh/m2 in one day (Department of Energy in South Africa, 2020). The
electrical output of a solar panel depends on several different factors such as its dimensions, technology, duration of exposure and radiation received, where a solar flux of 1000 W/m2
can be corresponding to sunny weather while a cloudy sky will radiate between 100 and 500 W/m2 (Labouret & Villoz, 2010, p. 3). According to Labouret and Villoz (2010, pp. 34-38) the
sizing of a PV system should be based on the monthly averages of daily solar energy of the region and the physical values used is the total solar irradiance distribution over one day. With optimal solar radiation of 1000 W/m2, a crystalline silicon PV module of one square
meter and a module efficiency at 13%, would generate between 400 and 800 Wh/day in Africa (Labouret & Villoz, 2010, p. 3). Regardless of the great yearly number of sunshine hours, the country has the highest average monthly rainfall during its summers, i.e. November to March, when at the same time, the average monthly temperature curve is peaking (The World Bank, 2019). The World Bank (2019) states that on the contrary, the winter months provide a colder climate with scarce rainfall.
Among renewable energy sources, solar is now a well-recognized technology that has great potential for utilization and integration in buildings (Okoye & Solyal, 2017). During the last ten years, the cost of PV modules has decreased substantially but although the price level has declined, IEA (2019b) states that the efficiency of PV modules is continuously improving. There are still many potential solar customers that consider the initial investment costs as high (IEA, 2019b). The energy generation from solar is not the only advantage of
implementing solar panels though. As previously mentioned, the effect of shading from solar panels on the indoor temperature has been established to provide a positive impact in hot climates (Bigot et al., 2009; Dominguez et al., 2011; Kapsalis & Vardoulakis, 2014; Yang et al., 2001).
Bigot, Miranville, Fakra and Boyer (2009) conducted a study on the insulation effect of PV systems at La Reunion island by developing a nodal thermal model. In the study, two experimental platforms representing an office or a bedroom and small-scale test cells
respectively are used to validate the model. Four different installations and roof compositions were tested, and they found that solar panels, both installed on a confined and an opened air layer, have an insulating effect contributing to an indoor temperature decrease by 3 °C and 6 °C respectively. They further state that PVs can be a good substitute for traditional solar roof protections as it in addition generate electricity.
Dominguez, Kleissl and Luval (2011) investigated the case of modifying a rooftop using solar panel by modelling the heat transfer through a roof. The study was conducted in 2009 in San Diego, California and the authors stressed the fact that the study is a case study, and that the results may not be generally applicable. Nevertheless, their study demonstrated that a temperature difference of a roof up to 2.5 K can be achieved from having solar panels that shade the roof compared to when it is directly exposed to solar radiation. The heat flux through the roof was also reduced by 63% due to the PV installation. This is comparable to the results of Yang, Zhu, Burnette and Lus’ (2001) simulation model, where they found that compared to a conventional roof, the shading from PV-modules contributes to a cooling load component reduction by about 65%.
Salamanca, Georgescu, Mahalov, Moustaoui & Martilli (2016) investigated the impacts of rooftop solar panels on near-surface air temperature and cooling energy demand for two major USA cities of Arizona. The result demonstrated that the deployment of solar panels reduces near-surface air temperature and cooling energy demand but only during daytime. A covered roof receives less incoming solar radiation than an uncovered roof and thus a smaller amount of heat is diffused into the building, but the solar panels reduces the radiative cooling during the night and, consequently, increases the roof temperature.
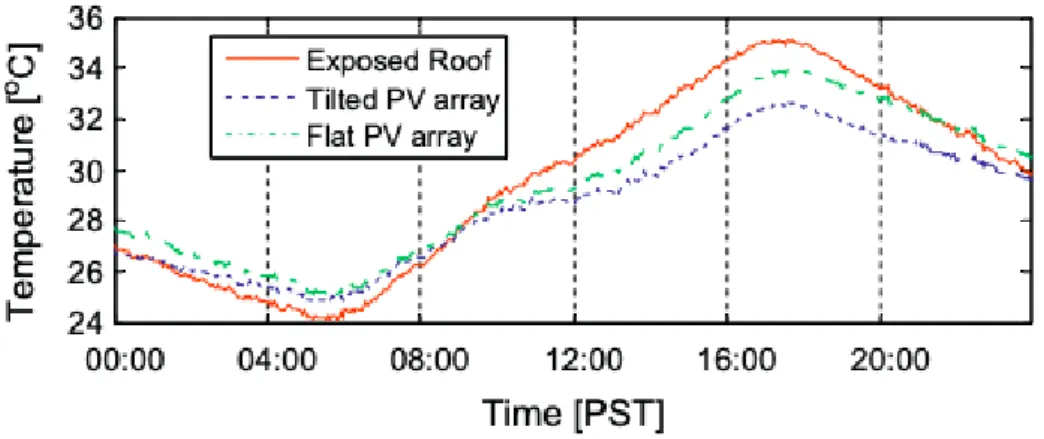
Dominguez et al. (2011) did also investigate the effects of solar panels on roof heat transfer and compared addition of horizontally installed solar panels on an exposed roof with addition of tilted ones. The tilted panels were raised which allowed an airflow between the roof and the panel. For the exposed roof, the exterior roof temperature exceeded the outside air temperature and the interior ceiling temperature from early morning to around 6 pm and peaks around noon at approximately 60 °C. Their results further showed that the roof
temperature for the tilted array under the panels was significantly lower than for the exposed roof.
Figure 5 illustrates the ceiling temperatures for the exposed roof, the roof with a tilted PV array and the roof with a flat array. The ceiling temperature under a tilted PV array proved to be cooler than under a flat array during the entire day, since the convection of air through the air space below the panel results in heat removal (Dominguez et al., 2011).
Figure 5 – Ceiling temperatures for the three different cases (Reprinted from Solar Energy, 85(9), Dominguez et al. Effect of solar photovoltaic panels on roof heat transfer. P. 2248, Copyright (2011), with permission from Elsevier)
3.5 Heat transfer
Heat transfer takes place through the three principal mechanisms which will be further presented below. Each mechanism can be represented by specific forms of constitutive equations (Hangos & Cameron, 2001, p. 69). This section gives a brief outline of the principal heat transfer mechanisms and their mathematical representation in order to create a better understanding for the development of the model.
Incropera, Dewitt, Bergman and Lavine (2013, p. 2) states that the three fundamental modes of heat transfer are; Conduction, Convection and Radiation, which are illustrated in Figure 6. They define Conduction as heat transfer that occurs across a stationary medium due to an existing temperature gradient. Convection occurs when heat transfers between a fluid in motion and a solid and the third heat transfer process, Thermal radiation, occurs if there is a temperature difference between two surfaces since all surfaces of finite temperature emit energy in the form of electromagnetic waves in absence of an intervening medium.
The first law of thermodynamics states that energy can neither be created or destroyed which means that energy can only be transferred or changed from one form to another (Incropera, Dewitt, Bergman and Lavine, 2013, p. 2). The increase in the amount of stored energy must be equal to the difference between the energy entering Ein and the energy leaving Eout
(Equation 1) and can also be defined as a function of density 𝛿, surface area Aroof, and specific
heat Cp (Equation 2).
∆𝐸𝑠𝑡 = 𝐸𝑖𝑛− 𝐸𝑜𝑢𝑡 Eq. 1
𝐸𝑠𝑡 =
𝛿∗ 𝐴𝑟𝑜𝑜𝑓∗ 𝑑𝑥2 ∗ 𝐶𝑝
𝑑𝑡 Eq. 2
Dx represents the distance between the nodes that the wall is divided into and dt represents the time step used when conducting the simulation of the model.
3.5.1 Conduction
Heat conduction is essentially the transmission of energy by molecular motion, which means that the heat transfers from the more energetic particles of a substance to the less energetic due to interaction between the particles (Ghoshdastidar, 2012, p. 3). In the presence of a temperature gradient, energy transfer by conduction must occur in the direction of the decreasing temperature. The conductive heat transfer, Qcond, can be defined with the
following formula (Incropera et al., 2013, p. 3).
𝑄𝑐𝑜𝑛𝑑 = 𝑘 ∗ 𝐴 ∗ ∆𝑇 Eq. 3
Where k is the thermal conductivity of the solid and is a measure of a materials ability to conduct heat. The conduction heat flux increases with an increasing value of the thermal conductivity. A is the cross-sectional area and ∆T is the temperature difference across the solid.
3.5.2 Forward in time and central in space
In numerical analysis, the Forward in time and central in space method [FTCS] is a finite difference method used for numerically solving the heat equation and is often applied to diffusion problems. The conduction heat flux through the roof will be modelled using the FTCS-method applied to the one-dimensional transient heat conduction equation. (Alebraheem, 2017).
−𝐹𝑜 ∗ 𝑇𝑖−1𝑛+1+ 2(1 + 𝐹𝑜)𝑇
𝑖𝑛+1− 𝐹𝑜 ∗ 𝑇𝑖+1𝑛+1= 𝐹𝑜 ∗ 𝑇𝑖−1𝑛 − 2(1 + 𝐹𝑜)𝑇𝑖𝑛+ 𝐹𝑜 ∗ 𝑇𝑖+1𝑛 Eq. 4 Where index n denotes time and index i represents space. Fourier number is a function of thermal diffusivity 𝛼, the characteristic time dt, and the length through which conduction occurs dx. In order for the FTCS method to be stable, the following condition needs to be satisfied (Alebraheem, 2017).
![Table 1 -Building measures for Engineering II Building measures Roof width [m] 7 Roof length [m] 3.5 Room height [m] 2.5 Screed thickness [m] 0.014 Concrete thickness [m] 0.016](https://thumb-eu.123doks.com/thumbv2/5dokorg/4734905.125391/37.892.109.447.135.290/building-measures-engineering-building-measures-thickness-concrete-thickness.webp)