VT1 notat
Number: Title:
Author:
-71-1994 Date: 7 Nov 94
Comfort Disturbances caused by Low-frequency Motions. Johan Förstberg O © O Ned Å _S Group: Project number: Project name: Financed by: Distribution: Railways 70011
Comfort Disturbances caused by Low-frequency Motions in modern Trains.
Swedish State Railways (SJ), ABB Traction AB, Swedish Transport and Communications Research Board (KFB) and Swedish Road and Transportation Research Institute (VTT). Free div Väg- och transport-forskningsinstitutet ä
PREFACE
This document is an abbreviated version of a test report (SJ/LR 9210-15m, 1993) made by me for the Swedish State Railways (SJ) concerning the influence of low frequency motions on passenger comfort. SJ has ñnanced these tests and has the copyright of the test report. I was by that time employed by SJ.
This paper is part of a project called "Comfort disturbances caused by Low-frequency Motions in modern Trains" and is described in a VTI publication (VTI notat 36-1994) The project is ñnanced by Swedish State Railways (SJ), ABB Traction AB, Swedish Transport and Communications Research Board (KFB) and Swedish Road and Transport Research Institute (VTI).
VTI Notat 71-1994
CONTENTS
Preface... i
Contents ... ii
Abstract ... iii
1. Earlier tests concerning comfort disturbance (X15, 1979) ... .. 1
2. Earlier tests concerning comfort disturbance (BR 1983 - 1984) ... .. 2
3. Comfort disturbance. Test with XZOOO (1992). ... .. 3
3.] Test stretches ... .. 3 3.2 Evaluation ... .. 3 3.3 Results ... .. 6 3.4 Further evaluation (1994) ... .. 6 4. Conclusion ... .. 8 Acknowledgements ... .. 8 References ... 8 Appendix ... 9 VTI Notat 71-1994 pageii
ABSTRACT
Comfort disturbances can arise from sudden motions, high lateral accelerations or rapid changes of lateral acceleration (jerks). The motions may be caused by long wave errors in track alignment, bad rail joints, switches or high speed on curves. These comfort disturbances can be indicated and recorded by test persons using push-buttons. By measuring the vehicle motions at the same time, limit values for low-frequency motions may be suggested to reduce the probability of comfort disturbances to an appropriate level.
Introduction ,
Railway companies around the world are competitors in a market shared with aeroplanes, buses and cars. In order to attract old and new passengers, shorter travelling time by faster trains is required, together with a higher standard of comfort.
Problem
Low-frequency motions due to long-wave alignment irregularities and curves give rise to comfort disturbances at high speed, especially on old track. Tilting trains can compensate for high uncompensated lateral accelerations on curves and therefore allow higher speeds without reducing ride comfort. But what limit values are acceptable for low-frequency motions and track irregularities?
VTI Notat 71-1994
1.
EARLIER TESTS CONCERNING COMFORT DISTURBANCE (X15, 1979)
A similar test was conducted in 1979 with the experimental tilting train X15 for the following purposes:
0 Evaluate ride comfort at high speed and high uncompensated lateral acceleration
0 Evaluate and try to determine limit values for mean lateral acceleration, rate of change of lateral
acceleration (jerk) and roll angle velocity for comfort disturbances - Determine the risk of motion sickness
Provide basic knowledge about comfort disturbances and information for possible future tests. The test train (X15) was tested on two very curving stretches. First between Järna and Nyköping (56 km) on the main line between Stockholm and Malmö and second between Gävle and Sundsvall (233 km). Two groups of 10 test persons from SJ were engaged in the tests. Twenty-two test runs were done on the Järna - Nyköping line with test persons seated or standing. Between Gävle and Sundsvall 5 test runs were carried out with the test persons altemating between, seated, seated reading, standing and walking.
The test persons were instructed: "To press the button onceon every occasion you register shakings and jerks etc., as according to your comfort standard is at limit of a good train ride. Press twice if extra strong disturbances".
Results
The results are shown in Appendix l. Recommendation and suggested limit values: 0 Mean lateral acceleration (over 1 5) 0.9 - 1.0 [rn/52]
o Lateral jerk (low pass ñltered 0.3 Hz) 0.4 [rn/53]
o Compensation in tilting system 65 - 70 [%] o Long-wave error in alignment should be minimised.
VTI Notat 71-1994
2.
EARLIER TESTS CONCERNING COMFORT DISTURBANCE (BR 1983 - 1984)
In the years 1983 to 1984 the British Railway Research (BRR) in Derby conducted several series of tests measuring passenger dissatisfaction (comfort disturbances) with the push button technique. Their instructions to the test persons were: "to press a button whenever youconsider the lateral ride
uncomfortable or very uncomfortable". These tests are documented in British Rail Research BRR TR D05 017 and D05 018.
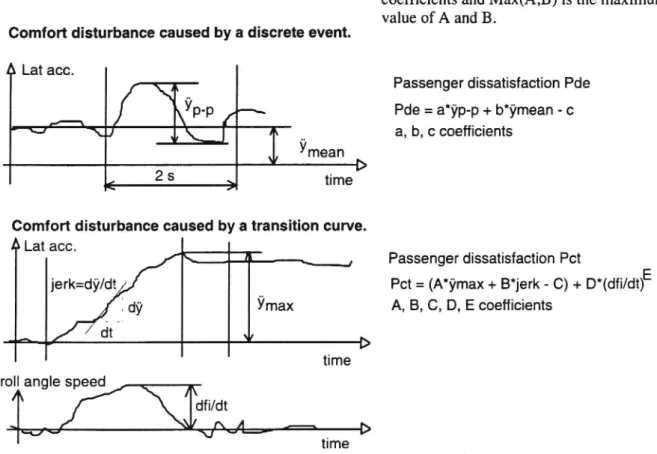
In their analysis they distinguish between comfort disturbance from a sudden movement (discrete event) and from high rate of change of lateral acceleration (jerk) in a transition curve. See example in
Figure 1 on next page. The discrete event is characterised by the peak-to-peak value of lateral
acceleration (yp_p) and the mean acceleration (ymean). The passengers' dissatisfaction (PDE) is then
formulated:
PDE = a*yp_p +b*ymean -c, where a, b, c are constant coefñcients
In a transition curve the passengers' dissatisfaction (FCT) is characterised by the maximum
accelera-tion (ymax) within or shortly after the transiaccelera-tion, the maximum lateral jerk (dy/dt) evaluated over a second and the maximum roll angle speed (d(p/dt).
PCT = Max((A*ymax + B*d')7/dt -C);O) + D*(d(p/dt)E
Comfort disturbance caused by a discrete event.
I? Lat acc. v
FF'-,1
\J 444
\ p p /
9
mean
2 S time
Comfort disturbance caused by a transition curve.
A Lat acc.
jerk=dy/dt
dt-.dy Ymax
roll angle speed
:I / ' dfi/dt
'Huv ' A - '- _
i>
time
time
where A, B, C, D, E are constant
coefficients and Max(A;B) is the maximum
value of A and B.
Passenger dissatisfaction Pde
Pde = a*yp-p + b*ymean - c a, b, c coefficients
Passenger dissatisfaction Pct
Pct = (A*ymax + B*jerk - C) + D*(dfi/dt)E
A, B, C, D, E coefficients
Figure 1. Showing the two types of event causing comfort disturbance (passenger dissatisfaction)
according to BRR.
VTI Notat 71-1994
3.
COMFORT DISTURBANCE. TEST WITH X2000 (1992).
These tests were conducted in a similar way as the earlier tests with the X15-train, i.e. four test groups with five persons in each group and two groups per day in different cars in the train. Measured
channels were comfort disturbance markings from push-buttons, lateral and vertical acceleration over one bogie in each car, tilt angle from tilt system control computer, roll angle velocity from a
gyroscope and train speed. Se Figure 2 on next page.
Layout of testing train
Pirection Gothenburg Direction Stockholm
\ /
Driving unit car # 2 car # 3 car # 4 Measurment car Trailing car
/ F M1, M3 M2, M4 \
Measured channals: Lat. acc Lat. acc Train speed
vert acc. Vert acc. Tilt angle Roll angle speed
Figure 2. Train formation and measured channels
The instruction to the test persons was: "Press once whenever you feel strong shakings, jolts etc., which according to your standard are passing beyond the limit of good comfort. Press twice in rapid succession when you feel very strong discomfort."
The test persons were told to sit down or to stand during a test run, which lasted 40 - 45 minutes at the most.
3.1 Test stretches
The test stretches were on the main line between Stockholm and Gothenburg.
Test stretch Distance Journey time Maximum speed Number of tests Järna - Katrineholm 85 km 30 - 35 min 180 km/h 2 days * 2 directions Katrineholm - Hallsberg 65 km 25 - 30 min 200 km/h 2 days * 2 directions Hallsberg - Skövde 1 13 km 40 - 45 min 200 km/h 2 * 2 days * 2 dir. The test stretch Hallsberg - Skövde was tested twice in order to be able to see the consistency of the test persons and also to acquire more measurement data for better statistics.
These lines were also recorded with the SJ Mauzin track measurement car thus obtaining track data for the possibility of making a comparison between track data and comfort disturbances.
3.2 Evaluation
The evaluation of the X15 experiment was focused on mean lateral acceleration, rate of change of lateral acceleration (jerk) and roll angle speed. Only parts of the test stretch with a recorded comfort disturbance were evaluated.
The main difference between the BRR and SJ analyses, is that SJ does not distinguish between two cases (discrete events and transition curves), feeling that the passengers are not aware of the cause of a specific motion, just the motion causing discomfort. Limit values should be imposed on the low frequency motions and later be translated to limit values for track standard. The second difference is that BRR has used linear regression between dissatisfaction and physical inputs, where SJ has used exponential regression.
To test some of the ideas behind the BRR approach, the peak-to-peak lateral acceleration VTI Notat 71-1994
(y _ ) was selected as a parameter (besides lateral jerk) for explaining a disturbance. The low-pass filtered lateral jerk is probably very well correlated to the peak-to-peak value of lateral acceleration. Suggestions were also made to analyse the whole length of measurement data, even those parts with no recorded discomfort markings. To do so, a time window of 2.56 5 was selected for different practical reasons. Within each time window the recorded Channels were evaluated. To reduce the influence of the mean lateral acceleration a 0.2 Hz high pass filter was used on the lateral
accelerations. Different low-pass filters were tested to compare which would give the best results. They were chosen to 1.5 and 0.6 Hz for lateral acceleration and to 0.6 and 0.3 Hz for lateral jerk. Table 1 below is a summary of the different Channels and parameters used for the evaluation of
discomfort.
Table 1 Parameters for the evaluation of comfort disturbances
Evaluated Channels Unit Parameters to be evalu2_1t_çd_Filt_e_rl / Notes
Lateral acceleration y [ni/52] mean LP2 1.5 Hz
Lateral acceleration y [in/32] peak-to-låeak3 BP4 0.2- 1.5 Hz and 0.2 - 0.6 Hz
Vertical acceleration
d2z/dt2 [rn/52]
Max.
LP 30 and 1.5 Hz
Jerk
dY/dt
[rn/S3]
Max.
BP 0.2 - 0.6 Hz and LP 0.3 Hz
Car body angle 6 [degree] Mean From tilting system computer Car body angle speed dO/dt [degree/s] Max.
Roll angle speed d(p/dt [degree/s] Max. LP 0.6 and 0.3 Hz, from gyroscope Roll angle acceleration d2(p/dt2 [degree/52] Max. LP 0.3 Hz
Train speed v [km/h] Mean
Push-button group 1(3)6 M1 (M3) Number time shifted 100 ms Push-button group 2(4) M2 (M4) Number time shifted 100 ms
Appendix 4 shows examples of both unfiltered lateral acceleration and filtered signals together with recordings of discomfort.
The main reduction of measurement data to evaluated files was done on the Time Record Acquisition and analysis System (TRAS), the measurement computer system at the SJ Laboratory. The evaluated files were then transferred to a Personal Computer (PC) where the final evaluation was done. The time window was doubled to 5 5 in this last stage. This was done to increase the maximum number of comfort disturbances in a time window from five to nine and to get a better correlation between discomfort and physical input.
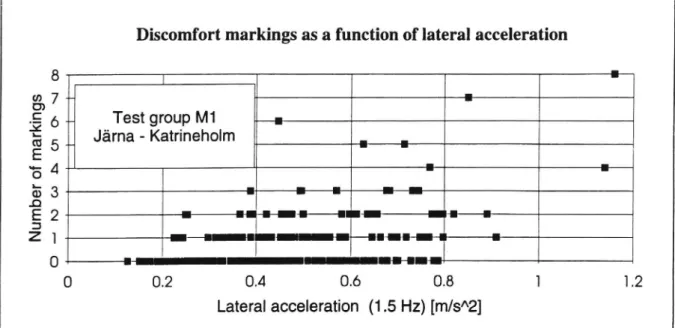
Figure 2 on next page is an example of evaluated data from the TRAS-system. It shows the number of comfort disturbances as a function of lateral acceleration (ñltered by 0.] - 1.5 Hz) for test group M1 between Järna and Katrineholm. The scatter of points is rather big but one can clearly see that there is a relation between number of markings and peak-to-peak lateral acceleration. The exact relation is however difficult to see.
1 About the filters.
30 and 1.5 Hz filters are 4 pole Butterworth 0.6 and 0.3 Hz filters are 2 pole Butterworth LP = low pass filter
3 The peak-to-peak value was evaluated as the difference between maximum and minimum values in the time window.
BP = band pass filter max = maximum value
Group 1, M 1 the first day and group 3, M3 the second test day
Rx) O N ' J I J Ä VTI Notat 71-1994 page 4
Discomfort markings as a function of lateral acceleration Test group M1 Järna - Katrineholm Num be r of ma rk in gs O -' M 00 b (I I 0 \l (1 ) 0.2 0.4 0.6 0.8 i i .2 Lateral acceleration (1.5 Hz) [m/s^2] O
Figure 2. Number of markings for comfort disturbance as a function of Iateral acceleration (yp_p) filtered by 0.2 - 1.5 Hz.
One way to improve this poor correlation between discomfort and physical input is to calculate the probability of comfort disturbance. The probability of comfort disturbances is here defined as the quotient between the number of markings with the push-buttons and the number of possible markings for a given physical input. The number of possible markings was set to five for every time interval of 5 seconds, indicating that all five persons in a group have pushed the button once. This is not always true, for five markings can be reached by two persons pushing twice, one persons once. In a similar
way, the number of markings with push-buttons within a time interval was reduced to five, if the
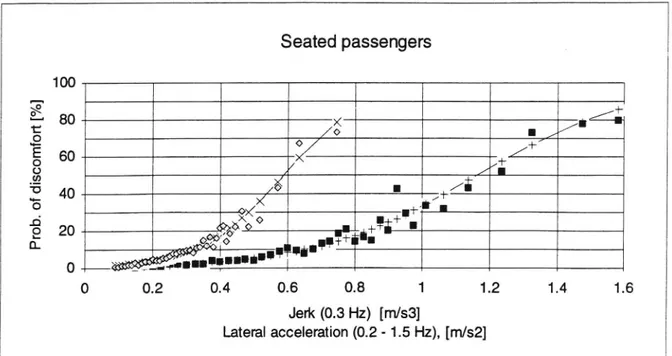
number was greater than five. An exponential regression curve was then calculated to fit the data. An example of the calculated probability of a comfort disturbance and a regression curve is shown in Figure 3 below.
Seatedpassengers
5100
E 80
E
8 60 (I)'-5 40
0. 20
8
Ok_ 0 0 0.2 0.4 0.6 0.8 1 1.2 1.4 1.6Jerk (0.3 Hz) [rn/53]
Lateral acceleration (0.2 - 1.5 Hz), [M32]
Figure 3. Probability of a seated passenger feeling a comfort disturbance caused by a strong Iateral jerk or Iateral acceleration. Exponential regression curves are drawn to show this correlation. The lateral acceleration (y - ) (black squares) is expressed as a peak-to-peak value in a time window of 2.5 5 and filtered by aband pass filter 0.2 - 1.5 Hz. The lateral jerk (grey diamonds) is low pass filtered 0.3 Hz.
VTI Notat 71-1994
3.3 Results
The main results from this study are a number of diagrams showing the probability of comfort dis-turbances. They are shown in Appendix 5 together with exponential regression lines. The regression coefñcients for the regression lines are shown in Table 2 below.
Table 2 Regression coefficients between the probability of comfort disturbances and physical input.
Coefficient for regression line y = a"=bX
Physical parameters Standing passengers Seated passengers
a b r- a b rg-Lateral acceleration (0.2 - 1.5 Hz) 0,73 72,44 0,93 0,76 39,80 0,92 Lateral acceleration (0.2 - 0.6 Hz) 0,79 1375 0,89 1,47 129,4 0,88 Jerk (0.2 - 0.6 Hz) 0,54 23,44 0,89 0,46 21,16 0,92 Jerk (0.3 Hz) 0,64 4510 0,87 0,58 4720 0,88 r2 regression coefflcient
One result is that both seated and standing passengers seem to have about the same sensitivity to low-frequency motions. This finding is contrary to earlier tests (SJ, BRR), where seated passengers are reported to have lower sensitivity. A possible explanation is the generally better ride comfort but also the fact that passengers expect higher comfort levels in modern trains.
Appendix 5 shows cross comparison between different filtered signals. Both filtered lateral acceleration and lateral jerk show highly correlated signals. This indicate a freedom to choose parameters for evaluation according to available equipment and also to choose a simple and effective calculation of passenger discomfort.
3.4 Further evaluation (1994)
The exponential regression line is very close to the data points up to 30 - 40 % comfort disturbance but above that the difference is growing exponentially. The probability of comfort disturbance is limited to 100 %, whereas the exponential regression line is not. One way to overcome this difñculty is to use logit regression. The logit line is defined as p(x) = eA+B*x / ( 1 + eA+B*X ). A new
regression analysis was made in 1994 using the statistical program SSPSfor Windows. One example of this new evaluation is shown in Figure 4 on next page. The results are very satisfactory with high agreement between the regression line and measured probability of comfort disturbances. Appendix 7 shows the new drawn diagrams and Table 3 one next page shows the calculated regression coefficients.
VTI Notat 71-1994
Seated passengers
á
80 60 40 20 Prob . of di sc om fo rt [°/ o] 0 0.2 0.4 0.6 0.8 1 1.2 1.4 1.6 .Jerk (0.3 Hz) [rn/53] Lateral acceleration (0.2 - 1.5 Hz), [rn/52]Figure 4. Probability of a seated passenger feeling a comfort disturbance caused by astrong Iateral
jerk or Iateral acceleration. Logit regression curves are drawn to show this correlation. The Iateral acceleration (VP- ) (black squares) is expressed as a peak-to-peak value in a time window of 2.5 3 and
filtered by a band3pass filter 0.2 - 1.5 Hz. The Iateral jerk (grey diamonds) is low pass filtered 0.3 Hz. Table 3 Regression coefficients for correlation between probability of discomfort and different
physical inputs as Iateral acceleration and jerk.
Coefficient for best fit line y = eA+B*X/(l+eA+B*x) Physical parameters Standing passengers Seated passengers
A B P A B P
Lateral acceleration (0.2 - 1.5 Hz) -4.94 4.75 1.00 -4.97 4.28 0.995 Lateral acceleration (0.2 - 0.6 Hz) -4.72 7.94 0.90 -4.13 5.34 0.14
Jerk (0.2 - 0.6 Hz) -5.09 3.25 0.999 -5.39 3.40 0.97
Jerk (0.3 Hz) -5.43 10.94 1.00 -4.85 8.26 0.998
P = observed significance level
The individual railway administration have to choose the level of comfort standard and also the level of probability of discomfort it will offer to passengers. It is also depending on the kind of trafñc in question, commuter-, local, regional- or intercity-traffic. Tables 4 and 5 below will show limit values yielding 20 and 40 % probability of comfort disturbance.
Table 4 Limit values yielding 20 % probability of comfort disturbance.
Parameter values yielding 20% discomfort probability
Standing passengers Seated passengers
Physical parameters mean 95% conf. limits mean 95% conf. limits
Lateral acceleration (0.2 - 1.5 Hz) 0.75 0.71 0.80 0.84 0.81 0.87 Lateral acceleration (0.2 - 0.6 Hz) 0.42 0.40 0.45 0.52 0.49 0.55 Jerk 0.2-0.6 Hz 1.14 1.08 1.22 1.18 1.14 1.22 Jerk 0.3 Hz 0.37 0.35 0.39 0.42 0.40 0.44 VTI Notat 71-1994 page 7
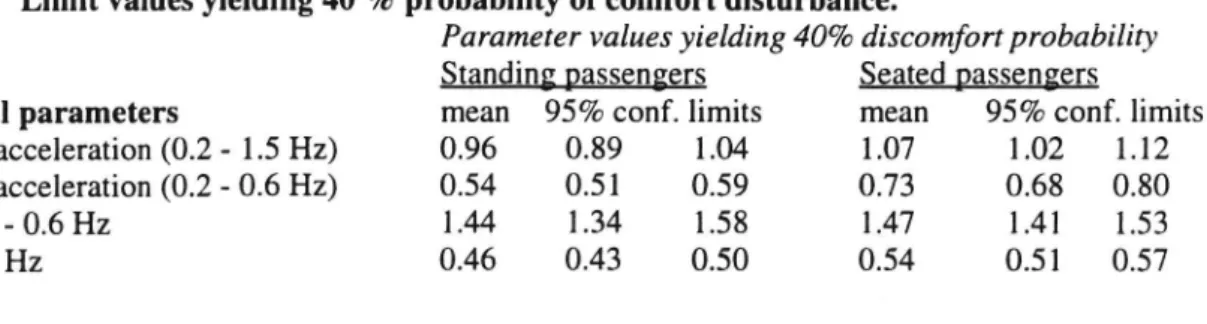
Table 5 Limit values yielding 40 % probability of comfort disturbance.
Parameter values yielding 40% discomfort probability Standing passengers Seated passengers
Physical parameters mean 95% conf. limits mean 95% conf. limits
Lateral acceleration (0.2 - 1.5 Hz) 0.96 0.89 1.04 1.07 1.02 1.12 Lateral acceleration (0.2 - 0.6 Hz) 0.54 0.51 0.59 0.73 0.68 0.80
Jerk 0.2 - 0.6 Hz 1.44 1.34 1.58 1.47 1.41 1.53
Jerk 0.3 Hz 0.46 0.43 0.50 0.54 0.51 0.57
4. CONCLUSION
Both the peak-to-peak value of lateral acceleration and the low-pass filtered lateral jerk can be used as indicators of comfort disturbances. The choice of method is a matter of convenience or equipment.
Further research is needed to transfer these limits into a standard for long-wave alignment
irregularities and transition curves. Such a transfer needs to take also the dynamics of the vehicle into account.
ÅCKNOWLEDGEMENTS
T0 SJ for their helpful co-operation and permission to publish this document.
HEFERENCES
Andersson, Evert and Nilstam, Nils. (1980) The development of advanced high speed vehicles in
Sweden. In Proc. of the IMechE, val. 1980, No 15.
Harborough, P. R. (1986). Passenger Comfort during High Speed Curving. Analysis and Conclusions British Rail Research BRR TR D05 017.
Harborough, P. R. (1986). Passenger Comfort during High Speed Curving. Summary Report. British Rail Research BRR TR D05 018.
Förstberg, J. (1993). Measurment of subjective comfort disturbances caused by long-wave alignment irregularities. SJ internal report. LR 9210-15m.(In Swedish).
Wichser, J. and Boesch. D. (1993). Die Druckknopfmethode, ein Hilfsmittel zur Erhebung des Fahrkomfortes. ETR 1993:42. H. Januar/Februar.
VTI Notat 71-1994
APPENDIX
Appendix Description
1 The results of early test with experimental train X15 (1979) 2 The layout of XZOOO and testing equipment
3 The recorded and evaluated Channels and parameters 4 page 1 Example of measured Channels and comfort disturbance 4 page 2 Example of ñltered signals
5 Results. Probability of comfort disturbances caused by low frequency motion. 6 Cross-comparison of ñltered signals
7 Results. Probability of comfort disturbances caused by low frequency motion.
New evaluation.
VTI Notat 71-1994
Reaction' probability Reaction probability Reaction probability Appendix 1.
Results from test With X15 (1979)
O/O Reaction probability as function of mean lateral acceleration
50 4
.
f standing40 *
I Sitting30
-'°-20 i.
10
-g-0
;
;
I
i'
i
i
i
i _
i
0,8 0,9 1,0 1,1
1,2 1,3 1,4 1,5 7,6
Lateral acceleration (In/52) (mean over 1 s)
A walking Reaction probability
0/ as function of lateral jerk
0
50 I
40 I
, Sitting .\ X jo 'I // 20 ._ ' standing0"-1'J\(
1:,:::'111
0,3 0,L: 0,5 0,6 0,7 0,8 0,9
17
2
Lateral jerk (In/S3)(low pass filter 0.3 Hz)
0/0 Reaction probability as function of roll angle velocity
50
--40 »
30
*-20 A walking TO J /. 0 standing ...1. \r : : 1 A i0
3
4
5
6
Me llan va gn -tçum r vñ' E ga m r q rüü 4 . Te st gr oup M1, M3 r _ i _ yk b6 zk b6
?
m
a
m
a
ro-'i
m-a"
rum
-m
mm
..
.
'E jgäa áåi äfåg äg g Ju (M QI. M I D u 1 K LA S Srå:
IR 51 PL 2 KL AS S 10 + 2 9 P L ME LL AN VA GN MA NO VE RV . AC N B i s t r o -M e a s ur e m e n t c ar Te st gr oup M2 , M4i ro ll an gle sp ee d y ca r bo dy an gl e 8 -I Kl a n SI Pl (1 7. 71 ) 8 -2 Kl on l 2 3 7 Pl (5 2. 31 ) A n d d ( O hm 1 K l a n. (2 ) 51 ) nu..._..a-ço_o-a --.'...ø I '-2 K l an
n'1
;V
N,
EB
EB
HE
EW
HM
H
A
*d
är
ma
aa
aa
aa
aa
af
m
1
(1 6. 91 )E
'
B
E
B
B
W
W
H
H
E
H
E
I
BB
B
.'
Aa
nE
HE
äE
QH
EH
BE
BB
BB
IB
Bü
nääåg
iu
_-2 K L A S S 80 PL 2 K L ASS 80 PL 2K L A S S 48 PL '5 3% 'n ä- *-2 Appendix 2 H ' IRecorded parameters
Appendix 3.
Recorded Channels on tape recorder and digitised by TRAS-computer
Channel Parameter unit Notes
1
Acc Zkb6
m/s2
2
Acc ka6
m/s2
3
Acc Zkb8
m/s2
4
Acc ka8
m/s2
5 M1 6 M2 7 Fi degree 8 dFi/dt degree/s 9 Speed km/h 1001 Km pole Evaluated parameters.Vertical acceleration over bogie # 6, (car # 3)
Lateral acceleration over bogie # 6, (car # 3) Vertical acceleration over bogie # 8, (car # 4) Lateral acceleration over bogie # 8, (car # 4)
Push button channel 1, group in car # 3
Push button channel 2, group in car # 4
Digital signal
Carbody tilt angle. car # 4 (from tilt controlling computer) Gyroscope, roll angle velocity
When evaluation with TRAS-computer following records for storing the results was created. For each 2.56 5 of recorded measurment, one value for each evaluating channel was stored in respective evaluation record.
Ch. Parameter Evaluated value Filter Notes
1 Lat acc car # 3 peak to peak 30 Hz 2 Lat acc car # 3 peak to peak 0.2 - 1.5 Hz 3 Lat acc car # 3 peak to peak 0.2 - 0.6 Hz
4 Lat acc car # 3 mean 1.5 Hz Steady state acc.
5 Lat jerk car # 3 max. 02 - 0.6 Hz
6 Lat jerk car # 3 max. 0.3 Hz
7 Lat acc car # 4 peak to peak 30 Hz 8 Lat acc car # 4 peak to peak 0.2 - 1.5 Hz 9 Lat acc car # 4 peak to peak 0.2 - 0.6 Hz
10 Lat acc car # 4 mean 1.5 Hz Steady state acc
11 Lat jerk car # 4 max. 02 - 0.6 Hz
12 Lat jerk car # 4 max. 0.3 Hz
13 Vert acc car # 3 peak to peak 30 Hz 14 Vert acc car # 3 peak to peak 1.5 Hz
15 Ven acc car # 4 max 30 Hz
16 Vert acc car # 4 max 1.5 Hz
17 Carbody tilt angle mean
18 Tilt angle speed max change/ s
19 Roll angle speed max 0.6 Hz Gyroscope
20 Roll angle speed max 0.3 Hz Gyroscope
21 Roll angle acc. max 0.3 Hz Gyroscope
22 Push button ch 1 number of markings Car # 3, time shifted 0.1 5
23 Push button ch 2 number of markings Car # 4, time shifted 0.1 s
24 Speed mean
25 Distance
Bilaga 4 C o m f o r t r b a n c
V e r t i c a l a c c . L a t e r a a c c .
M1
'
Zkb
ö
ka
s
n O C . . Ca r bo dy an gl e R0 an g e sp ee '1 00 S p G B d ()Gyr
o
Appendix 4
Jmfort disturbances measurements Järna - Katrineholm Page 2
ast l. _ 92-05-20 11:52:31
._4\_.-. .-....v- . -..07. ._< *sonens-on* -u-.'Mo.øa. .45..pa .--TM._-. ...nu o-...apcøcgw .-§_aTw-so.wa...--54 '.05- i^-'- :::::'°°-'-- .Div-1... --.01
1,-1mfganu-u--«-j- l l -m-w-w - : Ace-kañl _ ; f i \ . . d 1 i . ' ; O O _;_Lateral accelergtion VW _ l 1 ' 3 . : I 5 I
1
3
!
IFiltered_30 Hz_J
' 1 L, W.ui_-_i..___.._._.;-..___-,W,-.. .-..--..-_._.. _ .i 15..-... i- .- L: . 21..: I O . 5 77/32 , . , hp3 'Y'K : g Lateral acceleqation ; å : // \ 4//L\T:L /\\ / \l. //\\ /J\\ //\ //\\\ å 0.0-:4:<:7 (L//' : \\/ '§37 §\\//'\7 \V/ { \ / \\/ \q 1 ._ l i i-
5
i
1
F ltered 0,2-1,3Hz
_ ä 1 0.4 fvsg ! § i ACC kaså 0.2 2"tateral acceleration * _'__"_- i' "' i 0'0 _ \*\ø//W Y:\\/// i\»/ \\///^V/ 1 ' J --0 . 2 v _....1*
x
. MM...Mim...,MMHEEJEEPEFLQaâ:0.2 '§12'
_ i l:zicisgttms -
8,
:
Im
3
0.0 i
!
I
I
i
1
i
J
TJ .VLVIT LH:::L___1
1070. 1072. 1074. 1075 1078. 1080.TRAS-A SJ Maskindivisionen Laboratoriet Time S
jmfort disturbances measurements Järnao- Katrineholm est l.
..4_ F__ ___ 22195-20 11:52: 1
1 '73777492 i' - -- 4»- -. 4-.. __WCHROE_
"
1
g
Lateral accele ationf. m 1 AL_
5
5
'I! U
ITMM MW ?MM/_if_
' hmJAR?
JM 4%',
W WAWWWWWWWW
< 11
-1.
WWW
g
1
2' _T/53 I Uateral jerk YKDE 0.6 H2
1 . i _..-. .5
r
-1.
O . 5 bm/s3 L%teral Jerk A YKDS 0.3 H2
1_ 0.4 -__L i
0 ' 2
_
/
\K
- __ f\ MV/ w / W W 0.0 _ WH M \/ iW -0.2 i_ 5 . M 1 Push-buttons markings [IIL0.0
1
r
1
i
1
.EEIHñL1Ef W .4
1070. 1072. 1074. 1075. 1078. 1080.Appendix 5
Comfort disturbances
Page 1
Probability of a comfort disturbance caused by lateral acceleration Sum over all tests
Standing passengers
100
+
90 / 80 / 70 / 60 / 5040
/+/ '
30 .7 I /+ I20
ir
:5+
10
.11!"
Ilm!+'
0 ___mu'
;
0 0.2 0.4 0.6 0.8 1 1.2 1.4 Lateral acceleration (p-p, 0.2 - 1.5 Hz) [m/s^2] Pr ob . di sc om fort [°/ o]Standing passengers
100 Pr ob . of di sc om fo rt [°/ o] (1 1 C) I 0 0.1 0.2 0.3 0.4 0.5 0.6 0.7 0.8 Lateral acceleration (p-p, 0.2 - 0.6 Hz) [m/s^2] SJ/MKL 1992, VTl 1994Appendix 5
Comfort disturbances
Page 2
Probability of a comfort disturbance caused by lateral jerkSum over all tests
Standing passengers
100 90_ 80
§- 70
.êE 60
8 50
/ '
(I).6
5 40
/H
än 30
'ø
D. // 20 xa/'
10
MI/Q/
0 M' 0 0.2 0.4 0.6 0.8 1 1.2 1.4 1.6Lateral jerk (O.2-O.6 Hz) [m/s^3]
Standing passengers
100 I 90 X .-. 80 iså 70
g
/-
><
-*g 00
'
/ '
o F/X8 50
x
/
5
5 40
f/
-Q
' I I 'á 30 L. , CL .I J/ 20 i QV i . ><5\.I10
N,
'QX
0 -_M\ % W0
0.1
0.2
0.3
0.4
0.5
0.6
0.7
0.8
Lateral jerk (0,3 Hz) [m/s^3] SJ/MKL 1992, VTl 1994Appendix 5
Comfort disturbances
Page 3
Probability of a comfort disturbance caused by lateral accelerationSum over all tests
Seated passengers
100 90 ._. 80 I \° I57 70
/+
.å
E 00
/
/
8
I
.9 50
+
'c
_
/.
'5 40
+
få 30
I+'!/.
0-
' ++I
.
20
:la-l'+-
;
10
O __'IQI-_u- 115+
0 0.2 0.4 0.6 0.8 1 1.2 1.4 1.6 Lateral acceleration (p-p, 0.2 - 1.5 Hz) [m/s^2] iSeated passengers
100
90
J:
F
__ 80
T
;
oxo
-
i
:
E' 70
I_:
*9 00
i
seg
50/;
i
%
/
g
5 40 /I/Xg 30
X
0_ ,0% g 20 I ?xxx/ä ' i10 .
i
LI..
N
0 4h
inr-"f"> 5
E
4
0 0.1 0.2 0.3 0.4 0.5 0.6 0.7 0.8 0.9 Lateral acceleration (p-p, 0.2 - 0.6 Hz) [m/s^2] SJ/MKL 1992, VTI 1994Appendix 5
Comfort disturbances
Page 4
Prcbability of a comfort disturbance caused by lateral jerk Sum over all tests
Seated passengers
100 90F__ 80
0\0 X I '- 70 I tå
/x/
-8 50 , '-5 ii 5 .d ' I 52 0_ 1.5 2 2.5 Lateral jerk (0.2 - 0.6 Hz) [m/s^3]Seated passengers
100
I
90_ 80
oxo
Å
-TE' / I 0
E 60
l
/
8 50 (I) /5
X
.
"5 40g 30
\
I
; 1 0 0.1 0.2 0.3 0.4 0.5 0.0 0.7 0.8 E i Lateral jerk (0.3 Hz) [m/S^3]I
SJ/MKL 1992, VT| 1994Appendix 5
Comfort disturbances
Page 5
Probability of a comfort disturbance caused by vertical acceleration
Sum over all tests
Standing passengers
1 00 90 80 I 50 40 I 30 [1 I I . 20 I I I I.. I I 10 II-if. : ' f ' . . +I'wF-"7"" .77' 9* -T
F I Pr ob . ofdi co mf or t [°/ o]0 0.2 0.4 0.6 0.8 1 1.2 1.4 1.6 1.8 2 Vertical acceleration (1.5 Hz) [m/s^2]
Seated passengers
1 00 90 80 70 60 ; I 50 3 40 I I Pr ob .0 f di sc om fo rt 30 'I I 20 .I I I I-I-+-'- I-I I - __ . I __ 10 I In... .Wi I I I 0 0.2 0.4 0.6 0.8 1 1.2 1.4 1.6 1.8 2 Vertical acceleration (1.5 Hz) [m/s^2]SJ/MKL 1992, VTI 1994
Appendix 5
Comfort disturbances
Page 6
Probability of a comfort disturbance caused by Iateral accelerationComparison between standing and seated passengers
Comparison standing and seated passengers
1 00 90 80 _I_ Standing 70 60 50 40 30 20 i 0 _9-_ Seoted Pr ob . of disc om fo rt [0 /0] 0 0.2 0.4 0.6 0.8 1 i .2 Lateral acceleration (p-p, 0.2 - 1.5 Hz) [m/s^2]
Comparison standing and seated passengers
100 90 80 + Standing / 70 *_9_ Seoted / (30 50 40 30 Pr ob .o f di sc om fo rt [°/o] 20
10
i
0 0.1 0.2 0.3 0.4 0.6 0.6 0.7 0.8 Lateral acceleration (p-p, 0.2 - 0.6 Hz) [m/s^2] SJ/MKL 1992, VTI 1994
Appendix 5
Comfort disturbances
Page 7
Probability of a comfort disturbance caused by lateral jerkComparison between standing and seated passengers
i 00 90 80 70 60 50 40 30 20 i 0 Pr ob .of di sc om fo rt [ %]
Comparison standing and seated passengers
_I_ Standing _9_- Seoted 0.2 0.4 0.6 0.8 i i .2 1.4 1.6 Latera] jerk (0.2 - 0.6 Hz) [m/s^3] i 00 90 80 70 60 50 40 30 Pr ob . of di sc om fo rt [% ] 20
10.
Comparison standing and seated passengers
_I_ Standing
_tå_ Seoted
0.1 0.2 0.3 0.4 0.5 0.6
Lateral jerk (0.3 Hz) [m/s^3]
Appendix 6
Comfort disturbances
page 1
Correlation between Iateral accelartion and Iateral jerkFrom test nr 1.
Correlation lateral acceleration, different filters
.0 O\ \4 [m /s ^2 ]
0
.
0
.
0
.
o
o
o
BJ OJ .5 . CD La te ra l ac c (p -p , 0. 2-0. 6 Hz) - _ -I CD 0 0.2 0.4 0.6 0.8 i i .2 Lateral acceleration (p-p, 0.2 - 1.5 Hz) [m/s^2]Correlation lateral acceleration - lateral jerk
0.2 0.4 0.6 0.8 i 1.2
Lateral acc (p-p, 0.2 - 1.5 Hz) [m/s^2]
C3
Correlation lateral acc - lateral jerk
0 0.2 0.4 0.6 0.8 i 1.2
Lateral acc (p-p, 0.2 - 1.5 Hz) [m/s^2]
Appendix 6
Comfort disturbances
page 2
Correlation between Iateral accelartion and Iateral jerk From test nr 1. Late ra l je rk (0 .2 -0 .6 Hz) [m /s ^3 ] .D 00
.0
.0
9
1.8 '0 1.4 -a ixa CD hå I> Ch 0.1Correlation Iateral acc - Iateral jerk
0.5 0.6 0.7
0.3 0.4
Lateral acc (p-p, 0.2 - 0.6 Hz) [m/s^2]
0.2
Correlation Iateral acc - Iateral jerk
-
.wrap-un-0.3 0.4 0.5 0.6 0.7 .
Lateral acc (p-p, 0.2 - 0.6 Hz) [m/s^2]
0.2 0.4
Correlation Iateral jerk, different ñlters
1.4 1.6 1.8
0.6 0.8 1 1.2
Lateral jerk (0.2 - 0.6 Hz) [m/s^3]
Appendix 6
Comfort disturbances
page 3
Correlation between Iateral and vertical accelartion From test nr 1.
Correlation vertical - Iateral acceleration
i .2 I I l RT < Q å i
§7
m.
I
'
E I i o i 0 i CU Tu I .9t ii (D ? > i 0 0.2 0.4 0.6 0.8 i i .2 1.4 Lateral acceleration (0.2 - 1.5 Hz) [m/s^2]Correlation vertical - Iateral acceleration
2.5 : i . E ' å
-Ve rt ic al ac c. (3 0 Hz) [m /s ^2 ]0 0.5 i i .5 2 2.5 3 3.5 Lateral acceleration (30 Hz) [m/s^2] ,_ . 4 . . -_ . _ _ _ . _ _ .--. .A .. 4.5 SJ/MKL 1992, VTI 1994
Appendix 7
Comfort disturbances
Page 1
Probability of a comfort disturbance caused by lateral accelerationSum over all tests
Standing passengers
100 90 +80
/1
:35 / E' I// 9- 60 '+ E / 8 50 m +--
/
-o I5 40
+/
.23'e 30
1/
0- I / I .nu10
.45?!
0 ___Mu I' 0 0.2 0.4 0.6 0.8 1 1.2 1.4 Lateral acceleration (p-p, 0.2 - 1.5 Hz) [m/s^2]Standing passengers
100 i 90 '0;5" 80 x_-ZI' 70 I5
g 60
/
X/
8
J/i/
i, 50 '0 X I ».- 40o !/ -g X/!/V5- 20
ky
/ - I10
«
kr* |
*åxå/itä '1
I
0
1
0 0.1 0.2 0.3 0.4 0.5 0.6 0.7 0.8 Lateral acceleration (p-p, 0.2 - 0.6 Hz) [m/s^2] SJ/MKL 1992, VT| 1994Appendix 7
Comfcrt disturbances
Page 2
Probability of a comfort disturbance caused by Iateral accelerationSum over all tests
Standing passengers
100 90 80"a"
i 70
B
E 008
' E
.92 50 i 'o 5 40 1 /I .d9 30
- X/0_
//X
20
/>_<
.
V4 10 !. ..r*/0
anslag-"'i'*$' *
0 0.2 0.4 0.0 0.8 1 1.2 1.4 1.0 Lateral jerk (0.2 - 0.6 Hz) [m/s^3]Standing passengers
100 4 90 X X 4 ,__.,o\0 80 / Q /:7 70
X
-ö /*g 00
1
x
I
8
Y
g 40
M
. I.5 30
l
a- 20
.XXX l
än ><ätI 10 O _ _ \\ % 0 0.1 0.2 0.3 0.4 0.5 0.6 0.7 0.8 Lateral jerk (0.3 Hz) [m/s^3] SJ/MKL 1992, VTI 1994Appendix 7
Comfort disturbances
Page 3
Probability of a comfort disturbance caused by Iateral acceleration Sum over all tests
Seated passengers
100 90 + 80 I:5
I //i
:' 70 +/.Lö
E 60 +/
0 /so
/ '
'c 5 40 . /+/. ./-§3 30
.rt-F'
o_
5+* .
20
I.:Zi+_.
--+'+' '
10
...s-ii
0 _ E ulf-.Ii 0 0.2 0.4 0.6 0.8 1 1.2 1.4 1.6 Lateral acceleration (p-p, 0.2 - 1.5 Hz) [m/s^2]Seated passengers
100 90 f_ 80o\°
I
-: 70 T_ .5 60 X_å
' //
1, 50 X,3 40
°.
.-X
X/
.23e 30 X/PX O. /X/i/ 20 . /,\/X,)|(, I I I .ID /X/X . . I "!<l !'!!0
le
0 0.1 0.2 0.3 0.4 0.5 0.6 0.7 0.8 0.9 Lateral acceleration (p-p, 0.2 - 0.6 Hz) [m/s^2] VTI 1 994Appendix 5
Comfort disturbances
Page 4
Probability of a comfort disturbance caused by Iateral jerk Sum over all tests