RISK OF ACCIDENTS DURING DARKNESS ON ROADS WITH
DIFFERENT TECHNICAL STANDARDS
Stanislaw Gaca, Mariusz Kiec
Cracow University of Technology, Institute of Road and Railway Engineering, Warszawska 24,31-155 Cracow, Poland
Phone: +48 126282320 Fax: +48 6282328 E-mail: sgaca@pk.edu.pl
ABSTRACT
The paper presents a study of traffic accidents on Polish network of national and regional roads. The analyses were designed to identify the main factors which may affect the occurrence of road accidents during visibility restrictions in darkness. This problem is important, because despite a much smaller traffic volume during the night, there is a relatively greater number of accidents in reference to traffic. In recent years, on national roads about 39% of all accidents took place during insufficient roads lighting conditions, i.e. night, dusk and dawn. The share of fatalities in that period was about 54%, while the share of traffic, which is the measure of risk exposure during that period, was approximately 29%. A significant increase in the proportion of fatalities is associated with pedestrian traffic because more than 40% of accidents on roads in built-up areas during insufficient lighting involved pedestrians, despite their potentially low share in the traffic during the night. Particularly unfavorable period of the year is the winter season, including a period of time change, when the adverse lighting conditions duration is extended. The risk of fatalities on national roads at night-time is about 4-times higher on rural roads and about 2.5-times higher on roads in built-up areas when compared to daytime.
Therefore a number of studies aimed to identify factors and their impact on the increased risk of accident during night-time and darkness on roads of different technical standards. The study distinguished two groups of roads: national roads, which mainly carry traffic between major cities with a high share of through traffic, higher geometric standard and better infrastructure, and regional roads. Regional roads serve mostly local, less intensive traffic and are characterized by lower geometric parameters. The analysis covers rural sections and roads passing through built-up areas without cities, which usually have adequate artificial lighting.
The study analyzed national and regional roads sections with a total length of about 47,000 km, and approximately 90,000 accidents in years 2005-2009. This paper presents the following issues:
• identifying the main factors related to road infrastructure which may affect road safety during darkness for various types of roads and locations,
• assessment of accident risk during the darkness based on accident rates taking into account the impact of traffic changes during the day and year. Also, the results of analyses with application of odds ratio are presented. The comparisons included the accidents which took place during the lack of natural light and during daylight,
• assessing the impact of road infrastructure on road safety based on accident prediction models that were developed for selected sections of the road network, with a high concentration of accidents during darkness.
1 INTRODUCTION
One of many environmental factors which considerably affect road safety are lighting conditions. Over 30% of all accidents on Polish roads occur during insufficient lighting conditions, i.e. darkness, dusk or dawn. Fatalities of these account for about half of total road fatalities. Traffic volume, which is the basic variable of risk exposure (Elvik et al., 2009, Hermans et al., 2006) in darkness accounts for only 22% of Annual Average Daily Traffic –
AADT. These proportions are similar to those reported in other countries (Elvik et al., 2009).
An increase in road safety risk during darkness is mainly due to worsened road perception and motoric skills, as well as worse drivers' concentration at night-time (Fors, Lundkvist, 2009, Schlag et al., 2009), caused by visibility restrictions.
Road lighting conditions greatly affect the accident risk in darkness (Elvik et al., 2009, Wanvik, 2009, CEDR, 2010). They improve road area perception and are the most frequently analysed factor influencing road accidents in darkness. Other factors include weather conditions, road surface conditions, drivers' fatigue, location (urban and rural roads, intersections, section of roads), to name a few (Johansson et al., 2009). A greater share of drinking-and-driving drivers as well as young, inexperienced and easily distracted drivers is observed during darkness. Most studies estimate relative changes, not only referring to the number of accidents but also to the severity and types of accidents and their participants, especially pedestrians. Statistical road accidents data analysis clearly confirms an increased road accidents risk in darkness. The highest ratio of darkness to daylight accidents risk is the case of pedestrian accidents – even 7.4-times higher risk, whereas in other accident group it is 4.6. Also the severity of accidents increases significantly in darkness (Johansson et al., 2009).
There is relatively limited knowledge of infrastructural road solutions, including road lighting conditions, which affect road incidents. Most of the studies focus on the influence of various geometric and infrastructural factors, like road and shoulders widths, cross-section type, type of crossroads, bends parameters (radius, deflection angle), curvature in relation to road safety. They hardly ever examine their influence in different daylight and darkness periods or lighting conditions (Elvik et al., 2009; Lamm et al., 1999; Lippold, 1997; TRB, 2001, TRB, 2012, Vieten et al., 2010).
Such an approach results from the belief that with improving technical standards of roads, road accidents are mainly affected by human factors. Therefore, having reached a certain road infrastructure standards, further improvement in road safety can only be achieved by drivers’ education and raising their awareness and affecting their behaviour with preventative and repressive actions. Obviously, road and driver's behaviour interactions are also evaluated and with that in mind, it can be said that infrastructural solutions can also significantly improve the road perception in darkness. Identifying those most crucial road elements affecting accidents risk in darkness, is as a basis for mastering road infrastructure designing. Such a study was carried out in Poland by the authors of this work, where only single roadway road sections in rural and small town areas were evaluated. City streets, which are mostly sufficiently artificially lit, were excluded. Two groups of roads were identified, i.e. national roads with through traffic and regional ones, with lower traffic volume and a different function (with a high share of local traffic). National roads are mostly of good technical standards and infrastructure, while regional ones are usually of lower technical standards. Winter season is an especially adverse time of the year, when with Daylight Saving Time (DST) transitions both unfavourable lighting conditions duration and traffic volume increase.
An increase in fatalities is directly linked to pedestrians, since over 40% of pedestrian crossings accidents in towns and villages in insufficient road lighting involve pedestrians, though their share at night-time (or darkness) is potentially low.
The study analysed national and regional roads sections with a total length of about 47,000 km, and approximately 90,000 accidents in years 2005-2009.
2 METHODS OF ANALYSES
The study on influence of darkness on road safety due to visibility restrictions included two stages:
• First stage covers relative accident risk assessment by comparing types, causes and locations of accidents at different times of day and night,
• Second stage covers an attempt to identify infrastructural factors affecting road accidents. To achieve that, own regression models to estimate road accidents rates were used. These models are based on data collected on homogeneous sections of roads classified as ”dangerous”, i.e. with frequency of accidents in darkness exceeding the average values. In both cases, national and regional roads were differentiated for evaluation. Thus, the estimation of influence of technical standards of design and road infrastructure on road safety in darkness was facilitated.
2.1. Assessing the risk of accident associated with darkness
In order to assess accident risk associated with darkness, methods based on an odds ratio and an accident rate ratio, were used. Detailed description of application of these methods is provided in (Elvik et al., 2009). The analyses were carried out in correspondence with well-known risk assessment methods, suggested in the following studies (Sullivan, Flannagan, 1999; Sullivan, Flannagan, 2001; Sullivan, Flannagan, 2002; Sullivan, Flannagan, 2003), and later developed by (Johansson et al., 2009).
In the analysis the method of an odds ratio was used to eliminate the influence of traffic volume variety by comparing the number of accidents in pairs at specified time periods (hours), regardless of the traffic volume. Moreover, results of accident rate ratios were estimated basing on the share of traffic volume in specified hours of the day and night. In order to do so, an extensive database of 488 test sites all over Polish national and regional roads network was used (Gaca et al., 2003-2008).
Using the data of road accidents and traffic volume shares in specified hours of the day and night, the authors made an attempt to estimate a relative accident risk in darkness and night-time (accident rate ratios) for different night-time periods of daylight and darkness. It is crucial to select suitable periods for the comparison and these are determined by the accidents data availability. For further analyses a constant and an average period of daytime and night-time or daylight and darkness were defined.
The selection of time intervals for road safety risk analyses
Based on Sullivan and Flannagan’s paper (Sullivan, Flannagan, 1999), seasonal variations of natural lighting as well as Daylight Saving Time (DST) transitions in March and October were taken into consideration when selecting the time intervals for road safety risk analyses. The hour and month periods for the analysis are based on sunrise and sunset times for 52°15’ North latitude and 21°00’ East longitude (Warsaw). In the first stage, only the time periods
with night-time or daytime throughout the whole year were selected. Figure 1 shows the optimal (for the analysis) time intervals selection with night-time or daytime only, regardless of the season of the year. For night-time period the time between 22:00 and 4:00 was selected, whereas for daytime it was 8:00 – 15:00. Such an approach ensures a suitable correlation between accidents and the time of the day or night. However, it restricts their number in the analysis and that is why attempts were also made to estimate an average daytime and night-time, including the actual sunrise and sunset times, significantly increasing the number of the accidents included in the analysis (especially in darkness).
00:00 01:00 02:00 03:00 04:00 05:00 06:00 07:00 08:00 09:00 10:00 11:00 12:00 13:00 14:00 15:00 16:00 17:00 18:00 19:00 20:00 21:00 22:00 23:00
01-sty 01-lut 01-mar 01-kwi 01-maj 01-cze 01-lip 01-sie 01-wrz 01-paź 01-lis 01-gru
hour month zachód wchód sunset sunrise 01 02 03 04 05 06 07 08 09 10 11 12
Figure 1: Selection of an hour periods of ''day” and ''night” times based on variable sunrise and sunset times throughout year.
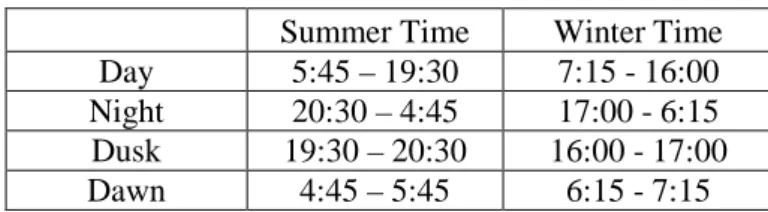
To define the times of ''day” (daytime only) and ''night” (night-time only) a 15-minute accuracy is used, as well as summer and winter times. Table 1 illustrates periods of specified lighting conditions depending on the season of the year, according to the assumptions above.
Table 1: Periods of specified lighting conditions depending on the season of the year.
Summer Time Winter Time
Day 5:45 – 19:30 7:15 - 16:00
Night 20:30 – 4:45 17:00 - 6:15
Dusk 19:30 – 20:30 16:00 - 17:00
Dawn 4:45 – 5:45 6:15 - 7:15
In order to make a relative estimation of road safety risks applying an odds ratio, the methodology described by (Johansson et al., 2009) was used after an appropriate modification to accommodate for Poland's geographical location, hence the day and night lighting conditions change. The modification was designed to achieve the highest possible accidents sample size by extending the analysed and compared time intervals, and also to eliminate the
in-between, intermediate, light periods of dusk and dawn. This way three time intervals, illustrated in Figure 2 and Table 2, were selected for the analysis.
Table 2: Selection of risk estimation cases with an odds ratio method.
Analysis hours Comparison hours Summer time Winter time
Case 1 5.00-6.00 8.00-15.00 11.05-31.07 12.11-31.01
Case 2 17.00-19.00 8.00-15.00 11.05-31.07 12.11-31.01
Case 3 18.00-19.00 8.00-15.00 1.05-31.08 1.11-28.02
As Figure 2 illustrates, the cases differ one from another in terms of analysed times, both in daylight and darkness, as well as season of the year aspects. Comparison hours in all three cases were the same during the day, but in the third case the analysed time during the year was longer. The second case comprises a two-hour analysed period during the day, whereas the first and the third case comprise only one hour.
00:00 01:00 02:00 03:00 04:00 05:00 06:00 07:00 08:00 09:00 10:00 11:00 12:00 13:00 14:00 15:00 16:00 17:00 18:00 19:00 20:00 21:00 22:00 23:00 01 -s ty 11 -s ty 21 -s ty 31 -s ty 10 -lu t 20 -lu t 02 -m ar 12 -m ar 22 -m ar 01 -kw i 11 -kw i 21 -kw i 01 -m aj 11 -m aj 21 -m aj 31 -m aj 10 -cze 20 -cze 30 -cze 10 -lip 20 -lip 30 -lip 09 -s ie 19 -s ie 29 -s ie 08 -w rz 18 -w rz 28 -w rz 08 -pa ź 18 -pa ź 28 -pa ź 07 -lis 17 -lis 27 -lis 07 -gr u 17 -gr u 27 -gr u ho ur month zachód wschód
Case 1 Case 2 Case 3
sunset sunrise
01 02 03 04 05 06 07 08 09 10 11 12
month
Figure 2: Selection of an hour periods for relative analysis including an odds ratio with respect to sunrise and sunset time variations throughout the year.
Estimates of relative risk in road safety associated with darkness
All formulas used for calculating relative risks associated with darkness are presented below. In the analysis of the effects of restricted visibility associated to darkness on road accidents the following accident rate ratios were defined:
• an hour relative risk ratio Dh obtained according to the following equation:
where:
Acci – number of accidents in the analysed hour in the analysed period,
STVi – share of traffic volume of the specified hour during the day [%],
i = 1,2,…,24.
This ratio defines the accident risk in the specified hours of day and night. The percentage share of traffic volume in the specified hour with respect to the whole day and night period is used as the exposure risk variable;
• ''night-time'' relative risk ratio Dn/d obtained according to the following expression:
where:
Acc 22-4 – number of accidents in the night-time period, hours 22:00-04:00,
Acc 8-15 – number of accidents in the daylight period, hours 08:00-15:00,
STV 22-4 – share of traffic volume in the period of night-time, hours 22:00-04:00 [%],
STV 8-15 – share of traffic volume in the period of daylight, hours 08:00-15:00 [%].
This ratio defines the accident risk in the night-time period with respect to daylight period. The percentage share of traffic volume in night-time and daylight is used as the exposure risk variable;
• ''accident'' relative risk ratio Dacc_night/acc_day obtained according to the following expression:
where:
ACCnight – number of accidents classified as night ones according to “traffic accident report”,
Accday – number of accidents classified as daylight ones according to “traffic accident report”,
STVnight – mean traffic share in the darkness [%]
STVday – mean traffic share in the daylight [%]
This ratio allows to implement a different approach and it was obtained in order to compare the increased risk values during darkness periods, obtained according to the ''night-time'' ratio, as shown in equation (2).
This ratio was obtained using all accidents classified as “night” or “day” ones as described in the police database with respect to lighting conditions (traffic accident report). In order to simplify the calculation, an average traffic share in darkness and daylight – estimated by the authors – was used.
• ''seasonal'' relative risk ratio in darkness with respect to season of the year:
where:
Accdarkness – number of accidents in darkness in the analysed year period,
Accdaylight – number of accidents in daylight in the analysed year period,
STVNdarkness – average traffic share in darkness in the analysed period [%],
STVNdaylight – average traffic share in daylight in the analysed period [%],
(2)
(3)
i – season of the year: summer, winter.
The seasonal ratio is suggested to analyse risk of accidents in darkness in comparison to the daylight ones, with respect to the season of the year. It was obtained by applying average traffic share values in darkness or daylight. The total numbers of accidents in time intervals and hours were used according to the time periods, are shown in Table 1.
In case of darkness period risk estimates, developed by the odds ratio method (Wanvik, 2009, Johansson et al. 2009), it is possible to estimate relative risk changes excluding the traffic share risk exposure factor. Seasonal and day variations are identified by applying an odds ratio with respect to specified analysis periods and comparison period (see Figure 2 and Table 2). The odds ratio estimate is then obtained as follows:
For all estimates of ratio cases their confidence intervals were obtained (95%) including variability of the phenomenon described, according to (Elvik et al., 2009) .
2.2. Identifying infrastructural factors affecting the risk of road accidents
associated with darkness
Identification of infrastructural factors affecting the risk of road accidents associated with darkness was conducted for hazardous road sections by applying well-known regression model building methods.
General model is presented by the following equation:
) .... exp( 0 3 3 4 4 2 1 n n a a Length a a x a x a x AADT ACC= ⋅ ⋅ + ⋅ − ⋅ + + ⋅ where:
Acc – number of accidents,
a0, a1, …, an – unknown model parameters, direction coefficients at the variables,
x0, x1, …, xn – non-random independent variables observed
In the model a transformation of independent variables AADT and Length into xi=ln(AADT)
and xi=ln(Length) has been performed. (Ripcord 2008).
Regression analyses were conducted for comparison purposes, both for daylight and darkness periods. Independent qualitative and quantitative variables referring to traffic volume, road location (built-up area – through roads in small towns or villages and rural areas), road infrastructure (bus stops, pedestrian crossings, road barriers, road signs, road lighting), road surrounding (number and frequency of side obstacles), road cross-section type (with sidewalks and different types of shoulders (verge, paved), traffic calming measures in the cross-section, horizontal alignment, speed limits and access points density, were all taken into account. As for analysed dependent variables, not only the number of accidents was defined but also the numbers of: fatalities, casualties, one-vehicle accidents, vehicle-vehicle accidents and vehicle-pedestrian accidents. Only homogeneous road sections in terms of road geometry and surrounding, with no intersections, including 270 road sections of national roads and 198 of regional roads were randomly selected and analysed.
(5)
3 RESULTS
3.1. Assessment of relative risk of road accidents associated with darkness
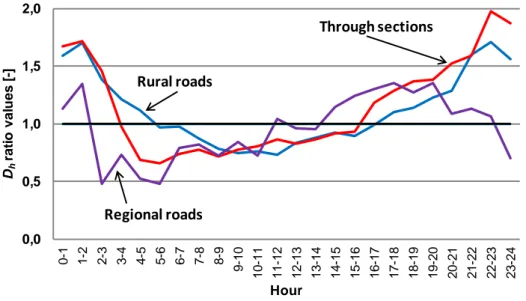
Estimated results of the ratios defined in 2.1 are presented in this section and the estimate value of Dh is illustrated in Figure 3. It indicates that the hazardous period associated with
darkness on rural roads falls on 17:00-5:00 interval, while for road sections through towns and villages it is 16:00-3:00, and on regional roads - 14:00-23:00. The most hazardous hours are 21:00-2:00 on rural roads and 16:00-2:00 on road sections through towns and villages. While assessing the estimate values of Dn/d it was found that:
• the risk of an accident occurrence in night-time in comparison to daytime on national roads increases by 60% and by 15% on regional roads.
• the number of fatalities in night-time in comparison to daytime on national roads increases 3.7-times (Dn/d=3.77), and on regional roads over 2.5-times (Zn/d=2.50).
The ratio Dacc_night/acc_day obtained according to the equation (3), where there is no constant
hour interval for ''darkness'' and ''daylight'' times, was 1.52 for national roads and 1.28 for regional roads. The values do not differ significantly from the values obtained by applying the method with night-time and daylight hours (the difference is of 5% for national roads and of 10% for regional roads). Due to seasonal variations of daylight and darkness times in Poland, the obtained average traffic share in darkness or daylight is only a rough estimation. Simplifications applied when calculating this ratio were more significant than when calculating the ratios according to the equations (1) and (2). Nevertheless, the obtained value of the increase ratio of road accident risk associated with darkness is similar to the one estimated with more accurate entry data estimation.
0,0 0,5 1,0 1,5 2,0 0 -1 1-2 2-3 3-4 -54 5-6 6-7 7-8 8-9 9 -10 10 -11 11 -12 12 -13 13 -14 14 -15 15 -16 16 -17 17 -18 18 -19 19 -20 20 -21 21 -22 22 -23 23 -24 Dh rat io val u es [-] Hour Rural roads Through sections Regional roads
Figure 3: Dh ratio values on specified road sections.
In the last stage of a relative increase of road safety risks in darkness analysis, with applying an accident ratio methodology for data from Daylight Saving Time (DST) transitions periods, both in spring and autumn, was used. Such an approach allows separation of adverse
weather conditions in winter. The relative accident risk ratios in darkness obtained according to equation (4) are presented in Table 3.
Table 3: Relative accident risk ratios in darkness obtained according to equation (4)
SUMMER TIME (April-October)
WINTER TIME (November-March) National roads Regional roads National roads Regional roads
Seasonal risk ratio in darkness 1.63 1.23 1.55 1.31
The ratio DS (equation 4), showing the risk of road safety in darkness to daylight, indicates
that the risk in darkness is greater throughout the year, being slightly higher in summer time on national roads and in winter time on regional roads. Weather conditions may affect these findings, as well as lower road standards and their winter maintenance.
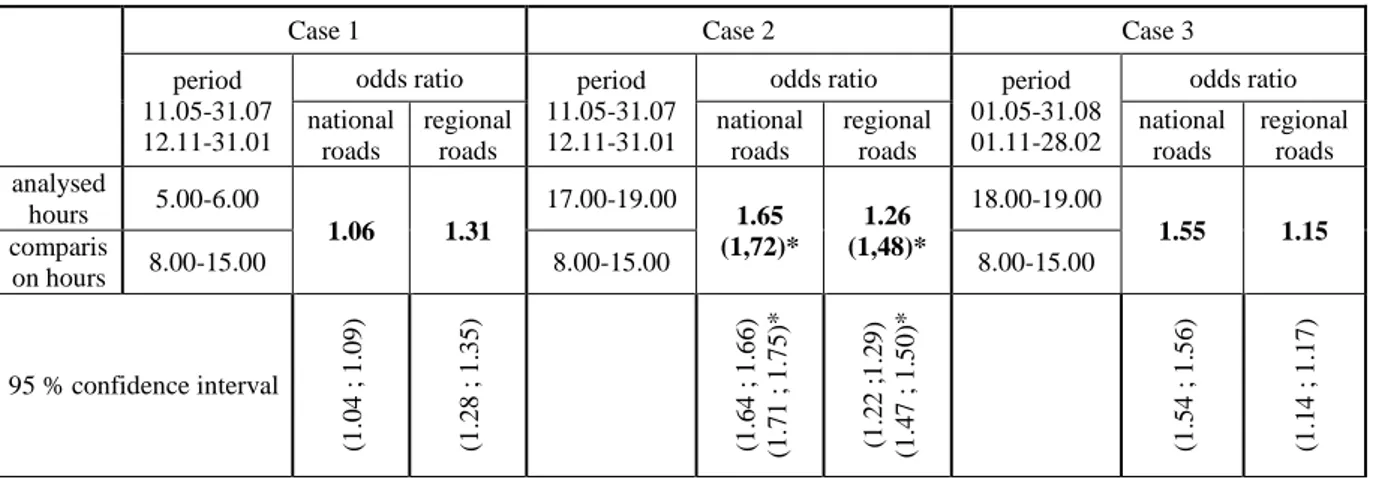
The odds ratio results, obtained according to equation (5) for various cases of hour periods analysis, were shown in Table 4. The justification for the selected periods of analysis are given in 2.1. The morning period and evening periods shown in Table 2 were included. Greater attention should be paid to the evening period, since it was represented by a larger sample size and the results of the study so far indicate a greater decrease in safety in the evening rather than morning periods.
As it was expected, the influence of darkness on road safety in darkness (17:00 – 19:00 Case 2 and 18:00 – 19:00 Case 3) is far greater. During the morning hours (Case 1 – 5:00 – 6:00) the lack of natural light resulted in only a 6% increase on national roads. Surprisingly, a significant increase in road accidents in the morning hours on regional roads was observed.
Table 4: Relative road safety risk ratios in darkness estimated applying the odds ratio methodology according to equation (5) for all users.
Case 1 Case 2 Case 3
period 11.05-31.07 12.11-31.01
odds ratio period 11.05-31.07 12.11-31.01
odds ratio period 01.05-31.08 01.11-28.02 odds ratio national roads regional roads national roads regional roads national roads regional roads analysed hours 5.00-6.00 1.06 1.31 17.00-19.00 1.65 (1,72)* 1.26 (1,48)* 18.00-19.00 1.55 1.15 comparis on hours 8.00-15.00 8.00-15.00 8.00-15.00 95 % confidence interval (1 .04 ; 1 .09) (1 .28 ; 1 .35) (1 .64 ; 1 .66) (1 .71 ; 1 .75) * (1 .2 2 ;1 .29 ) (1 .47 ; 1 .50) * (1 .54 ; 1 .56) (1 .14 ; 1 .17)
*(…) – results for 17:00-18:00 period
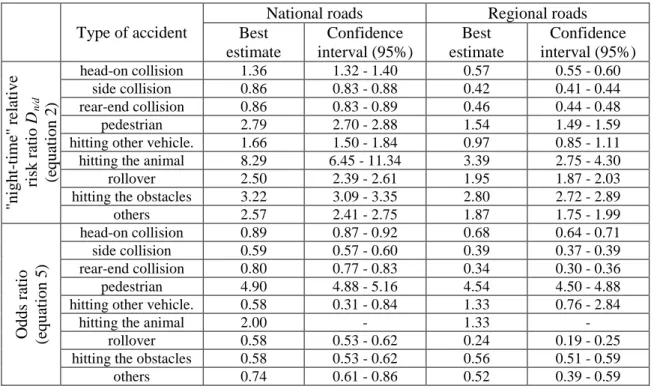
Table 5 shows results of ratios calculated for different road accident types on both national and regional roads. Such a comparison was considered to be justified since it allows to assess additional influence of a road technical standard on accidents in darkness. For that purpose, the values of risk changes ratios for accidents in darkness for various analysis hours, were
estimated. The ratio calculated according to equation (2) includes the hours when an additional influence of a driver’s fatigue on accidents may arise.
Table 5: Different types of accidents risk changes estimation results for accidents in darkness and at night-time.
Type of accident
National roads Regional roads
Best estimate Confidence interval (95%) Best estimate Confidence interval (95%) ''n ig h t-ti me '' r el at iv e ri sk ra ti o D n/ d (e qua ti on 2 ) head-on collision 1.36 1.32 - 1.40 0.57 0.55 - 0.60 side collision 0.86 0.83 - 0.88 0.42 0.41 - 0.44 rear-end collision 0.86 0.83 - 0.89 0.46 0.44 - 0.48 pedestrian 2.79 2.70 - 2.88 1.54 1.49 - 1.59
hitting other vehicle. 1.66 1.50 - 1.84 0.97 0.85 - 1.11
hitting the animal 8.29 6.45 - 11.34 3.39 2.75 - 4.30
rollover 2.50 2.39 - 2.61 1.95 1.87 - 2.03
hitting the obstacles 3.22 3.09 - 3.35 2.80 2.72 - 2.89
others 2.57 2.41 - 2.75 1.87 1.75 - 1.99 O dds r at io (e qua ti on 5 ) head-on collision 0.89 0.87 - 0.92 0.68 0.64 - 0.71 side collision 0.59 0.57 - 0.60 0.39 0.37 - 0.39 rear-end collision 0.80 0.77 - 0.83 0.34 0.30 - 0.36 pedestrian 4.90 4.88 - 5.16 4.54 4.50 - 4.88
hitting other vehicle. 0.58 0.31 - 0.84 1.33 0.76 - 2.84
hitting the animal 2.00 - 1.33 -
rollover 0.58 0.53 - 0.62 0.24 0.19 - 0.25
hitting the obstacles 0.58 0.53 - 0.62 0.56 0.51 - 0.59
others 0.74 0.61 - 0.86 0.52 0.39 - 0.59
The data compared in Table 5 proves that:
• the selection of analysis time periods, in order to estimate the accidents in darkness risk changes ratio, affects the results of the estimation. For instance, an increase in accidents involving pedestrians in darkness, calculated according to equation (5), is significantly higher than the one calculated according to equation (2). A significant difference appears also in the estimation of risk for accidents at night-time when hitting obstacles in the road surrounding. Referring to the ratio calculated using equation (2), a significant increase in the accidents risk at night-time can be observed, while using equation (5) a decrease is observed. This may result from a role of drivers' fatigue at night-time, which is not the case in the evening hours (included in eq. 5).
• the increase in the accidents risk at night-time on regional roads is smaller than on national roads, and this is true for almost all accident types. Only the risk of the hitting an obstacle in the road surrounding at night-time is higher on regional than on national roads.
3.2. Selected results of identifying infrastructural factors affecting accident risk
in darkness
An attempt to develop accident regression models for different periods of daylight and darkness resulted in reaching the following conclusions:
• The exogenous, statistically significant variables in the models were: section length, traffic volume, density of commercial access points, density of bus stops, density of intersections with low traffic.
• Traffic volume at night, as an exogenous variable in some models, appeared to be negligible, which could have been the result of low traffic volume variations at night in the analyzed sets.
• Qualitative variables, characterizing the road and its surrounding, appeared infrequently in the models. However, both qualitatively described pedestrian traffic segregation as well as cross-section types are exceptions.
b) Regional roads:
• The assumption of a greater influence of characteristic variables of regional roads technical standards on the number of accidents in darkness in comparison to national roads data was confirmed.
• The exogenous, statistically significant variables in the models were: density of pedestrian crossings, density of bus stops with bays, density of access points, density of intersections with low traffic and density of side obstacles.
• In built-up areas, the influences of traffic calming and artificial lighting are additional statistically significant variables in the accidents prediction models. Traffic calming measures improve road safety.
• Existing road lighting in built-up areas on the analyzed road sections led to an increase in road accidents in darkness, which can be attributed to increasing driving speed due to visibility improvement. Artificial road lighting there correlates with built-up density and partly proves the influence of a road surrounding on accident risks.
4 DISCUSSION
Accident risk on national roads estimated by relative ratios, increases by about 60% at ''night'', compared to ''day'', and on regional roads by about 20%.
The number of fatalities at night-time on national roads may almost quadruple and may be 2.5-times higher, compared to daytime, on regional roads. The "night" increase is linked to the accident type. The risk is especially high in terms of pedestrian-vehicle accident or driving into obstacles like trees, pillars, road barriers or animals. The likelihood of head-on collisions on national roads is also slightly higher at night-time or darkness whereas side-on or rear-end collisions risks in both day and night conditions are similar.
Pedestrians are also especially prone to an increased accident risk at night-time. The relative accident risk in that group at night-time is 1.34 on built-up areas roads and a staggering 8.67 on rural sections of national roads. This value, however, does not reflect a full phenomenon of an increased pedestrian risk in darkness, since no pedestrian volume was involved in the analyses. Artificial road lighting decreases the consequences of accidents by decreasing the accident severity ratio.
On through sections of national roads in towns and villages, a significant increase in pedestrians' share was noticed outside daylight periods. On a road unlit at night-time the driving into an obstacle accident share also increased.
Regional roads, in comparison to national roads, are generally of lower technical standards and they carry both through and local traffic. This affects the structure of road accidents both in darkness and daylight. In darkness, the risk of driving into an obstacle accident increases
significantly, but less so in case of pedestrian–vehicle type. Pedestrian–vehicle accident share is also large with artificial road lighting, which may result from the fact that it is typically located near pedestrian crossings.
Apart from speeding, the most predominant causes of pedestrian–vehicle accidents in darkness, include careless pedestrian or driver road crossing, and other pedestrians' wrongdoings.
The comparison of accident ratios and odds ratio estimation methodologies provides similar findings in a longer-term analysis period (2 hours). Conducting analysis for the most unfavourable hour (17:00-18:00) leads to an overestimation of accident risks associated with darkness (Wanvik, 2009).
From regression analysis conducted, it can be stated that estimation models for accidents in darkness are described exclusively with basic risk exposure variables, i.e. AADT and section length L (especially with L), unlike those during the daylight. Accidents in darkness are more random, with little effect of infrastructural factors. This may result from factors related to a human ability of road perception. A driver has a restricted road view, hence the road surrounding has a smaller influence on their behaviour, especially on rural roads. Built-up areas are lit to a great extent, so the driver's road behavioural differences, resulting from the lack of natural light, are not that visible.
Lower class roads are common for many cut-off points of their parameters as well as various infrastructure elements in their surrounding, which may adversely affect road safety. Moreover, lower road class demands less strict access control, road corridor or improving pedestrians safety elements. The role of those elements is greater in conditions of visibility restricted by darkness, since their perception can be hindered. Hence, more statistically relevant variable elements directly related to infrastructure can be identified in accident prediction models.
5 CONCLUSIONS
The conducted analyses prove an increase in road safety risks in darkness, as the values of the risk ratio of road safety proved to increase in darkness: Dh values were 1.3–2.2, depending on
a road group. Much higher values of that ratio, compared to daylight, were obtained in for selected accident groups: pedestrian-vehicle accidents – 4.90 (national roads) and 4.54 (regional roads) in darkness period, driving into an obstacle at the roadside accidents - 3.22 (national roads) and 2.88 (regional roads) at night-time.
Taking into account all presented methods of relative road safety risks estimations in darkness compared to daylight, it can be stated that the accident risk in darkness on national roads is about 60% higher, when compared to daytime. On regional roads that risk is much smaller (1.15-1.30). The increase in the accident risk depends on the season of the year and time of day or night (the risk is higher in winter time and significant at dawn, compared to national roads). Additionally, in case of regional roads, the role of infrastuctural factors in the accidents determinants group is greater than on national roads. The analysis described here, using different ratios for changes evaluation in accident risks in darkness in comparison to daylight, proved a significant influence of the analysis period choice on the estimation results.
REFERENCES
Conference of European Directors of Roads (CEDR). (2010). Road lighting & safety, Cedr’s Secretariat General.
Elvik R., Erke A., Christensen P. (2009). Elementary units of exposure. Transportation Research Record: Journal of the Transportation Research Board, No. 2103, Transportation Research Board of the National Academies, Washington, D.C., pp. 25–31.
Elvik R., Hoye A., Vaa T., Sorensen M. (2009). The Handbook of Road Safety Measures. Emerald Group Publishing, The second edition..
Fors C., Lundkvist S.-O. (2009). Night-time traffic in urban areas. VTI rapport 650A.
Gaca S., Jamroz K., Ząbczyk K. i inni. (2003-2008). Analiza wybranych aspektów
zachowania użytkowników dróg, SIGNALCO – FRIL, Kraków – Gdańsk (not published)
available at www.krbrd.org.pl.
Hermans E., Wets G., Van den Bossche F. (2006). Describing the Evolution in the Number of
Highway Deaths by Decomposition in Exposure, Accident Risk, and Fatality Risk.
Transportation Research Record: Journal of the Transportation Research Board, No. 1950, Transportation Research Board of the National Academies, Washington, D.C., pp. 1–8. Johansson Ö., Wanvik P.O., Elvik R. (2009). A new method for assessing the risk of accident
associated with darkness, Accident Analysis & Prevention Vol. 41, pp. 809-815.
Lamm R., Psarinos B., Mailander T. (1999). Highway Design and Traffic Safety Engineering Handbook. New York, Mc Graw-Hill.
Lippold, Ch. (1997). Weiterentwicklung ausgewählter Entwurfsgrundlagen von Landstrassen, Dissertation Technische Hochschule Darmstadt, Darmstad.
Ripcord. (2008)., Accident Prediction Models and Road Safety Impact Assessment, Sixth Framework Programme.
Schlag B., Petermann I., Weller G., Schulze Ch. (2009). Mehr Licht – mehr Sicht – mehr
Sicherheit?, VS Verlag für Sozialwissenschaften, GWV Fachverlage GmbH, Wiesbaden.
Sullivan J. M., Flannagan M. J. (1999). Assessing the potential benefit of adaptive head
lighting using crash databases, UMTRI-99-21.
Sullivan J. M., Flannagan M. J. (2001). Characteristics of Pedestrian Risk in Darkness, Report No. UMTRI-2001-33.
Sullivan J. M., Flannagan M. J. (2002). The role of ambient light level in fatal crashes
inferences from daylight saving time transitions, Accident Analysis & Prevention Vol. 34,
pp. 487-498.
Sullivan J. M., Flannagan M. J. (2003).Risk of fatal rear-end collisions is there more to it than
attention, Proceedings of the Second International Driving Symposium on Human Factors
in Driver Assessment, Training and Vehicle Design.
Transportation Research Board Executive Committee. (2001). Recent Geometric Design
Research for Improved Safety and Operations, NCHRP Synthesis 299, Transportation
Research Board, Washington, D.C.
Transportation Research Board Executive, Committee. (2012). Recent Roadway Geometric
Design Research for Improved Safety and Operations. A Synthesis of Highway Practice,
NCHRP Synthesis 432, Transportation Research Board, Washington, D.C.
Vieten M., Dohmen R., Dürhager U., Legge K. (2010). Quantifizierung der
Landstraßen, Berichte der Bundesanstalt fur Strassenwesen, Verkehrstechnik, Heft V 201,
Bergisch Gladbach.
Wanvik P. O. (2009). Effects of road lighting - An analysis based on Dutch accident statistics