Tobias Lindé
Inge Vierth
An Evaluation of the Environmentally
Differentiated Fairway Dues
in Sweden 1998–2017
VTI notat 3A-2018
|
An Evaluation of the Envir
onmentally Dif fer entiated F airwa y Dues in Sweden 1998–2017 www.vti.se/en/publications
VTI notat 3A-2018
VTI notat 3A-2018
An Evaluation of the Environmentally
Differentiated Fairway Dues in Sweden
1998–2017
Tobias Lindé
Inge Vierth
VTI Reg. No.: 2017/0352-7.4 Publication: VTI notat 3A-2018 Cover pictures: Mostphotos
Preface
Sea transports are generally considered as more energy efficient than road and rail transports, but the emission of sulphur oxides (SOx) and nitrogen oxides (NOx) to air caused by sea transports are environmental concerns. To reduce these emissions, the Swedish Maritime Administration (SMA), the Swedish Shipowners’ Association and the Swedish Ports’ and Stevedores’ Association reached a tripartite agreement and SMA introduced for SOx and NOx emissions differentiated fairway dues in 1998. The stricter requirements in IMO’s in 2015 implemented Sulphur directive made the SOx-differentiation obsolete. Recently, it was decided to replace the NOx-differentiated fairway dues from 2018 by a system that comprises several environmental aspects. This system will not be addressed in this report but in our future work.
The experience with the environmentally differentiated fairway dues in Sweden between 1998 and 2017 is relevant both in the project Environmentally differentiated fees and incentives for ports1 that is
funded by Vinnova and the project Carrots and sticks in shipping to achieve environmental goals2 that
is funded by Vinnova and the Swedish Transport Administration.
The authors would like to thank Reidar Grundström from the Swedish Maritime Administration for the provision of different detailed information and comments. Furthermore, thanks to professor Kevin Cullinane (University of Gothenburg), Hanna Lindgren and Mattias Haraldsson (VTI) for comments and to Pia Bergdahl (Transport Analysis) for reviewing and commenting on the report.
The report has been written during the autumn of 2017. Stockholm, February 2018 Inge Vierth Project leader 1 https://www.vinnova.se/p/miljostyrande-avgifter-och-incitament-for-hamnar/ 2 https://www.vinnova.se/p/morotter-och-piskor-inom-sjofarten-for-att-uppna-miljokvalitetsmal/
Quality review
Review seminar was carried out on 6 December 2017 where Pia Bergdahl, Transport Analysis reviewed and commented on the report. The authors have made alterations to the final manuscript of the report. The research director Mattias Haraldsson examined and approved the report for publication on 31 January 2018. The conclusions and recommendations expressed are the authors’ and do not necessarily reflect VTI’s opinion as an authority.
Kvalitetsgranskning
Granskningsseminarium genomfört 6 december 2017 där Pia Bergdahl, Trafikanalys, var lektör. Författarna har genomfört justeringar av slutligt rapportmanus. Forskningschef Mattias Haraldsson har därefter granskat och godkänt publikationen för publicering 31 januari 2018. De slutsatser och
rekommendationer som uttrycks är författarnas egna och speglar inte nödvändigtvis myndigheten VTI:s uppfattning.
Table of contents
Summary ...7
Sammanfattning ...9
1. Introduction ...11
2. The Swedish Maritime Administration and fairway dues ...13
2.1. The introduction of environmentally differentiated fairway dues ...14
2.2. Fairway dues 1998 ...14
2.3. Development 1997-2017 ...16
2.4. Fairway dues in 2017 ...17
3. Effects of the environmentally differentiated fairway dues ...19
3.1. Introduction ...19
3.2. SOx emissions ...19
3.2.1. Vessels with SOx reduction certificates...19
3.2.2. Abatement techniques and costs of reducing SOx emissions ...20
3.2.3. Reduction of fairway dues (related to SOx emissions) ...20
3.2.4. Reduction of SOx emissions ...21
3.2.5. Costs versus benefits for society ...21
3.2.6. Contribution to fulfillment of environmental objectives ...22
3.3. NOx emissions ...22
3.3.1. Vessels with NOx reduction certificates ...22
3.3.2. Abatement techniques and costs of reducing NOx emissions ...25
3.3.3. Reduction of fairway dues (related to NOx emissions) ...27
3.3.4. Reduction of NOx emissions ...29
3.3.5. Costs versus benefits for society ...32
3.3.6. Contribution to fulfillment of environmental objectives ...32
4. Conclusions ...34
References ...37
Appendix 1. The new fee system ...41
Summary
An Evaluation of the Environmentally Differentiated Fairway Dues in Sweden 1998–2017 by Tobias Lindé (VTI) and Inge Vierth (VTI)
The report aims to present and analyze the development of the environmentally differentiated fairway dues in Sweden and the impacts of the system. A system differentiated for sulphur oxides (SOx) and nitrogen oxides (NOx) was introduced in 1998. The implementation of the International Maritime Organization’s (IMO) stricter SOx requirements in the Baltic and North Sea areas in 2015 made the SOx differentiation obsolete. In 2018 the system was replaced by a new fee system with different differentiation.
The Swedish Maritime Administration (SMA) is responsible for determining and collecting the fairway dues and is also dependent on this income as an important source of funding for its activities. The amounts to be paid and the emission levels that are necessary to be eligible for a certificate that entitles discounts are stated in the SMA’s regulations on fairway dues. These regulations have changed over the years and to give an overview of these changes a presentation of regulations and found amendments is provided.
Except for some early studies evaluating the first few years of the environmentally differentiated fairway dues, little has been done to evaluate the impact of the policy instrument that was in place for 20 years. The information found in previous studies, annual reports and available data provided by the SMA is compiled and analyzed to present the impacts of the fairway dues from 1998 to 2017.
The numbers and characteristics of vessels with SOx and NOx reduction certificates are compiled from several sources. Abatement techniques and costs are discussed. Available estimates of reduced emissions from certified vessels are presented and analyzed. As far as possible, the costs and benefits for society of reduced emissions are compared and the contribution to fulfillment of environmental objectives is discussed. More emphasis is placed on the NOx differentiation since problems with high levels of NOx emissions remain whereas SOx emissions have declined substantially in the Baltic Sea, especially since the implementation of stricter IMO requirements.
The procedure of reducing SOx emissions by switching to a fuel with lower sulphur content is relatively easy for the ship operators compared to measures to reduce NOx emission, which often requires substantial investments in e.g. Selective Catalytic Reduction (SCR) systems. This is reflected in the number of vessels with SOx and NOx reduction certificates, where the former is considerably higher than the latter. After an initial rapid growth, the number of vessels with SOx reduction certificate decreased, from 1 450 vessels in the year 2000 to approximately 500 vessels in 2014. The number of vessels with NOx reduction certificate increased at a decreasing rate, reached a plateau of 40-48 certified vessels between 2005 and 2014 and decreased thereafter.
The abatement costs for both SOx and NOx have been calculated to be substantially lower than the value for society of reducing emissions. Nonetheless, the fairway dues discounts have only been found to cover part of cost of reducing emissions. Especially for the reduction of NOx emissions the
environmentally differentiated fairway dues only provide enough incentives for certain types of vessels, like passenger vessels with many port calls in Sweden. While higher discounts to vessels with lower emissions could increase the incentives to reduce emissions, this opportunity is rather limited as the fee system needs to be revenue neutral.
Rough calculations of reduced SOx emissions from certified vessels exist, whereas more precise estimates of reduced NOx emissions have been obtained using AIS (Automatic Identification System) data. Based on the available data of reduced NOx emissions during 2012–2014 and the number of certified vessels per year, we estimate reduced NOx emissions for every year 1998–2016. The reported
reduction of the NOx emissions by the vessels with NOx reduction certificates in 2013 of 14 800 tonnes in the Baltic Sea area appears rather modest, although not insignificant, when comparing to the total amount of NOx emissions in the Baltic Sea of more than 300 000 tonnes.
The presented impacts in this paper should not be taken solely as the causal effect of the
environmentally differentiated fairway dues, as some ship operators had already taken measures to reduce emissions before the introduction of the system. Furthermore, the implementation of
environmentally differentiated port fees in some ports presumably also contributed to influencing ship operators to reduce emissions.
Sammanfattning
En utvärdering av de miljödifferentierade farledsavgifterna i Sverige 1998–2017 av Tobias Lindé (VTI) och Inge Vierth (VTI)
Syftet med rapporten är att presentera och analysera utvecklingen av de miljödifferentierade farledsavgifterna i Sverige och systemets inverkan. Ett system differentierat för svaveloxider (SOx) och kväveoxider (NOx) infördes 1998. Införandet av Internationella sjöfartsorganisationens (IMO) striktare SOx krav i Östersjön och Nordsjönsområdet 2015 ersatte behovet av SOx differentieringen. 2018 ersattes systemet av ett nytt avgiftssystem med en annan differentiering.
Sjöfartsverket ansvarar för att fastställa och infordra farledsavgifterna och är också beroende av denna inkomst som en viktig finansieringskälla till dess aktiviteter. De belopp som ska betalas och utsläpps-nivåerna som krävs för att få ett certifikat som ger rätt till lägre farledsavgifter anges i Sjöfartsverkets föreskrifter om farledsavgift. Dessa föreskrifter har ändrats under åren och för att ge en överblick av dessa förändringar ges en presentation av föreskrifter och funna ändringar.
Förutom några tidiga studier som utvärderar de första åren av de miljödifferentierade
farleds-avgifterna, har lite gjorts för att utvärdera effekten av styrmedlet som var implementerat under 20 år. Information från tidigare studier, årliga rapporter och tillgängliga data från Sjöfartsverket samman-ställs och analyseras för att presentera effekterna av farledsavgifterna från 1998 till 2017.
Antalet fartyg med SOx- och NOx-reduktionscertifikat och dess egenskaper sammanställs från flera källor. Åtgärder och kostnader för att minska utsläppen diskuteras. Tillgängliga uppskattningar av reducerade utsläpp från certifierade fartyg presenteras och analyseras. Så långt som möjligt jämförs samhällsekonomiska kostnader och nyttor av minskade utsläpp och bidraget till uppfyllandet av miljömål diskuteras. Mer fokus läggs på NOx-differentieringen eftersom problem med höga nivåer av NOx-utsläpp kvarstår, medan SOx-utsläppen har minskat avsevärt i Östersjön, särskilt efter införandet av IMO:s striktare krav.
Åtgärden att minska SOx-utsläpp genom att byta till ett bränsle med lägre svavelhalt är relativt enkel för fartygsoperatörerna jämfört med åtgärder för att minska NOx-utsläpp, vilka ofta kräver betydande investeringar i till exempel katalysatorer (SCR). Detta återspeglas i antalet fartyg med SOx- och NOx-reduktionscertifikat, där det förra är betydligt högre än det andra. Efter en snabb ökning minskade antalet fartyg med SOx-reduktionscertifikat, från 1 450 fartyg år 2000 till ungefär 500 fartyg 2014. Antalet fartyg med NOx-reduktionscertifikat ökade i en avtagande takt, uppnådde en nivå på 40–48 certifierade fartyg mellan 2005 och 2014 och minskade därefter.
Kostnaderna för att minska både SOx och NOx har beräknats vara betydligt lägre än värdet av samhällsnyttan för att minska utsläppen. Ändå täcker rabatten i farledsavgiften endast en del av kostanden för att minska utsläppen. Särskilt för minskningen av NOx-utsläpp har de miljödifferen-tierade farledsavgifterna endast gett tillräckliga incitament för vissa typer av fartyg, såsom passagerar-fartyg med många anlöp i Sverige. Även om högre rabatter till passagerar-fartyg med lägre utsläpp skulle kunna öka incitamenten att minska utsläpp är denna möjlighet begränsad eftersom avgiftssystemet måste vara intäktsneutralt.
Det finns ungefärliga uppskattningar av minskade SOx-utsläpp, medan mer exakta beräkningar av reducerade NOx-utsläpp har gjorts med AIS-data (Automatic Identification System). Baserat på tillgängliga beräkningar av reducerade NOx-utsläpp 2012–2014 och antalet certifierade fartyg per år, uppskattar vi minskningen av NOx-utsläpp för varje år 1998–2016. Den beräknade reduktionen av NOx-utsläpp från fartyg med NOx-reduktionscertifikat 2013 på 14 800 ton i Östersjöområdet förefaller ganska blygsam, men inte obetydlig, jämfört med de totala utsläppen av NOx i Östersjöområdet på mer än 300 000 ton.
Effekterna som presenteras i denna rapport ska inte tas endast som den kausala effekten av de miljödifferentierade farledsavgifterna, eftersom vissa fartygsoperatörer redan hade vidtagit åtgärder för att minska utsläppen innan systemet infördes. Vidare bidrog införandet av miljödifferentierade hamnavgifter i vissa hamnar antagligen också till att påverka fartygsoperatörerna att minska utsläppen.
1.
Introduction
Sweden is one of the few countries that has experiences with environmentally differentiated fairway dues. A system differentiated for sulphur oxides (SOx) and nitrogen oxides (NOx) was used from 1998 to 2017. This system was replaced by a new system in 2018.3 From the beginning the fairway
dues were differentiated both for SOx and NOx. However, the implementation of the sulphur directive of the International Maritime Organization (IMO) with stricter requirements in the sulphur emission control area (SECA) in the Baltic and North Sea areas in 2015 made the sulphur differentiation obsolete. For NOx, the emissions did not change that much over time and this is why a larger emphasis of this study is put on the reduction of NOx emissions. The fairway dues in Sweden have accounted for a substantial part of the income of the Swedish Maritime Administration (SMA) during 1998-2016. SMA is dependent on these revenues as a source to fund activities that SMA carries out and therefore the environmentally differentiated fairway dues should be as revenue neutral as possible. Even though the environmentally differentiated fairway dues in Sweden were implemented 20 years ago, little has been done to evaluate the long-term effects of the policy instrument. In 1998 the Swedish Government commissioned SMA to evaluate the introduction of the environmentally differentiated fairway dues. The evaluation was provided in a report from 2000 (Swedish Maritime Administration, 2000b) that is partly based on MariTerm (1999) and Kågeson (1999). Swahn (2002) presents additional data on the certified vessels, relates the costs and potential benefits of reducing SOx and NOx emissions and discusses the effects of the fairway dues. The mentioned studies provide valuable insight of the initial effects of the environmentally differentiated fairway dues, but there is a lack of similar studies for more recent years.
Recently, Transport Analysis (2017b) has carried out a study, on behalf of the government, with a focus on the environmental effects of the new fairway dues system that comprises more aspects than NOx emissions to air. The impacts of the sulphur directive have also been studied by Transport Analysis (2017a). SMA presents the number of vessels with NOx and SOx reduction certificates for individual years in many of the Annual Reports and reports on the Maritime Development. In some reports, the estimated reduction of emissions is also reported.
The objective of this project is to study the impacts of the environmentally differentiated fairway dues that were in place from 1998 to 2017. The evaluation is based on regulations, annual reports, available data and personal communication with SMA and the abovementioned studies. The information is compiled and analysed to present the development of the fairway dues and their impacts over time. As far as possible, the costs and benefits that were caused by the system are compared. The contribution to the fulfilment of the environmental objectives is discussed as well.
This report focuses on the environmentally differentiated fairway dues and the reduction of emissions from vessels that were entitled to lower fairway dues because of lower emission levels. However, the environmentally differentiated port dues provided similar incentives and are assumed to also have influenced the ship owners to reduce emissions. Hence, the effects discussed in this paper are likely due to the combined effects of the environmentally differentiated fairway dues and port dues. The design of the SOx and NOx differentiated fairway dues that were implemented in 1998 and the adjustments over time, as well as the development of SMA’s revenues and expenditures, are described in chapter 2. The impacts of the fairway dues are estimated in chapter 3, separately for SOx emissions and NOx emissions. Detailed information from SMA is compiled to: derive the number of certified vessels year by year, identify which measures were undertaken by the ship operators to reduce the emissions, what the costs for these measures were and how much the fairway dues were reduced. On the benefit side, it is estimated how much (measured in tonnes) the SOx and NOx emissions were
reduced by the certified vessels. Swedish and European unit values are applied to evaluate the reduction of emissions in monetary terms. As far as possible, the costs and benefits for different calculation alternatives are compared. Overall conclusions are drawn in chapter 4.
2.
The Swedish Maritime Administration and fairway dues
The Swedish Maritime Administration (SMA) is the governmental agency with responsibility to develop the maritime policy in line with the decisions of the government. The main duties of SMA include maintaining the fairways, providing pilotage, ice breaking and maritime rescue services and acting to minimize the impact of shipping on the environment (SFS 2007:1161). The largest source of income for SMA is from the fairway dues. This is used to cover not only the maintenance of the fairways, but also to cross-subsidize parts of other activities, like ice breaking (for which there is no specific fee) and pilotage (the pilotage fees cover 94 percent of the pilotage costs) (Swedish Maritime Administration, 2017c).
The government regulation on fairway dues (SFS 1997:1121) states that fairway dues shall be paid for vessels that load or unload cargo or passengers in Sweden and that SMA is responsible for
determining and collecting such fees. The size of the vessel, its cargo and its emission of air
pollutants4 (SFS 2004:1136) shall be considered when determining the fee and SMA may issue further
regulations regarding the fairway dues. Historically, the fairway dues have consisted of two parts, one part calculated based on the vessel’s gross tonnage (GT) and another part based on the cargo that is loaded or unloaded. In the following subsections, a chronology of the fairway dues in Sweden is presented, from the introduction of environmentally differentiated fairway dues in the late 1990s to the fairway dues system in 2017. The new fairway dues system that was implemented in 2018 is described in Appendix 1.
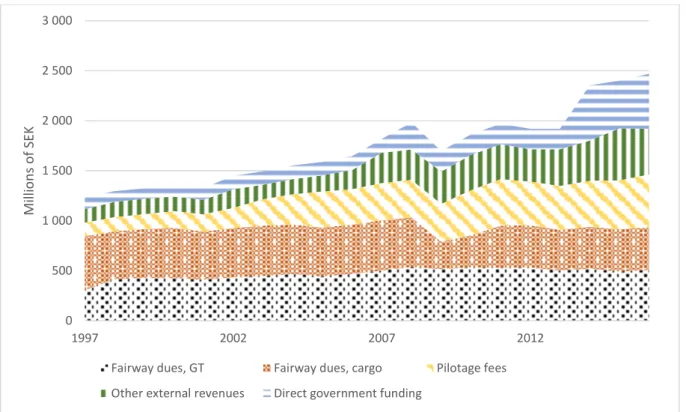
The development of SMA’s different revenues over time is presented in Figure 1.
As mentioned earlier, the fairway dues make up a substantial part (40-70 percent) of the revenues, although the share has decreased over time as revenues from pilotage fees, direct government funding and other external revenues have increased. The income from the gross tonnage (GT) part of the fairway dues has been relatively stable at around 400-500 million SEK for most years, whereas the cargo part of the fairway dues has varied more in individual years (e.g. a drop from 500 million SEK in 2008 to less than 300 million in 2009).
4 From 2018 the vessel’s size, cargo, passengers and environmental impact should be taken into account when determining the fairway dues (SFS 2017:866).
Figure 1. Development of SMA’s revenues for the period 1997-2016, nominal prices.
Source: SMA annual reports 1998-2016.
2.1.
The introduction of environmentally differentiated fairway dues
The environmental impact of the shipping industry received increasing attention at the end of the 1980s and the beginning of the 1990s when reports of the emissions of the industry were released (MariTerm, 1999). During this period, local efforts were taken to reduce the emissions of especially sulphur; in Stockholm and Gothenburg agreements were reached to limit the ropax vessels’ fuel sulphur content. But it was not until 1998 that national instruments were introduced to reduce the environmental impact of shipping in Sweden (MariTerm, 1999).
SMA, the Swedish Shipowners’ Association and the Swedish Ports’ and Stevedores’ Association reached a tripartite agreement in April 1996 to reduce the air pollution caused by the shipping industry (Swedish Maritime Administration, 2000b). One of the motives for the agreement to reduce emissions was to avoid stricter legislation that could hurt the shipping industry (MariTerm, 1999). The parties set a target to decrease the NOx and SOx emissions caused by the vessels that call at Swedish ports by 75 percent within five years (Swedish Maritime Administration, 2000b). To reach this goal the parties agreed to use financial incentives and decided to introduce environmentally differentiated fairway dues and port fees (Swedish Maritime Administration, 2000b).
In the end of 1999, 23 Swedish ports had implemented SOx differentiated port fees and seven
additional ports were planning to do so according to SMA (2000b). The study also notes that 15 ports had introduced NOx differentiated port fees and 13 were planning.
2.2.
Fairway dues 1998
The fairway dues that entered into force on 1 January 1998 (SJÖFS 1997:27) consisted like before of two parts, one part based on the vessel’s GT and one part based on the cargo that was loaded or unloaded. The part based on the vessel’s GT was differentiated according to the vessel’s NOx
emissions and the use of low-sulphur fuel. Different maximum amounts for the GT fee were specified
0 500 1 000 1 500 2 000 2 500 3 000 1997 2002 2007 2012 Milli o n s o f SE K
Fairway dues, GT Fairway dues, cargo Pilotage fees
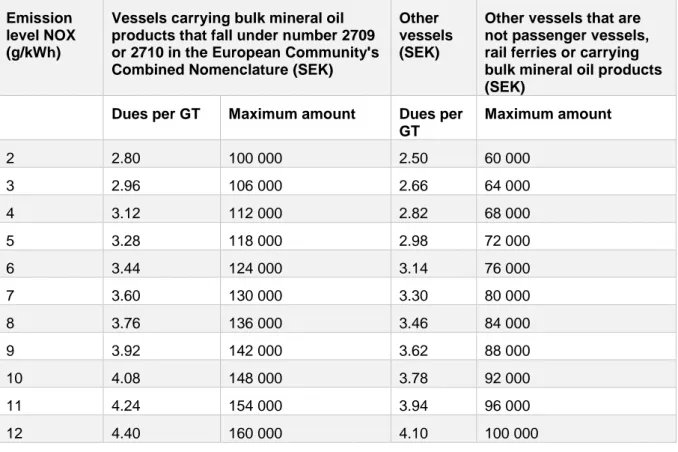
for different vessel types and NOx emissions levels, see Table 1. The part of the fairway dues based on the cargo was independent of emissions.5
Table 1. Fairway dues for each unit of the vessel’s GT and maximum amounts of the GT fee for vessels with NOx reduction certificates 1998 (SEK).
Emission level NOX (g/kWh)
Vessels carrying bulk mineral oil products that fall under number 2709 or 2710 in the European Community's Combined Nomenclature (SEK)
Other vessels (SEK)
Other vessels that are not passenger vessels, rail ferries or carrying bulk mineral oil products (SEK)
Dues per GT Maximum amount Dues per GT Maximum amount 2 2.80 100 000 2.50 60 000 3 2.96 106 000 2.66 64 000 4 3.12 112 000 2.82 68 000 5 3.28 118 000 2.98 72 000 6 3.44 124 000 3.14 76 000 7 3.60 130 000 3.30 80 000 8 3.76 136 000 3.46 84 000 9 3.92 142 000 3.62 88 000 10 4.08 148 000 3.78 92 000 11 4.24 154 000 3.94 96 000 12 4.40 160 000 4.10 100 000 Source: SJÖFS 1997:27
For vessels with NOx emissions of 12 g/kWh or higher, the fee per unit of the vessel’s GT was 4.40 SEK for vessels carrying bulk mineral oil and 4.10 SEK for other vessels. Vessels with average NOx emissions below 12 g/kWh could apply for a NOx reduction certificate which entitled a lower fee per unit of the vessels GT. The maximum amounts to pay were also based on the emission of NOx and are provided in the same table. Vessels using fuel with more than 0.5 percent (passenger vessels and rail ferries) or 1.0 percent (other vessels) of sulphur content had to pay an additional fee of 0.90 SEK per unit of the vessel’s GT.
To promote the installation of NOx reducing catalysts on vessels, refunds of fairway dues paid during the year of approval and the following four years were given. These refunds could amount to up to 40 percent of the investment costs for catalysts approved by SMA before 2000 and 30 percent for those approved after 2000. After 2000 similar refunds were given for the installation of humid air motor (HAM) equipment, which also reduces NOx emissions (MariTerm, 1999). The refunds for installing catalysts and HAM technology were removed after 2001 because it was considered too costly for the budget of SMA (Swedish Maritime Administration, 2009a).
Once fairway dues had been paid 18 times within a calendar year for a passenger vessel or rail ferry (or 12 times for other vessels), any subsequent fairway dues within the calendar year were based on the cargo only.
2.3.
Development 1997-2017
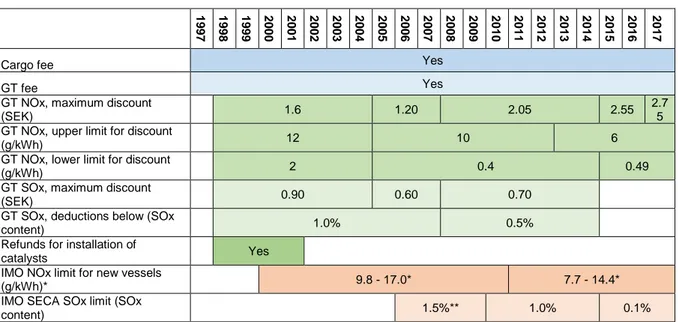
Every SMA fairway dues regulation (SJÖFS) contains information regarding which regulation it replaces and it has thus been possible to track the main changes in the fairway dues regulation from the introduction of the environmentally differentiated fairway dues in 1998 to the current system. The amendments to fairway dues regulations that have been found are presented, but since newer
regulations do not refer to previous amendments, and no list of all amendments has been found, it is possible (and likely) that some minor changes in the regulation of fairway dues are not covered in this report. A list of the fairway dues regulations and included amendments is provided in Appendix 2. To illustrate the evolution of the fairway dues during 1997-2017, Table 2 contains the different components and limits for the fairway dues that are most relevant for this study6. The blue bars
indicate that during the whole period the fairway dues consisted of one part based on the cargo and one part based on the GT of the vessel. The green bars illustrate the environmentally differentiated parts of the fee that depend on the NOx emissions and the SOx content in the fuel and indicate during which years refunds were given for installation of NOx reducing techniques. The red bars show the NOx limits for new vessels and the SECA sulphur limit, as established by the IMO.
Table 2. Limits and discounts for the fairway dues 1997-2017.
1997 1998 1999 2000 2001 2002 2003 2004 2005 2006 2007 2008 2009 2010 2011 2012 2013 2014 2015 2016 2017
Cargo fee Yes
GT fee Yes
GT NOx, maximum discount
(SEK) 1.6 1.20 2.05 2.55
2.7 5 GT NOx, upper limit for discount
(g/kWh) 12 10 6
GT NOx, lower limit for discount
(g/kWh) 2 0.4 0.49
GT SOx, maximum discount
(SEK) 0.90 0.60 0.70
GT SOx, deductions below (SOx
content) 1.0% 0.5%
Refunds for installation of
catalysts Yes
IMO NOx limit for new vessels
(g/kWh)* 9.8 - 17.0* 7.7 - 14.4*
IMO SECA SOx limit (SOx
content) 1.5%** 1.0% 0.1%
* The maximum NOx emission level for vessels constructed in or after 2000 and 2011, respectively. The specific level (within the interval) is dependent on the engine speed (International Maritime Organization, 2017a).
** The SECAs were in effect from 19 May 2006 in the Baltic Sea and 22 November 2007 in the North Sea (International Maritime Organization, 2017b).
Source: Compilation based on SJÖFS 1997:27, 1998:12, 2004:26, 2008:5, 2011:2, 2012:7, 2014:8, 2016:2, 2016:7 and International Maritime Organization (2017a, 2017b, 2017c)
The NOx and SOx emission levels that were required to be eligible for reduced fairway dues became stricter over the years. Reduced GT fees started below 12 g NOx per kWh in 1998 (see Table 1) but this limit decreased over time to 6 g/kWh in 2017. The limit for the lowest fee also decreased from 2 g/kWh to 0.49 g/kWh. Meanwhile, the maximum amount that could be saved by reducing NOx emissions increased. In 1998 the difference in the fee for vessels with emissions above the upper limit (12 g/kWh) and below the lower limit (2 g/kWh) was 1.60 SEK per unit of the vessel’s GT and in
2017 the difference for vessels above the upper limit (6 g/kWh) and below the lower limit (0.49 g/kWh) was 2.75 SEK.
The IMO’s NOx tier limits for new vessels were in some cases lower than the level necessary to be eligible for a reduced GT fee (e.g. 9.8 compared to 12 g NOx per kWh during 2000-2005 and 7.7 compared to 10 g/kWh 2011-2013). This means that some vessels constructed after 2000 could be eligible for a NOx reduction certificate and a reduced GT fee just by fulfilling the mandatory requirements by the IMO.
The sulphur content limit for reduced fees was 1 percent when the differentiation was introduced in 1998 and then decreased to 0.5 percent in 2008 before the sulphur fee was removed in 2015 (when the SECA sulphur limit was substantially lowered to 0.1 percent (International Maritime Organization, 2017c)). During the same period, the maximum discount for using low-sulphur fuel evolved from 0.90 SEK in 1998 to 0.60 SEK in 2005 and then finally to 0.70 SEK from 2008 until 2015.
2.4.
Fairway dues in 2017
The fairway dues in 2017 were regulated in SJÖFS 2016:7. The fairway dues consisted of two parts and were calculated based on the cargo loaded or unloaded and on the vessel’s GT. The part of the fairway dues that was based on the cargo was 2.97 SEK (1.08 SEK for low value cargo in bulk) per tonne of cargo loaded or unloaded.
For each unit of the vessel’s GT there was a fee ranging from 1.62-2.75 SEK depending on vessel type. The part of the fairway dues that was calculated based on the GT only applied to the first 2-5 payments within a calendar month, depending on vessel type (see Table 3), and subsequent fairway dues were based only on the cargo.
Table 3. Fariway dues for each unit of the vessel’s GT 2017 (SEK).
Vessel type Ports of call per calendar month
1st 2nd 3rd 4th 5th 1. passenger vessels and rail ferries 2.43 2.43 2.43 2.43 2.43
2. cruise liners 1.62 1.62 1.62 1.62 1.62
3. vessels carrying bulk mineral oil products that fall under number 2709 or 2710 in the European Community's Combined Nomenclature
2.75 2.75 0 0 0
4. other vessels 2.75 2.75 0 0 0
Source: SJÖFS 2016:7
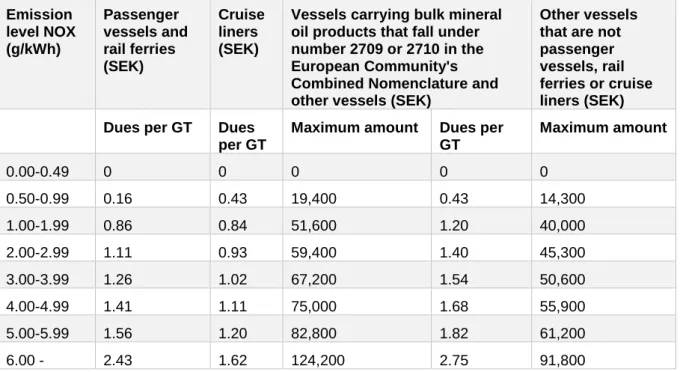
Vessels with a weighted average for total nitrogen emissions below 6 g/ kWh could apply for a NOx reduction certificate from SMA and holding such a certificate entitled the vessel to a reduction of the fairway dues. The amount of the fairway dues that was based on the vessel’s GT decreased with lower emissions and vessels with NOx emissions below 0.5 g/kWh pay no GT fee (see Table 4). For vessels carrying bulk mineral oil and for other vessels that are not passenger vessels, rail ferries or cruise liners, the maximum amount of fairway dues based on the GT depended on the vessel’s NOx emissions according to the table.
Table 4. Fairway dues for each unit of the vessel’s GT and maximum amounts of the GT fee for vessels with NOx reduction certificates 2017 (SEK).
Emission level NOX (g/kWh) Passenger vessels and rail ferries (SEK) Cruise liners (SEK)
Vessels carrying bulk mineral oil products that fall under number 2709 or 2710 in the European Community's Combined Nomenclature and other vessels (SEK)
Other vessels that are not passenger vessels, rail ferries or cruise liners (SEK) Dues per GT Dues
per GT
Maximum amount Dues per GT Maximum amount 0.00-0.49 0 0 0 0 0 0.50-0.99 0.16 0.43 19,400 0.43 14,300 1.00-1.99 0.86 0.84 51,600 1.20 40,000 2.00-2.99 1.11 0.93 59,400 1.40 45,300 3.00-3.99 1.26 1.02 67,200 1.54 50,600 4.00-4.99 1.41 1.11 75,000 1.68 55,900 5.00-5.99 1.56 1.20 82,800 1.82 61,200 6.00 - 2.43 1.62 124,200 2.75 91,800 Source: SJÖFS 2016:7
3.
Effects of the environmentally differentiated fairway dues
3.1.
Introduction
The impacts of the environmentally differentiated GT-part of the fairway dues in the period 1998 – 2016 in Sweden are estimated below. The reduction of SOx and NOx emissions generally requires different measures to be taken and the differentiations related to these emissions have been implemented with different conditions and durations. Therefore, this section presents the results related to SOx emissions (subsection 3.2) and NOx emissions (subsection 3.3) separately.
3.2.
SOx emissions
3.2.1. Vessels with SOx reduction certificates
In the middle of December 1999, almost two years after the introduction of the environmentally differentiated fairway dues, the number of vessels that had been granted lower fairway dues for using low-sulphur fuel was 1355 (Swedish Maritime Administration, 2000b). According to MariTerm (1999) most of the vessels that received SOx reduction certificates were already using low-sulphur fuel and the number of vessels that acted and switched to low-sulphur fuel because of the introduction of sulphur differentiated fees was estimated to be in the interval of 150-440. Swahn (2002) stresses that the rapid increase in the number of vessels with low sulphur certificates in 1998 is due to not only the effect of vessels switching to low sulphur fuel but also the registration of vessels that were already using low sulphur fuel.
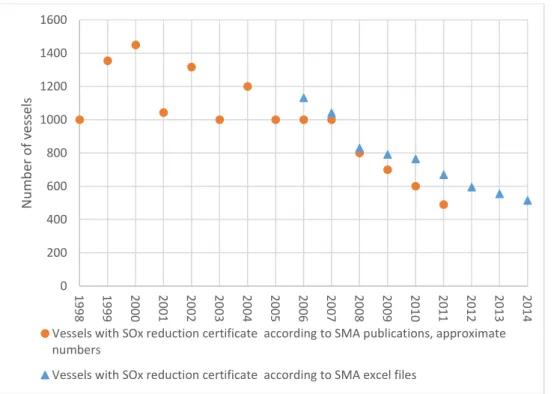
The annual number of vessels with SOx reduction certificates is presented in Figure 2, based on numbers from SMA’s publications and data files. The annual reports by SMA sometimes indicate an approximate number of certified vessels and sometimes a specific number, whereas the excel/data files always contain specific numbers and this could explain some of the fluctuations between individual years and the difference between the two sources.
Figure 2. The number of vessels with SOx reduction certificate during 1998-2014.
Source: SMA excel files and SMA (1999, 2000b, 2001, 2002, 2003, 2005a, 2006a, 2007a, 2008a, 2010a, 2011a, 2012a) 0 200 400 600 800 1000 1200 1400 1600 1998 1999 2000 2001 2002 2003 2004 2005 2006 2007 2008 2009 2010 2011 2012 2013 2014 N u m b er o f v es se ls
Vessels with SOx reduction certificate according to SMA publications, approximate numbers
After an initial rapid growth, the number of vessels with SOx reduction certificates have steadily decreased over the years, from 1450 in the year 2000 to approximately 500 in 2014 (the last year with SOx differentiated fairway dues). Since the procedure of switching fuel is relatively easy, ship owners can respond quickly to changes in the price difference between high and low sulphur fuel and changes in the fairway dues regulations. For example, when the sulphur fuel limit to get a discount was
reduced from 1.0 percent to 0.5 percent in 2008, the number of vessels with SOx reduction certificate declined from 1000 to 800 vessels. The number of vessels with SOx reduction certificates has thus represented a significant (although decreasing) share of the total number of vessels that call at Swedish ports (5464 unique vessels called at a Swedish port in 2015 (Vierth, 2016)).
3.2.2. Abatement techniques and costs of reducing SOx emissions
There are several measures that the vessel operators can take to reduce the SOx emissions, see e.g. Transport Analysis (2017a). The most obvious measure is to change to a fuel with lower sulphur content. This requires no adjustments of the engine and can reduce operating problems in the engine according to Kågeson (1999). He also estimated the cost of reducing sulphur emissions to be 4.50-10.80 SEK7 per kg (when switching to fuel with a sulphur content of 1 and 0.5 percent, respectively).
Swahn (2002) calculates the abatement cost of switching to low sulphur fuel to be in the range 4-8.5 SEK per kg SOx and discusses that potential reductions in operating and maintenance costs when switching to low-sulphur fuel should also be considered. The price of reducing SOx emissions by switching fuel is directly related to the difference between the price for low and high sulphur fuel and will change with changes in this spread. The drop-in fuel prices at the end of 2014 allowed ship operators to change to fuels with lower sulphur with low/no additional costs (Transport Analysis, 2017a).
3.2.3. Reduction of fairway dues (related to SOx emissions)
The discount for vessels with a SOx reduction certificate has been in the range of 0.60-0.90 SEK per GT and port call during the whole period, as presented in Table 2. Every annual report of SMA 1998-2014 contains the total discounts on the GT fee given to vessels with SOx reduction certificates and these amounts are presented in Figure 3. The total discount amount ranges from 22 to 40 million8 SEK
which means that the average discount received by the ship operator has varied between
approximately 20 000 to 60 000 SEK per year. These discounts have thus amounted to approximately three percent of the total revenues raised from fairway dues over the years.
7 With an exchange rate of 9 SEK per Euro
8 We observe the large increase in 2007 but have not found any explanation for it: the number of certified vessels did not increase and the fairway dues regulation were changed in 2005 and 2008 (but we have not found any
Figure 3. Total amounts of SOx discounts given to vessels with SOx reduction certificates 1998-2014.
Source: SMA annual reports 1998-2014
3.2.4. Reduction of SOx emissions
SMA (2005a) discusses the difficulties in assessing which fuels have been used and the geographical demarcation when estimating emissions from shipping. Nonetheless, a rough estimation of the reduced SOx emissions from the certified vessels is provided. The reduced emissions from the 1200 vessels with SOx reduction certificates in 2004 was estimated to be approximately 50 000 tonnes, compared to if the vessels had used “normal-sulphur” fuel (Swedish Maritime Administration, 2005a). However, the sulphur content of “normal-sulphur” fuel is not provided, and as discussed in section 3.2.1, a significant number of vessels were probably using low-sulphur fuel even before they received SOx reduction certification. Furthermore, several reports provide the same estimated reduction of 50 000 tonnes, although the number of certified vessels varies (1450 vessels in SMA (2001) and just over 1000 in SMA (2006a)). This highlights the uncertainty of the estimate, but in the absence of other estimates of reduced SOx emissions from certified vessels, it gives an indication.
3.2.5. Costs versus benefits for society
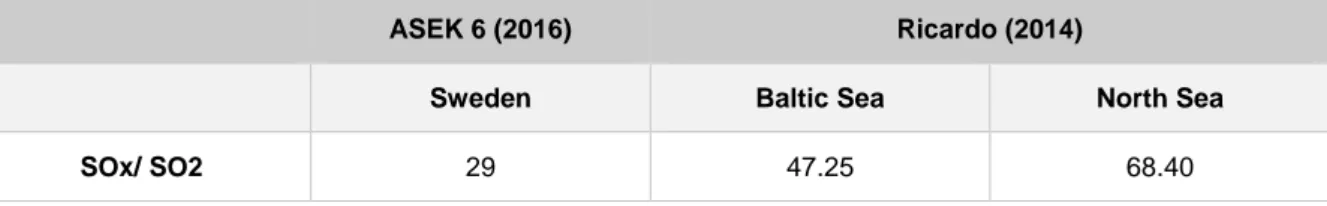
The recommended valuation of the socioeconomic cost of SO29 is 29 SEK per kg emissions according
to the national Swedish valuation guidelines (ASEK) (Swedish Transport Administration, 2016). Sea area specific valuations are provided in the European valuation guidelines (Ricardo, 2014) where the unit cost is valued at approximately 47 SEK in the Baltic Sea and 68 SEK in the North Sea10 (see
Table 5).
Table 5. Valuations of SO2/SOx emissions (SEK/kg).
ASEK 6 (2016) Ricardo (2014)
Sweden Baltic Sea North Sea
SOx/ SO2 29 47.25 68.40
Source: Swedish Transport Administration (2016) and Ricardo (2014)
9 We do not make a difference between SO2 and SOx here.
10 5250 € and 7600 € per tonne in the Baltic Sea and North Sea, respectively, and an approximate exchange rate of 9 SEK / EUR 0 5 10 15 20 25 30 35 40 45 1998 1999 2000 2001 2002 2003 2004 2005 2006 2007 2008 2009 2010 2011 2012 2013 2014 Milli o n s o f SE K
If we assume that 50 000 tonnes less SOx emissions are emitted by vessels that call at Swedish ports, the benefit for society is approximately 1450 million SEK according to Swedish valuation guidelines. If we apply the European unit values for the Baltic Sea the benefit is estimated to be approximately 2362 million SEK. Finally, with the European unit values for the North Sea the benefit would be 3420 million SEK. The costs for reducing SOx emissions by 50 000 tonnes would be in the range of 200 to 540 million SEK, with a cost of reducing SOx emissions of 4-10.8 SEK per kg (Kågeson (1999) and Swahn (2002)). While the absolute net benefit is not certain, as the estimated reductions of SOx emissions appear rather uncertain, the ratio of benefits to costs indicates that benefits for society by far exceeds the costs. With these valuations and estimations of costs, the benefits to society of reducing SOx emissions would be approximately 3-17 times larger than the costs, depending on which valuations and estimations of costs are used.
3.2.6. Contribution to fulfillment of environmental objectives
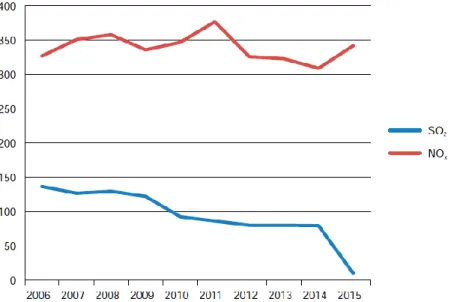
The SOx emissions have decreased steadily in the last decades and this has contributed to the fulfillment of the environmental objective that “the emissions of SOx, NOx and particles from the maritime traffic on the Baltic Sea and the North Sea should be decreasing by 2016” (Swedish Environmental Protection Agency, 2017b). The environmentally differentiated fairway dues have contributed to this reduction, but especially since the implementation of stricter sulphur limits in the SECA in 2015 have the emissions of SOx from the maritime traffic in the Baltic Sea declined substantially, as can be seen in Figure 4. The NOx emissions in the Baltic Sea have been higher and relatively stable.
Figure 4. Emissions from shipping in the Baltic Sea 2006-2015 (thousand tonnes per year).
Source: Swedish Environmental Protection Agency (2017b)
3.3.
NOx emissions
3.3.1. Vessels with NOx reduction certificates
At the end of 1999, 13 vessels had received a NOx reduction certificate. Nine of these vessels had taken actions to reduce emissions (seven had installed Selective Catalytic Reduction (SCR) and two used water injection) (Kågeson, 1999). The other four vessels with NOx reduction certificates already had NOx emission levels below 12 g/kWh (MariTerm, 1999). This highlights the fact that the number of certified vessels cannot be assumed to be solely a causal effect of the introduction of NOx
certification, suggesting that vessels might reduce emissions for other reasons. Some ports also applied the same type of environmental differentiation on the port dues (see Section 2.1).
Kågeson (1999) explains that the modest action taken to reduce NOx compared to SOx was reasonable (13 vessels with NOx reduction certificates compared to 1355 vessels with SOx reduction certificates in the end of 1999). Investing in new technology to reduce NOx emissions is more expensive and involved more risks (since the investment would have a depreciation period of eight to ten years) than the relatively easy procedure of shifting to low-sulphur fuel.
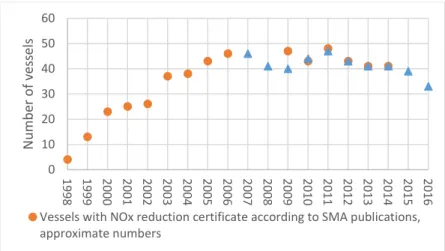
In Figure 5 the number of vessels with NOx reduction certificates for the years 1998-2016 is
presented. The data is compiled based on SMA’s publications and data files and the slight differences during some years could depend on whether SMA vessels are included or not and how vessels that had a certificate for only a part of the year are accounted. The number of vessels with NOx reduction certificate increased steadily during the first years with for NOx differentiated fairway dues (when refunds were also given for NOx reducing techniques). Over time the growth rate declined and reached a plateau of 40-48 certified vessels between 2005 and 2014. In recent years the number of certified vessels has declined and was 33 in 2016. These figures translate into around one percent of the vessels that call at Swedish ports in a year (5464 unique vessels called at a Swedish port in 2015 (Vierth, 2016)), which indicates a very limited effect of the environmentally differentiated fairway dues in terms of the share of vessels with NOx certificates out of all the different vessels that make port calls in Sweden.
Figure 5. The number of vessels with a NOx reduction certificate during 1998-2016.
Source: SMA excel files and SMA (1999, 2000b, 2001, 2002, 2003, 2005a, 2006a, 2007a, 2008a, 2010a, 2011a, 2012a, 2013a, 2016a)
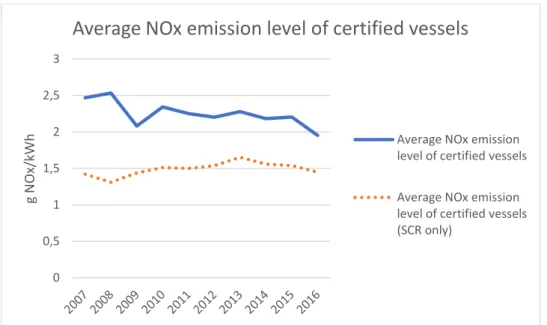
When studying the evolution of the number of certified vessels, one must also consider that the conditions to receive a NOx certificate have changed over time (as was shown in Table 2). The emission levels necessary to receive a NOx reduction certificate have decreased from 12 g/kWh to 6 g/kWh, making it more difficult to obtain a certificate. Simultaneously, the potential savings from reduced fairway dues have increased over time from 1.6 SEK per GT in 1998 to 2.75 SEK in 2017. The average NOx emission level of certified vessels decreased slightly from approximately 2.5 g NOx per kWh in 2007 to less than 2 g/kWh in 2016 (see Figure 6). For certified vessels with SCR the average emission level has been lower and rather stable around 1.5 g/kWh. This differs from the often-used theoretical level of a reduction of 95 percent (Kågeson (1999) and SMA (2009a)). An
explanation for this difference provided by Grundström (2017) is that the emissions level reported on the NOx reduction certificate is the average emission level of all the vessel’s engines and this level will be higher than the theoretical if the SCR is only installed on the main engines (and not on the auxiliary engines). 0 10 20 30 40 50 60 1998 1999 2000 2001 2002 2003 2004 2005 2006 2007 2008 2009 2010 2011 2012 2013 2014 2015 2016 N u m b er o f v es se ls
Vessels with NOx reduction certificate according to SMA publications, approximate numbers
Figure 6. NOx emission levels of the vessels with NOx reduction certificates 2007-2016.
Source: own compilation based on SMA excel files
The vessel types and GT groups (same categorization as in Vierth (2016)) of vessels that had a NOx reduction certificate any year during 2007-2016 is presented in Table 6. The total number of unique vessels that had a certificate is 64, indicating that each year a large fraction of the certified vessels is the same as in the previous year. The most common vessel size was a GT between 3900 and 11500, with slightly less than half of the vessels belonging to this group. Ro-pax was the most common vessel type, representing more than 45 percent of the certified vessels. Since passenger vessels pay fairway dues for more port calls each month (five calls compared to two calls for other vessels, see Table 3) and there is no maximum fee for such vessels (while there is a maximum amount for vessels that are not passenger vessels, rail ferries or cruise liners, see Table 4), the potential savings are large for these type of vessels. Ro-ro was the second most common vessel type followed by tanker.
Table 6. Number of vessels that had a NOx reduction certificate any year during 2007-2016 per vessel type and GT. GT Vessel type 3900-11500 11500-26500 26500-53000 53000-85000 85000-14000 Total Dry cargo 1 1 General cargo 2 2 Other 2 2 Ro-pax 10 2 11 5 2 30 Ro-ro 6 10 1 17 Tanker 10 2 12 Total 31 14 12 5 2 64
Source: own compilation based on SMA excel files and classification of vessels types and sizes in Vierth (2016).
Most of the vessels that had a NOx reduction certificate any year during 2007-2016 got the first certificate before this period, with a peak around 2002-2003, as can be seen in Figure 7. SMA (2015a) planned already in 2015 (possibly even earlier) to change the system and differentiate the fairway dues according to an index, which would imply that NOx emissions would only be one of several criteria and hence the financial incentives to reduce NOx were estimated to decrease. This is reflected in the absence of new certified vessels in recent years. Nonetheless, one vessel was certified for the first time in 2016, possibly for other reasons or because an investment decision was already taken.
0 0,5 1 1,5 2 2,5 3 g N Ox/k Wh
Average NOx emission level of certified vessels
Average NOx emission level of certified vessels
Average NOx emission level of certified vessels (SCR only)
Figure 7. Year of first NOx reduction certificate approval for vessels that had a NOx reduction certificate any year during 2007-2016.
Source: own compilation based on SMA excel files
3.3.2. Abatement techniques and costs of reducing NOx emissions
The different measures that a ship operator or owner can take to reduce the NOx emissions include installing Selective Catalytic Reduction (SCR), Humid Air Motor (HAM), gas turbine or water
injection, or using Liquified Natural Gas (LNG) as fuel. In Table 7 the different measures taken for the vessels that had a NOx reduction certificate any year during 2007-2016 are presented. The evident popularity of the SCR as a measure to reduce NOx emissions could indicate that it is a well-developed technology. A gas turbine has been installed in a few vessels and the rest of the measures appear to be individual experiments with alternative or new techniques.
Table 7. Measures taken to reduce NOx emission by vessels that had a NOx reduction certificate any year during 2007-2016.
Measure Frequency Percent
Other 1 1.56 EIM 2 3.13 Engine rel. 1 1.56 Gasturbine 4 6.25 HAM 1 1.56 LNG 1 1.56 LNG/SCR 1 1.56 Magnetizer 1 1.56 SCR 49 76.56 Waterinj+SCR 2 3.13 Waterinject 1 1.56 Total 64 100.00
Source: own compilation based on SMA excel files.
To estimate the costs of NOx reducing actions is a rather complex process as many factors influence it and several assumptions need to be made. Kågeson (1999) estimates the cost of installing a SCR
0 1 2 3 4 5 6 7 8 9
system in an existing ship to be 250 000 - 400 000 SEK per megawatt depending on vessel type. The technique requires a supply of urea and maintenance with an estimated additional cost of 18 SEK per MWh. This yields a cost per kg NOx reduced below 6 SEK. A provided example shows that for a large ferry and a Ro-Ro vessel with 50 port calls in Sweden, the fairway fee discount (excluding any refunds) covers 25-35 percent of the additional annual cost for SCR. In a report of the consequences of potentially implementing a Nitrogen Oxides Emission Control Area (NECA) in the Baltic and North Sea, Transport Analysis (2016) estimates the costs of installing SCR in different scenarios. A life length of the SCR of 20 years is assumed and the annual cost in the average scenario is estimated to be in the range of 0.14-2.6 million SEK for vessels with a power of 1000-25000 kW.
SMA (2009a) provides detailed calculations of the costs and benefits of installing SCR in a set of common vessel types. The assumptions made for the calculations are the following:
• The operating time of the SCR is 4 000 hours per year • The vessel’s total operating time is 6 000 hours per year • The SCR facility has a depreciation period of ten years
• Investment and installation cost is 4 million SEK per vessel plus 420 SEK per installed kW • The price for 40 percent urea with normal quality is 1 500 SEK per tonne (2 350 SEK per
tonne for high quality urea)
• The use of urea is 0.1 kg per kg fuel
• The SCR technique is installed in all of the vessel’s machines
• (The cost for installing SCR when the ship is being built is approximately 25 percent lower) The characteristics of the chosen vessels and the costs for installing SCR are provided in Table 8. The cost for installing SCR in the selected vessels ranges from 5 to 30 million SEK. When the investment cost is divided per year and the cost for urea consumption is added, the annual cost for SCR amounts to 0.7-10.2 million SEK, depending on vessel type and size.
Table 8. Characteristics of selected vessels and the costs for installing and running SCR. Vessel GT Machine power, kW Rpm Investment, thousands SEK Annual urea consumption, tonnes Annual urea cost, thousands SEK Annual cost of SCR, thousands SEK "Finland ferry" 34 400 26 400 520 15 088 2 006 3 009 4 518 "Germany ferry" 20 000 17 500 600 11 350 1 330 1 995 3 130
Small Ro-Ro ship 6 400 2 200 450 4 924 167 251 743
Large Ro-Ro ship 23 000 18 000 510 11 560 1 368 2 052 3 208 "Coast tanker" 11 500 6 200 500 6 604 471 707 1 367
Bulk carrier 3 200 3 300 230 5 386 251 377 916
Container vessel 93 500 63 000 100 30 460 4 788 7 182 10 228 "Feeder vessel" 3 000 3 000 770 5 260 228 342 868
Dry cargo vessel 5 200 3 800 600 5 596 289 434 994
Source: SMA (2009a)
Table 9 provides the NOx emissions of the vessels before and after installation of SCR along with the reduced emissions and the socioeconomic benefits. By comparing the total annual cost of installing and running SCR to the annual reduction of NOx, the cost for reducing NOx emissions has been calculated and varies by vessel type in the range of 2.5-6.7 SEK per kg NOx. As presented in Figure 6, the actual emission level of certified vessels with SCR has been around 1.5 g/kWh, which is higher than emissions based on a theoretical reduction of 95 percent in Table 9.
Table 9. NOx emissions with and without SCR and the cost of reducing NOx emissions.
Vessel Nox emissions
2009, g/kWh
Nox emissions with SCR (95% reduction), g/kWh Annual Nox reduction, tonnes Cost for reducing Nox, SEK/kg "Finland ferry" 12,9 0,65 1 294 3,5 "Germany ferry" 12,5 0,63 831 3,8
Small Ro-Ro ship 13,3 0,67 111 6,7
Large Ro-Ro ship 12,9 0,65 882 3,6
"Coast tanker" 13 0,65 306 4,5
Bulk carrier 15,2 0,76 191 4,8
Container vessel 17 0,85 4 070 2,5
"Feeder vessel" 11,9 0,6 136 6,4
Dry cargo vessel 12,5 0,63 180 5,5
Source: SMA (2009a) and own calculations.
3.3.3. Reduction of fairway dues (related to NOx emissions)
Table 10 contains calculations of the potential amounts that vessels could save on lower fairway dues, based on the data provided in the previous tables. The “Finland ferry” and the “Germany ferry” are passenger vessels and hence had to pay the GT fee for the first five port calls each month and there is no maximum amount for such vessels. For vessels that are not passenger vessels, rail ferries or cruise
liners the GT fee is only paid for the first two calls within a month and hence the GT fee discount per year is the same whether these vessels make two or five calls per month.
For none of the vessel types did the GT fee discount cover the annual cost of installing and running SCR. The GT fee discount had the lowest coverage of the SCR costs for the container vessel. Since it is a large vessel the fee is limited by the maximum amount (51 000 SEK), which limits the amount to be saved on a reduced GT fee.
Table 10. Fairway dues with and without SCR in 2009.
Vessel GT fee without SCR, thousands SEK GT fee with SCR, thousands SEK NOx discount per call with SCR, thousands SEK NOx discount per year with SCR (2 calls per month), thousands SEK
NOx discount per year with SCR (2 calls per month)/ annual cost of SCR
NOx discount per year with SCR (>5 calls per month)/annual cost of SCR "Finland ferry" 61,9 5,2 56,8 1362 30% 75% "Germany ferry" 36,0 3,0 33,0 792 25% 63%
Small Ro-Ro ship 13,1 1,6 11,5 276 37% 37%
Large Ro-Ro ship 47,2 5,8 41,4 994 31% 31%
"Coast tanker" 23,6 2,9 20,7 497 36% 36%
Bulk carrier 6,6 0,8 5,8 138 15% 15%
Container vessel 51,0 6,5 44,5 1068 10% 10%
"Feeder vessel" 6,2 0,8 5,4 130 15% 15%
Dry cargo vessel 10,7 1,3 9,4 225 23% 23%
Source: Calculations based on data from SMA (2009a) and SJÖFS 2008:5.
For vessels that reduced NOx emissions from above 10 g/kWh to the interval 0.5-0.9 g/kWh, the fee per unit of the vessel’s GT decreased by 1.65 SEK for passenger vessels and rail ferries and 1.80 SEK for other vessels that were not cruise liners. Again, as previously presented (in Figure 6), the actual emission level of certified vessels was higher, entitling a lower discount than this.
Based on the presented costs and reduced fairway dues, it seems that the fairway dues alone do not provide enough incentives to invest in SCR in most vessels. Furthermore, the calculations are based on a depreciation rate of the SCR investment of ten years, which means that the fairway dues system must remain the same for ten years for the numbers to hold (assuming all other things remain equal), and this highlights a risk involved with installing SCR. However, under different assumptions of vessel type, operating time, urea consumption etc. there could be cases where investing in SCR is more (or less) beneficial than in Table 10. One must also consider other economic incentives, like the refunds of paid fairway dues for installing SCR (1998-2001) and environmentally differentiated port dues, which in combination with the differentiated fairway dues could make it more beneficial to install SCR. With the fairway dues system in 2017, there was a larger fee difference between vessels with high and low emissions of NOx and the maximum amounts were higher. It would thus be more beneficial to install SCR in 2017, given the same investment and urea costs (which might have changed) and supposing the fairway dues system would remain the same (which it would not).
In their report on the consequences of the (then suggested) new fairway dues system11, Transport
Analysis (2017b) finds that the incentives in the past fairway dues system were too low for vessel operators/owners to invest in NOx reducing techniques. Furthermore, in the new system, the discounts
will cover a smaller share of the abatement costs and hence the incentives to reduce NOx emissions will be even lower.
SMA (2013a, 2016a) states in several reports that the incentives to reduce NOx emissions seems to be too low. A discussed alternative to increasing the economic incentives to reduce emissions of NOx was to remove the sulphur fee and increase the NOx differentiation (Swedish Maritime
Administration, 2009a). It thus seems contradictory to implement the fee system based on an index where NOx is only one of several criteria. However, government regulations on fairway dues (SFS 2017:866) have changed and since 2018 it is not only emissions, but the (total) environmental impact of the vessel, that should be taken into account when determining the fairway dues .
The potential savings on reduced fairway dues (related to NOx) for different vessel types were illustrated in Table 10. Unfortunately, the actual total amounts of discounts given to vessels with a NOx reduction certificate are not reported separately in SMA annual reports as opposed to the SOx discounts. However, SMA (2015a) reports that the total amount of NOx discounts to the certified vessels in 2014 amounted to 58 million SEK. While this corresponds to an average discount per certified vessel of approximately 1.5 million SEK, the report states that 15 of the vessels received 90 percent of the total amount, meaning that these 15 vessels received average discounts of 3.5 million SEK.
While the NOx discounts are not reported separately, the refunds given for investments in NOx reducing installations are reported in SMA’s annual reports and are presented in Figure 8. During the first years these refunds were approximately five to six million SEK per year, which translates into less than one percent of the revenue raised from fairway dues. It seems as if the announcement that these refunds would be removed after 2001 increased the interest in such refunds, or that an increased interest in 2001 made SMA remove future refunds. After 2001 no refunds were given for new
installations of NOx reducing techniques, but for installations made before 2001 refunds were still paid since the installation entitled refunds in the four years following installation.
Figure 8. Total annual amounts of refunds paid by SMA for investments in NOx reducing installations.
Source: SMA annual reports 1998-2016
3.3.4. Reduction of NOx emissions
The NOx reduction certificate contains information on the measured NOx emissions level and the nominal power output of the vessel. When this information is combined with information or
-2 0 2 4 6 8 10 12 14 1998 1999 2000 2001 2002 2003 2004 2005 2006 2007 2008 2009 2010 2011 2012 2013 2014 2015 2016 Milli o n s o f SE K
assumptions of the running time and/or distance sailed and emission level before certification, the reduction of NOx emissions of each vessel can be estimated.
SMA (2005a) estimates that the reduction of NOx emissions from the 38 vessels that had a NOx reduction certificate in 2004 (see Figure 5) was 41 000 tonnes. Similar estimates for the years 2000-2006 are provided in SMA’s annual reports and these numbers are presented in Figure 9. For the years 2012-2014 SMA has let the Swedish Meteorological and Hydrological Institute calculate the reduced NOx emissions from certified vessels based on Automatic Identification System (AIS) voyage data (see also Figure 9). With AIS data the exact positions of each certified vessel can be obtained and hence the actual running time, kilometers sailed, speed and geographical location can be considered in the estimations. Together with the emission levels that are reported in the NOx reduction certificates, the reduction of NOx emissions from certified vessels can be better estimated. SMA (2013a) estimates the reduced NOx emissions from the 43 vessels with a NOx reduction certificate in 2012 to be 16 526 tonnes during transport in the Baltic Sea area, Skagerack and Kattegatt, with the assumption that the emission level would have been 14 g NOx /kWh otherwise. A similar report (Swedish Maritime Administration, 2016a) provides the corresponding estimates for years 2013-2014, with the
assumption that emissions would otherwise have been according to the IMO requirements (presented in Section 2.3), and these are also presented in Figure 9.
Figure 9. Reduced emissions from vessels with NOx reduction certificates, according to SMA publications.
Source: SMA (2001, 2002, 2003, 2005a, 2006a, 2007a, 2013a, 2016a)
The reported reduction in NOx emissions from vessels with a NOx reduction certificate increased steadily from 23 000 tonnes in 2000 to 50 000 tonnes in 2006. As can be seen, the reported numbers are considerably lower during the years 2012-2014 when the more precise estimation method based on AIS data was used and the geographical area was limited to the Baltic Sea area, Skagerack and
Kattegatt. Hence, it makes little sense to compare the reported numbers from these two periods. The difference in the reported amounts of reduced NOx emissions from a given number of vessels is evident in Figure 10. For the period 2000-2006 the reported average reduction in NOx emissions per certified vessel was 1030 tonnes and the corresponding number was 348 tonnes for the period 2012-2014. 0 10 20 30 40 50 60 1997 1998 1999 2000 2001 2002 2003 2004 2005 2006 2007 2008 2009 2010 2011 2012 2013 2014 2015 2016 2017 Th o u san d t o n n es
Figure 10. Reduced emissions from vessels with NOx reduction certificates and the number of certificates, according to SMA publications.
Source: SMA (2001, 2002, 2003, 2005a, 2006a, 2007a, 2013a, 2016a)
In the absence of estimates of reduced NOx emission for many years, an attempt to present the evolution of reduced emissions over time is presented in Figure 11. When the information on average NOx reduction per certified vessel 2012-2014 is combined with the number of certified vessels for each year (presented in Figure 5), the reduction in NOx emissions per year can be estimated for the whole period 1998-2016. The assumptions for this extrapolation to hold are that the vessel types, sizes and transport routes are similar over time. As discussed previously, the limited number of unique vessels with a NOx certificate any year during 2007-2016 means that a large share of the certified vessels one year is the same as in previous years and hence the assumptions should hold to some extent at least. The bars are based on the more precise SMA(2013a, 2016a) estimations using AIS data and represent the annual reduction of NOx emissions during transports in the Baltic Sea area, Skagerack and Kattegatt. According to these estimates, the reduced NOx emissions from certified vessels have been in the range 11000-17 000 tonnes per year in this area during 2003-2016.
Figure 11. Estimation of approximate amounts of reduced NOx emissions from certified vessels during transport in the Baltic Sea area, Skagerack and Kattegatt.
Source: estimations based on Figure 5 and SMA (2013a, 2016a)
2000 2001 2002 2003 20042005 2006 2012 2013 2014 0 10 20 30 40 50 60 0 10 20 30 40 50 60 Re d u ce d N o x em is sion s, th o u san d t o n n es
NOx reduction certificates
0 2 4 6 8 10 12 14 16 18 Th o u san d t o n n es N Ox
Reduced Nox emissions per year, thousand tonnes (estimations based on 348 tonnes per vessel)
3.3.5. Costs versus benefits for society
As presented in Table 9 the cost for reducing NOx emissions by installing SCR has been calculated to vary between 2.5 and 6.7 SEK per kg NOx for different vessel types. These costs are thus substantially lower than the benefit of reducing NOx emissions (see Table 11). Even when comparing the highest cost (6.7 SEK per kg NOx) to the lowest valuation (42.30 SEK per kg NOx), the benefit for society of reducing NOx emissions is more than six times higher than the cost.
Table 11 Valuations of NOx emissions (SEK/kg).
ASEK 6 (2016) Ricardo (2014)
Sweden Baltic Sea North Sea
NOx 86 42.30 53.55
Source: Swedish Transport Administration (2016) and Ricardo (2014)
In 2014, when the reduced emissions from the vessels with NOx reduction certificates was estimated to be 12 200 tonnes in the Baltic Sea area, Kattegatt and Skagerack (Swedish Maritime
Administration, 2016a), a cost of 6.7 SEK per kg NOx would translate into a total cost of 82 million SEK. (As presented in section 3.3.3, the costs for SMA in terms of discounts given to vessels with NOx reduction certificates amounted to 58 million SEK in 2014 (Swedish Maritime Administration, 2015a) and is therefore in about the same range.) The benefit to society of reducing emissions by such an amount would be 516 million SEK (with a valuation of 42.3 SEK per kg). Hence, the social benefit of reduced NOx emissions from vessels with a NOx reduction certificate exceeds the cost.
A crucial question in that context is however which NOx emissions should be included in the
calculation of the benefits for society. The benefits would be lower if the NOx emissions caused in the Swedish sea territory and not the emissions in the Baltic Sea area, Kattegatt and Skagerack were considered.
3.3.6. Contribution to fulfillment of environmental objectives
To give a sense of the impact of these reduced emissions – and the contribution to the fulfillment of environmental goals - a comparison to the total amount of NOx emissions should be performed. Ideally, one would like estimates of reduced and total emissions using the same method and
geographical boundaries for such a comparison. In the absence of such data, alternative estimates of total NOx emissions are provided in Table 12. Traditionally, total NOx emissions have been calculated top-down based on statistics of sold fuel and this is still the method used for reporting Swedish
emissions in official statistics (Swedish Environmental Protection Agency, 2017a). However, calculations of emissions based on quantities of sold fuel come with several uncertainties in terms of where the fuel is used and the possibility to bunker in other countries. The bottom-up calculation based on AIS-data capturing the actual movements of vessels can provide more precise results. The reported reduction of the NOx emissions by the vessels with NOx reduction certificates in 2013 of 14 800 tonnes (Swedish Maritime Administration, 2016a) appears impressive when comparing to the NOx emissions from national shipping between Swedish ports, 4 156 tonnes, as reported in the
national statistics (Statistics Sweden, 2017). But more appropriate is to compare the reduced emissions to the total emissions in the same or a similar area and with the same or a similar method. When comparing to the total amount of NOx emissions in the Baltic Sea of more than 300 000 tonnes (Swedish Meteorological and Hydrological Institute, 2016), the reduction of emissions from certified vessels is rather modest (less than five percent), although not insignificant. If the main aim is to reduce emissions in Swedish territory, an estimation of the total and the reduced emissions in this area based on AIS-data would be suitable.
Table 12. NOx emissions from shpping in different areas 2013.
Emissions in/from NOx emissions (tonnes)
Data input for calculations
Source
Baltic Sea 352 600 AIS (Swedish Meteorological and
Hydrological Institute, 2016)
Baltic Sea 323 200 AIS (Jalkanen & Johansson, 2013)
International shipping with bunkering in Sweden
108 221 Sold fuel (Statistics Sweden, 2017)
National shipping (based on fuel sold for traffic between Swedish ports)
4 156 Sold fuel (Statistics Sweden, 2017)
While the environmental objective of reducing NOx (and SOx) emissions from the maritime traffic in the Baltic Sea and the North Sea has been achieved (Swedish Environmental Protection Agency, 2016), additional measures are needed for the fulfillment of future targets. To reach the national environmental quality objectives Clean Air, Zero Eutrophication and Natural Acidification Only, maritime emissions must decrease further and additional efforts are required to reduce the NOx emissions from international shipping (Swedish Environmental Protection Agency, 2016).