M¨
alardalen University
School of Innovation Design and Engineering
V¨
aster˚
as, Sweden
Thesis for the Degree of Bachelor of Science in Computer Science
PAIRWISE TESTING FOR PLC
EMBEDDED SOFTWARE
Peter Charbachi
pci13001@student.mdh.se
Linus Eklund
led13001@student.mdh.se
Examiner: Daniel Sundmark
M¨
alardalen University, V¨
aster˚
as, Sweden
Supervisor: Eduard Paul Enoiu
M¨
alardalen University, V¨
aster˚
as, Sweden
M¨alardalen University Bachelor Thesis
Abstract
In this thesis we investigate the use of pairwise testing for PLC embedded software. We compare these automatically generated tests with tests created manually by industrial engineers. The tests were evaluated in terms of fault detection, code coverage and cost. In addition, we compared pair-wise testing with randomly generated tests of the same size as pairpair-wise tests.
In order to automatically create test suites for PLC software a previously created tool called Com-binatorial Test Tool (CTT) was extended to support pairwise testing using the IPOG algorithm. Once test suites were created using CTT they were executed on real industrial programs. The fault detection was measured using mutation analysis.
The results of this thesis showed that manual tests achieved better fault detection (8% better muta-tion score in average) than tests generated using pairwise testing. Even if pairwise testing performed worse in terms of fault detection than manual testing, it achieved better fault detection in average than random tests of the same size. In addition, manual tests achieved in average 97.29% code coverage compared to 93.95% for pairwise testing, and 84.79% for random testing. By looking closely on all tests, manual testing performed equally good as pairwise in terms of achieved code coverage.
Finally, the number of tests for manual testing was lower (12.98 tests in average) compared to pairwise and random testing (21.20 test in average). Interestingly enough, for the majority of the programs pairwise testing resulted in fewer tests than manual testing.
Table of Contents
1 Introduction 5
2 Background 6
2.1 Programmable Logic Controllers - PLC . . . 6
2.2 Combinatorial Testing . . . 7
2.3 Motivation and Research Questions . . . 8
3 Methodology 9 3.1 Selection of Programs . . . 10
3.2 Measuring Fault Detection . . . 10
3.3 Measuring Code coverage . . . 10
3.4 Measuring Number of tests . . . 10
4 Pairwise Testing of PLC Software 12 5 Pairwise Testing Algorithm 14 5.1 CTT Implementation . . . 14 5.2 Algorithm Implementation . . . 15 5.3 Implementing IPOG in CTT . . . 16 5.4 CTT vs ACTS . . . 17 6 Results 18 6.1 Fault detection . . . 18 6.2 Number of tests . . . 19 6.3 Code coverage . . . 19 6.4 Data Distribution . . . 19
6.5 Detailed Overall Comparison . . . 20
6.6 Related work . . . 21 6.7 Threats to validity . . . 22 7 Conclusion 23 7.1 Future work . . . 24 References 27 8 Appendix 28
List of Figures
2.1 ACTS . . . 8 3.1 Methodology overview . . . 9 4.1 CTT workflow diagram . . . 12 4.2 CTT Start screen . . . 13 4.3 CTT Under use . . . 135.1 Horizontal and Vertical Extension . . . 14
5.2 CTT and ACTS comparison . . . 17
6.1 Logarithmic boxplots showing Code coverage and Mutation score . . . 19
6.2 Boxplots showing test suite size and program information . . . 20
6.3 Case Evaluation . . . 21
6.4 Total number of tests . . . 21
8.1 Code coverage, individual program comparison . . . 28
8.2 Mutation score, individual program comparison . . . 29
8.3 Test suite size, individual program comparison . . . 29
8.4 Execution time, individual program comparison . . . 30
List of Tables
2.1 Pairwise compared to Exhaustive testing . . . 7 6.1 Overview of each test methods results . . . 18 7.1 Program examples where each method outperform the other . . . 24
Chapter 1
Introduction
Software has rapidly become part of our everyday life and we encounter it multiple times a day. It handles things like the traffic lights we encounter on the way to work, the phone we check while on a break, as well as the microwave we use every day. Software has been the main pillar of our current informational society [1]. This fact show that software needs to be reliable and less faulty. Developing reliable software systems is not an easy process. In order to ensure reliability different techniques can be used to verify and validate the software, including software testing. In industrial applications, software testing is the main way to evaluate the software [2]. According to Myers et al. [3], a team developing software would spend approximately half of its time and even more than half of its cost for safety-critical software on testing. This estimated number has supposedly stayed true for more than 30 years from when the book was first published to the latest updated version.
Testing can be used to find faults that might lead to software failures. These faults are often caused by malfunctions in the interactions between programs or a functions parameters [4]. Writing the tests to find these faults is not only costly, but also very labour intensive. Ways to automatically generate tests have been widely researched to complement manual testing [5, 6, 7, 8]. There has even been a study showing that tests created automatically using a combinatorial technique (i.e., pairwise testing) detected more errors than manual ones [9]. These results kindled our interest in investigating how to use pairwise testing for a domain specific software, like the embedded software. This thesis focused on how well pairwise testing works in comparisons to manually written test suites created by industrial engineers for PLC embedded software. The rest of the thesis shows the implementation of pairwise algorithm for PLC software, its evaluation and the results of the experimental comparison between manual and pairwise testing in terms of fault detection, code coverage, and cost on real industrial programs provided by Bombardier Transportation AB.
Chapter 2
Background
Software testing is of the utmost importance [10] for both the developers and the users of the software. It is a way to assure reliability and validate that software is executing in the desired way before delivery. The goal is always to create reliable software, which becomes even more important when concerning real-time safety critical embedded software. These programs need to function with utmost certainty to ensure the absence of any unwanted behaviour, behaviour that most likely would lead to disastrous results and possibly the loss of lives.
2.1
Programmable Logic Controllers - PLC
Programmable Logic Controllers (PLC) are a popular and widespread hardware and software choice when dealing with this kind of real-time and safety critical software. These controllers are used in many industries such as pharmaceutical manufacturing and nuclear power plants among others and work by executing the software program in closed loops known as scan cycles. In every cycle the PLC will execute its three phases; reading inputs; executing logical parts; updating outputs. Because of this closed loop design, a PLC is able to assure a deterministic behaviour, thus pre-senting itself as a viable tool for executing real-time software [11].
Programming these controllers differ from your typical desktop application. Nowadays these con-trollers can follow the IEC (International Electrotechnical Commission) 61131-3 standard. This standard was introduced to prevent the increasing number of company-specialized solutions of programming languages as well as improve quality and enhance productivity [12]. The standard defined five different programming languages to be used for PLC programming [13,14].
• IL - Instruction List • ST - Structured Text • LD - Ladder Diagram
• SFC - Sequential Function Chart • FBD - Function Block Diagram
These programming languages are designed to be operated by engineers with a limited knowledge in programming [14], resulting in three of these languages being graphical (LD, SFC and FBD). The FBD language is becoming increasingly used when it comes to implementing safety critical software [15].
M¨alardalen University Bachelor Thesis
2.2
Combinatorial Testing
To test these PLCs and ensuring their correctness, testing the program code is done in a controlled environment. The goal of testing PLCs is to find the right combinations of inputs that would reveal problems in the actual functionality. This is done by executing test cases. A test case is described by Ammann et al. [2] as a test that executes the program to be tested, and it does this by using a set of test inputs, expected outputs and actual outputs. Only executing one test case is hardly enough to ensure a programs reliability. Instead by grouping a finite number of test cases together we obtain a so called test suite. Having more test cases greatly improves the chances of both covering the entire structure of code and finding all faults in the program.
Creating these test suites manually is a process that consumes a lot of time and is error prone. The idea of being able to automatically generate test suites for software has been explored profoundly during the last decades [16]. During the same time many different techniques have been put for-ward, with the goal to either help reduce the time consumption of testing or improve its accuracy [5, 6, 8, 17] and effectiveness in terms of fault detection. One of the most popular approaches to automate test generation is the combinatorial testing strategy of t-way testing, which tries to match all t-way combinations of input parameters. Pairwise testing is a subset of t-way testing with a t value of 2. Supposedly this is an effective way to identify software related failures, with a success rate between 50 and 97% depending on the application [9]. Other algorithms using t-way matching exist where 2 ≤ t ≤ 6 which achieve even higher accuracy, but these algorithms come with a higher cost in terms of larger test suites.
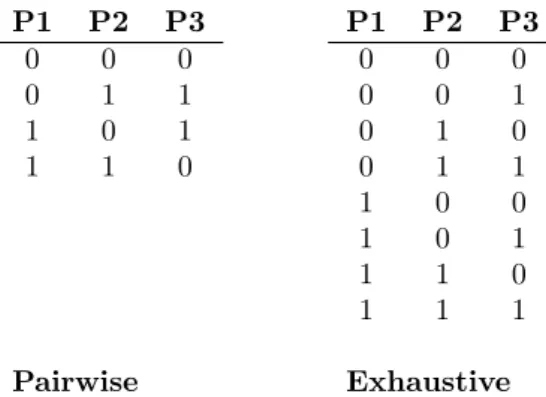
P1 P2 P3 0 0 0 0 1 1 1 0 1 1 1 0 Pairwise P1 P2 P3 0 0 0 0 0 1 0 1 0 0 1 1 1 0 0 1 0 1 1 1 0 1 1 1 Exhaustive Table 2.1: Pairwise compared to Exhaustive testing
Table 2.1 shows both a test suite containing all the combinations i.e. exhaustive testing, and a pairwise test suite created for the same PLC program. It is easy to see that even with this very small program containing only three boolean values there are a lot fewer test cases achieved by the pairwise approach then with exhaustive testing. As shown in Table 2.1, pairwise testing makes sure that every value of each parameter is tested against every value of another parameter, thus creating a pair. Parameter one has both its zero value and its one value matched with the zero value of parameter two, and since there are more parameters than two it is also possible for pairwise to match the pairs of parameter two’s zero value with parameter three’s zero value in the same test. By matching more than one pair per test case, pairwise is able to greatly reduce the number of test cases needed by testing all pairs of parameter inputs, compared to exhaustive testing which tests all combinations of parameter inputs.
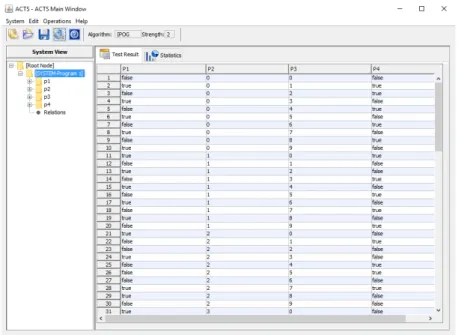
There are already available existing tools for generating combinatorial test suites. One of these tools is ACTS (Advanced Combinatorial Testing System) [18, 19] (seen in Figure 2.1). ACTS is a powerful tool that allows automatic construction of tests suites from a variety of different algorithms. Some of them are IPOG, but also IPOG-F, IPOG-F2, IPOG-D and base choice. All of the IPOG versions in ACTS are t-way compatible, which means that they can handle 2-way testing up to 6-way testing. Due to the fact that ACTS has a few drawbacks, one of them being
M¨alardalen University Bachelor Thesis
the lack of ability to import PLC programs. This fact motivates us to investigate other solution for implementing pairwise testing for PLC software.
Figure 2.1: ACTS user interface showing the modelling of a program.
2.3
Motivation and Research Questions
The Train Control Management System (TCMS) is an embedded system running on PLCs which is developed and used by Bombardier Transportation AB. This system consist of many other smaller systems, ranging from hardware to software components, and it is the system ensuring all safety critical and related operations in a train.
Testing these PLCs from TCMS is usually done manually by engineers. This is a process that consumes a lot of time, and it would be helpful if parts of the creation of test suites for the TCMS could be done automatically instead of manually. The problem with generating test suites in an automatic manner is that the TCMS is a safety critical system, it must be tested thoroughly to ensure that everything is working as intended. As far as we know, there are no published stud-ies showing how pairwise testing compares to manual testing for PLC embedded software. This motivates us to pose the following research questions:
• RQ1: How to implement pairwise testing for automatically generating test suites for PLC software?
• RQ2: How does automatic generated test suites using pairwise testing compare to manual ones in terms of fault detection?
• RQ3: How does automatic generated test suites using pairwise testing compare to manual ones in terms of number of tests?
• RQ4: How does automatic generated test suites using pairwise testing compare to manual ones in terms of code coverage?
Chapter 3
Methodology
To perform this thesis an existing Combinatorial Test Tool (CTT), previously created by students at M¨alardalens University, was extended to include the pairwise algorithm. A link to the tool can be found at the following GitHub repository1. The tool was previously developed as part of a project and was intended to help industrial engineers programming PLCs to create test suites more efficiently, and includes combinatorial algorithms for creating base choice tests as well as random generated tests. The tool works by loading the PLC program as an XML file containing the program structure including the input types needed to test the PLC programs. Once a file is loaded it is possible to choose which algorithm to use to generate a test suite. During this thesis we focused on implementing and using the pairwise algorithm for PLC software.
Industrial Engineers Pairwise test generator Test Suite Test Suite Number of Tests Code coverage Mutation score Creates Generates Executed on TCMS Programs Original programs + Mutated programs Random test generator Test Suite Generates
Figure 3.1: An overview of the methodology.
The study was performed according to the diagram shown in Figure 3.1 and done on existing real world programs provided by Bombardier Transportation AB. For these programs, manual test suites were already created by industrial engineers. Since these manually created test suites were used to test software that is already in production, we consider them quite effective when it comes to fault detection. These test suites were then accompanied with test suites generated by using CTT and the pairwise algorithm as well as random algorithm before being executed on the original PLC program to extract their respective data related to cost and code coverage. In addition, these test suites will be run both on the original programs and on certain faulty versions of the program (called mutants) with the purpose of providing information on how good the tests are at fault detection.
M¨alardalen University Bachelor Thesis
3.1
Selection of Programs
Bombardier Transportation AB provided us PLC programs from the Train Control Management System (TCMS). TCMS is a distributed real-time system containing different types of software subsystems overseeing the operation and safety-related functionality of the train, and runs on PLCs. TCMS allows for integration of control and communication functions for high speed trains and contains all functions controlling the functionality of the train. In total 53 programs were provided by Bombardier Transportation AB. During the execution of these programs 8 programs had to be excluded for various reasons: one program only contained one parameter, making it unusable with the pairwise algorithm and another program ran out of memory on the provided computer. The other 6 programs failed to provide any results after execution due to execution error or wrong parameter ranges that resulted in an execution error.
3.2
Measuring Fault Detection
Fault detection is measured using mutation analysis. After executing the program, we created multiple faulty versions of the program [20] using a mutation creation tool. These mutated pro-grams have small alterations in their code which are created by injecting common faults into the original program. Examples of this injection could be to replace an instance of the ”equal to” operator with ”greater or equal to” operator. By measuring how many of these injected faults are detected by a certain test suite, we are able to obtain a proxy measure for fault detection in the form of a mutation score. This is a method that has been shown to be suitable when real faults are not available [21]. The mutation score used is calculated as the number of mutants killed divided by the total number of mutants injected. This implies that a 100% mutation score results in the detection of all injected mutants, thus resulting in an ideal test suite regarding fault detection.
3.3
Measuring Code coverage
Code coverage is a criteria that, as the name implies, measures how much of the code has been covered. To increase chances of finding all faults, high code coverage is desired. Even so, according to Inozemtseva et al. [22], high coverage is not necessarily a good way to measure of how good the test suite is. Code coverage should not be used as a proxy for a test suites ability to detect faults. Inozemtseva claims that code coverage is a good way to identify under tested parts of a program, but there is no immediate correlation between code coverage and the number of faults detected. This is also reinforced by Wang et al. [23]. They discovered that when comparing automatically generated test suites to test suites created in a manual manner by engineers, even though the automatically generated test suites achieved higher code coverage, these test suites did not achieve as high a fault detection. Manual testing also showed better capability in finding hard-to-kill faults and to test hard-to-cover code.
3.4
Measuring Number of tests
The last metric used to measure the efficiency of testing is is the number of tests. This is done to provide a measure of the cost needed to create, execute and check the results for each testing technique. Ideally this measurement would involve a direct measurement of the time it takes to test PLC software using manual or pairwise testing. As we lacked this information we used the number of tests as a proxy for cost.
To provide a proper baseline for the pairwise algorithm, a suitable test suite size was needed. Instead of allowing the random algorithm to create as many test cases possible given the same time as the pairwise algorithm, we chose to generate random test suites with the same number of tests as pairwise testing. One could argue that the two alternatives focus on different aspects of evaluation. If you limit random by the number of test cases generated, you will mainly look at the quality of the test suite compared to pairwise, which is the desired need for the baseline. However,
M¨alardalen University Bachelor Thesis
if you limit random by time, you will instead indirectly imply that the quality of a single random test case is lower than that of a single pairwise one, and therefore you allow random to generate more test cases. All of this, of course hinges on the idea that random is much faster at generating test cases compared to pairwise.
Chapter 4
Pairwise Testing of PLC Software
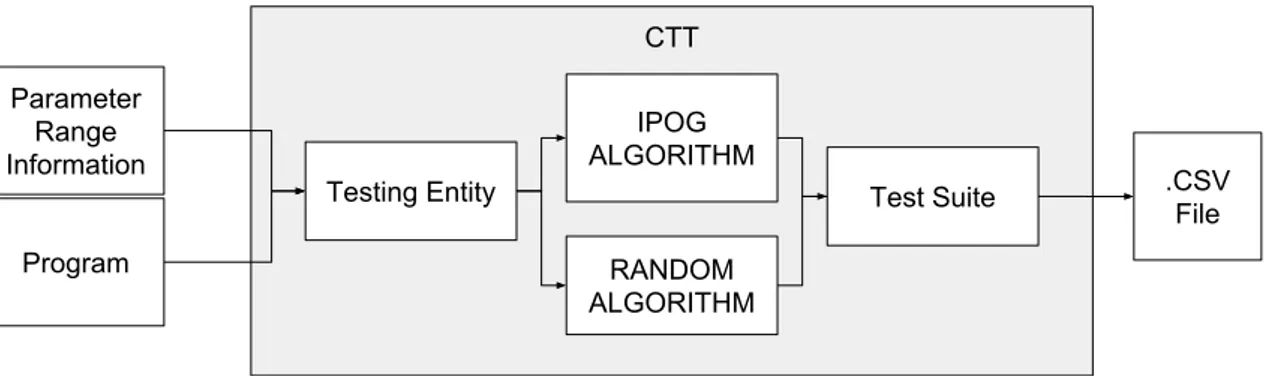
During our experimental study we used the CTT tool and our implementation of the IPOG pair-wise algorithm. In Section5 we show the implementation of this algorithm. An overview of the workflow used during this study can be seen in figure4.1. By using each program together with their respective parameter range information (provided with the programs from Bombardier Trans-portation AB), we have created a testing entity. This testing entity is a collection of parameters with their respective data type as well as ranges represented as a table (shown in the left container in figure4.3). In CTT, the user after choosing a desired test generation algorithm, can generate tests for a program. CTT creates a test suite before displaying it in the GUI. After this step, the user has the choice of saving this test suite as a .csv file.
Program Parameter Range Information CTT IPOG ALGORITHM
Testing Entity Test Suite .CSV
File RANDOM
ALGORITHM
Figure 4.1: Diagram showing the workflow of the CTT test generation.
When starting the program the user opens the GUI interface of CTT shown in figure4.2. Using this interface the user has the ability to either load PLC programs directly from XML files or manually adding parameters to create a test entity. After choosing a folder specifying from which location to load the programs, CTT will create a test entity by populating the parameter container with each parameter available as well as the respective parameters data type (see Figure4.3). In addition, the user is supposed to specify each parameters range. This range is producing all possible values to be tested and can be used by either writing a single value, or by writing the smallest possible value in the range followed by an underscore and the highest possible value in the range. Multiple ranges can be added by separating the ranges with a semicolon (;). In the case of the BOOL data type, 0 is a sufficient interval and does not require any range: 0 1 is used as default. The following are examples of ranges:
• 0 10 ⇒ All values from 0 to 10, including 0 and 10. • 5 ⇒ Only 5.
M¨alardalen University Bachelor Thesis
Figure 4.2: Image displaying CTT when first starting it.
Figure 4.3: Image displaying CTT after inserting parameters and generating test suite.
After specifying the desired ranges, choosing desired testing algorithm and specifying additional settings such as the need for randomised Don0tCareV alues for pairwise and number of tests for random testing, the user is able to generate the tests. These tests are shown in the right container, see figure4.3. When choosing pairwise algorithm, additional information are also displayed at the rightmost part of the tool: Information such as progress when creating larger test suites, time taken to create the test suite measured in hundreds of a second as well as the total amount of test cases created will be displayed. The user has the ability to save the test suite as a .csv file where every parameter is written separated by a comma (,) and every case is separated by a new line.
Chapter 5
Pairwise Testing Algorithm
In this section we present how we implemented pairwise testing for PLC software and how test suites are generated. In the end we compare pairwise testing done by CTT with pairwise testing done by ACTS.
The pairwise algorithm is a combinatorial testing technique that automatically creates test suites, also known as covering arrays [24]. Instead of covering every possible combination of inputs, the algorithm instead focus on covering all pairs [9, 23,24]. A system with 20 control each having 10 possible inputs will result in 1020possible combinations. A system like this would be very
imprac-tical to test using exhaustive testing since it will require billions of years to execute [9,24]. With the use of a pairwise combinatorial testing algorithm the amount of test cases can in an optimal situation be reduced to only 180.
5.1
CTT Implementation
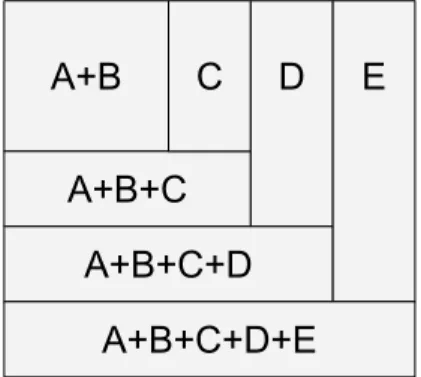
CTT is an open source program that is written in C#, Because of this fact the need for an API (Application Programming Interface) is not required and the pairwise algorithm can be added di-rectly into the main functionality of CTT. Some additional improvements were also implemented in the tool, such as the ability of handling other inputs than those originally available. Improve-ments like extending the list of viable input types was implemented to ease the process of testing PLC software in CTT. To answer RQ1, we used an algorithm that achieves pairwise combinatorial coverage: the IPOG algorithm [25]. The algorithm supports extension for 2 ≤ t ≤ 6 combinatorial testing and works by extending the test suite first horizontally and if needed vertically (see Figure
5.1). Let us consider an example with five parameters. The pairwise algorithm creates all 2-way combinations of parameters A and B, it will start by first horizontally extending with parameter C, and if the test suite lacks test cases to cover all AC and BC combinations, it performs a ver-tical extension by extending the test suite with additional test cases before repeating this for all remaining parameters.
A+B+C
A+B+C+D
A+B+C+D+E
C
A+B
D
E
M¨alardalen University Bachelor Thesis
The old version and the updated version of CTT, together with the raw data used in this thesis can be found at the following GitHub repository1. It is worth to note that only 2-way combinations are
possible in CTT. For greater t-way strength the implmented algorithm needs some minor changes. In addition to extending CTT in terms of the algorithms used, the tool has been updated by fixing some known bugs and increasing the usability of the CTT tool. Some of the more general improvements are: the visibility of the row numbers when displaying the created test suite in the tool as well as the ability to be able to resize the window. Beside these general improvements some additional changes have been made that only affect the pairwise algorithms of CTT, the most important one being the extension of data types supported. The original input types were limited to REAL, INT and BOOL. We implemented the support for UINT, USINT, LONG and ULONG. Additional we fixed some known problems: in an earlier version of the program the application crashed when using tests that contained a large number of inputs. This happened because the operating system saw that the main thread (which handled both GUI and test generation) was under such tremendous load that the GUI of the program froze for long periods of time. Therefore the pairwise algorithm was relocated to a background thread allowing it to run in parallel with the GUI. In addition to the background thread, the interface was improved by adding a coverage progress meter. The progress meter shows an abstract representation of the test generations com-pletion. It works by displaying the percentage of all parameters that completed their horizontal extension. We added a timer which measures the elapsed time for the test suite, as well as a label that displays the total amount of test cases.
5.2
Algorithm Implementation
The pseudo-code for the implemented pairwise algorithm is described in Section5.3. The algorithm starts off by sorting the parameters in a decreasing order and saving them in a list called ps, this is done to depend less on the vertical extension. It then creates an empty test suite ts before populating it with every possible combination of the first t parameters. The next task will then be to extend this test suite with each remaining parameter.
For every remaining parameter, line 10 to 30 in the algorithm, the procedure will start by creating a collection of every t-way combination of the parameter to be extended and the parameters already in the test suite. This is named as a collection π. The algorithm then goes through the existing test suite and for each case checks which available value of this extended parameter will cover most cases in π (line 14 to 17 in the algorithm). At this point the possibility of a tie exist where different inputs all cover the same amount of cases in π. There exist multiple ways to execute this tie-breaker, but since Huang et al. proved that a clean-cut best choice was absent [26], we chose to implement a first element tie-breaker. After modifying all cases in the test suite, there exist the possibility that π still contains elements. This is where the need for the vertical extension arises (line 20 to 29 in the algorithm). The vertical extension checks if there exist a test cases with ”Don0tCareV alues” in the test suite which can be modified to cover a test in π, if it exist then it modifies it (line 23). If not, it adds a new test case to cover the specific test before removing it from π (line 26 and 27). The parameter values in this new test case that are not needed to cover the case in π will be filled with ”Don0tCareV alues” and in this way the case is available for modification during pending extensions.
M¨alardalen University Bachelor Thesis
5.3
Implementing IPOG in CTT
Algorithm 1 Pseudo code of IPOG algorithm implemented in CTT
1: procedure IPOG(V arList, Randomise, T W ay)
2: VarList - List of parameters and their possible values
3: Randomise - boolean deciding if ”Don0tCare” values should be randomised
4: TWay - integer specifying the desired t-way strength (2 for pairwise)
5:
6: let ps be a list of the parameters (V arList) sorted in a decreasing order 7: let ts be all possible combinations of the first T way parameters in ps
8: let O be a list containing the index of all sorted in their original order
9: i ← T W ay
10: for i < pstotal do
11: Create π to be all T W ay combinations involving psi and all ps0 to psi−1 parameters 12: for each tsj in ts do (Horizontal Extension)
13: T ← tsj
14: for each k in psik do
15: extend T with psik
16: end for
17: Extend tsj with psik which after extending T covered most cases in π
(in case multiple psik are tied, the first one is chosen)
18: Remove all cases in π that are covered by the extended T
19: end for
20: for each πj in π do (Vertical Extension) 21: L ← Index of all changeable values in ts
22: R ← Index of L in ts that cover πj after being mutated
23: if R > -1 then (Exists a case that can be mutated to cover πj) 24: Mutate tsR to cover πj 25: else 26: Add πj to ts 27: Remove πj from π 28: end if 29: end for 30: end for
31: Create S [tstotal,pstotal] 32: if Randomise is true then
33: for each tsi in ts do 34: for each tsik in tsi do
35: if tsik is Don0tCareV alue then
36: tsik ← Random value between psj 0 and psj max
37: end if 38: end for 39: end for 40: end if 41: for each tsi in ts do 42: for each tsik in tsi do 43: SiO j ← tsik 44: end for 45: end for 46: return S 47: end procedure
M¨alardalen University Bachelor Thesis
5.4
CTT vs ACTS
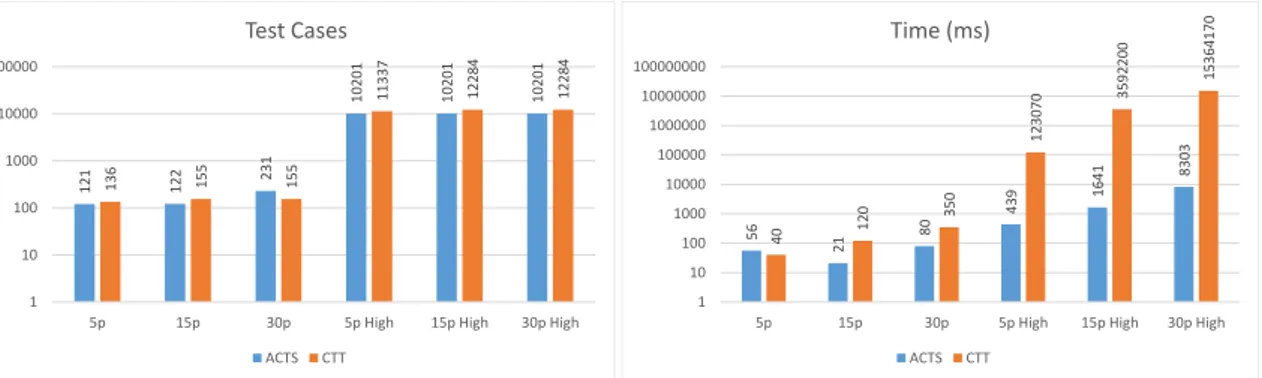
Since we have implemented our own version of pairwise test generation in CTT, a comparison between CTT and ACTS, an already know combinatorial too, was helpful in providing some qualitative measures on how well CTT performed. CTT is working well both in terms of the time it takes to generate all the test cases and the number of test cases needed to provide full pair coverage on small parameter sets with short intervals (see Figure5.2). On these small sets CTT is comparable and in some cases even better than ACTS. However when it comes to larger parameter sets with longer intervals, CTT is not working as well as ACTS. The difference is most dramatic when looking at the time consumption of generating test suites for the larger parameter sets with wider intervals. The fact that CTT has a much longer execution time compared to ACTS tells us that even though CTT is working fine in terms of pair coverage, it has a much higher time complexity than ACTS. As shown in Figure5.2 the small programs with shorter interval ranges are generated almost as fast in CTT as in ACTS, but when it comes to the longer intervals CTT’s execution time is quite high compared to ACTS. Due to time constraints during development of CTT the time complexity was not the priority of this thesis. This is due to the fact that time to generate test suites is not an important aspect of the evaluation when it comes to test suites quality. The focus of this thesis was on creating a functioning pairwise algorithm that is comparable to ACTS in terms of test suite size.
121 122 231 10201 10201 10201 136 155 155 11337 12284 12284 1 10 100 1000 10000 100000
5p 15p 30p 5p High 15p High 30p High
Test Cases ACTS CTT 56 21 80 439 1641 8303 40 120 350 123070 3592200 15364170 1 10 100 1000 10000 100000 1000000 10000000 100000000
5p 15p 30p 5p High 15p High 30p High
Time (ms)
ACTS CTT
Figure 5.2: Showing number of test cases and the time it took to generate them with ACTS and CTT.
Chapter 6
Results
In this section the data collected from the experiment is presented and analysed. Table 6.1 was composed. We present the mutation scores, code coverage results and the number of test cases in each collected test suite (i.e., manually created test suites by industrial engineers, pairwise test suites, and random test suites of the same size as the ones created using pairwise). This table lists the minimum, median, mean, maximum and standard deviation values. The data provided are the results from the case study performed on 45 PLC programs. Additional information regarding a specific program is available in the raw data provided in the GitHub repository.
Standard Deviation Mean Median MIN MAX
Code Coverage Pairwise 10.35 93.95 100.00 50.00 100.00 Engineer 6.71 97.29 100.00 63.64 100.00 Random 15.06 84.79 87.50 50.00 100.00 Mutation Score Pairwise 25.69 81.58 95.24 12.77 100.00 Engineer 14.22 88.90 95.00 44.44 100.00 Random 30.06 75.68 89.47 6.06 100.00 Number of tests Pairwise 37.05 21.20 6.00 4.00 152.00 Engineer 12.26 12.98 7.00 2.00 56.00 Random 37.05 21.20 6.00 4.00 152.00
Table 6.1: Table displaying an overview of respective methods score.
6.1
Fault detection
From the data shown in Table6.1it is clear that manual test suites are better in terms of mutation score compared to pairwise generated test suites. Even though pairwise generated test suites did well with an average mutation score of 81.58%, it is still lower than the mutation score achieved by manual tests (88.90% mutation score in average). The results shown in Table6.1also provide evidence that random tests achieve an average mutation score of 75.68% which is lower than the mutation score achieved by either manual tests and pairwise generated ones.
M¨alardalen University Bachelor Thesis
6.2
Number of tests
Based on the data shown in Table6.1we can see that manual tests contain in average 12.98 test cases per test suite. Pairwise and random generated tests have the exact same average value of 21.20 test cases per test suite. The random tests were generated with the same number of tests as pairwise testing.
6.3
Code coverage
Table 6.1 provides useful results in terms of code coverage. In our study, manual test suites achieved an average code coverage of 97.29% compared to pairwise generated test suites that achieved 93.95% code coverage. The results also show that pairwise performs better than random test suites of the same size.
6.4
Data Distribution
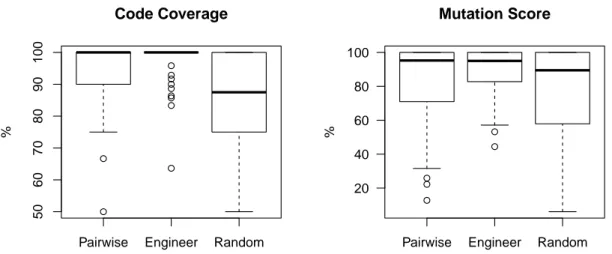
By using boxplots, we are able to represent the distribution of the data collected. Boxes spans from 1st to 3rd quartile, black middle lines mark the median and the whiskers extend up to 1.5x the inter-quartile range and the circle symbols represent outliers. Looking at the boxplots shown in Figure6.1 we can see that manual test suites written by engineers achieve better results than both pairwise and randomly generated test suites. The boxplot shows that pairwise had a high density of mutation scores between 90 and 100%. As shown in Figure6.2, even though pairwise testing is worse in average than manual testing regarding to the number of test cases, Figure6.2
shows that pairwise testing had a low distribution of the number of test cases, around 6 test cases in a test suite. The biggest contribution to the somewhat misleading average value is due to the stray values. A boxplot showing the number of tests in a linear scale (figure 8.5) is available in Appendix in Chapter8. The ”Program Information” boxplot shows the distribution of the number of parameters as well as generated mutants in the programs used in this thesis.
● ● ● ● ● ● ● ● ● ● ●
Pairwise Engineer Random
50 60 70 80 90 100 Code Coverage % ● ● ● ● ●
Pairwise Engineer Random 20 40 60 80 100 Mutation Score %
Figure 6.1: Code Coverage and Mutation Score achieved by each testing technique. Pairwise stands for pairwise testing, Engineer represents the manual tests created by industrial engineers and Random stands for random tests of the same size as Pairwise tests.
M¨alardalen University Bachelor Thesis ● ● ● ● ● ● ● ● ● ● ● ● ● ● ● ● ● ● ● ● ● ● ● ● ● ● ● ● ●
Pairwise Engineer Random 2 5 10 20 50 100 Number of Tests Amount ● ● ● ● ● ● ● ● ● Inputs Mutants 5 10 20 50 100 Program Information
Figure 6.2: Number of Tests and Program information achieved by each testing technique and the program studied. Pairwise stands for pairwise testing, Engineer represents the manual tests created by industrial engineers and Random stands for random tests of the same size as Pairwise tests.
6.5
Detailed Overall Comparison
To better explain the results shown in Sections6.1,6.2,6.3and6.4we noticed that pairwise testing did for some programs produce better results than the manual tests. This lead to a detailed eval-uation of the cases which produced the results shown in Figure6.3 (a more detailed comparisons can be found in the appendix in chapter8).
We can observe that pairwise did in fact perform better than manual tests in 25 of the cases out of the total number of 45 tests regarding to the number of test cases. For 16 of the investigated cases manual testing performed better than pairwise testing in terms of number of test cases. Since the results in Table 6.1 showed slightly different results, we tried to shed some further light on this issue (see Figure6.4). Even though pairwise testing in most of the cases produced fewer test cases, the test suites where it produced more it produced a lot more.
Regarding code coverage, manual testing performed better than pairwise in terms of achieved coverage for 13 programs. In comparison for only 4 programs were pairwise testing performed better and for 28 of the programs they performed equally good.
M¨alardalen University Bachelor Thesis 4 28 19 25 4 10 16 13 16 0 5 10 15 20 25 30 35 40 45 50
Number Of Tests Code Coverage Mutation Score
Case Evaluation
Equal Pairwise Better Manual Better
Figure 6.3: Evaluation of pairwise and manual performance regarding each program.
954 584 0 200 400 600 800 1000 1200
Number of Tests Cases
Am
o
u
n
t
Total Number Of Test Cases
Pairwise Manual
Figure 6.4: Total number of test cases for pairwise and manual methods.
6.6
Related work
As far as we know this is the first study that looked at pairwise generated test suites and how they compare to manually created ones when testing PLC embedded software. Since we have not found any other similar studies we were not sure what results we could expect. However there have been studies investigating how well pairwise generated test suites preform in other environments that provided guidelines on what we could expect in terms of code coverage and mutation score. Comparing some of the previous results with our own we found that Cohen et al. [27] achieved block coverage of 90% for pairwise generated test suites. These test suites where generated by a tool called Automatic Efficient Test Generator (AETG). The same tool was used by Burr and Young [28] to achieve similar results in a different study: their study reached 93% block coverage. Both theses studies show similar results to what we have achieved with pairwise in terms of decision coverage. Shown in table 6.1 our average decision coverage achieved by pairwise generated test suites is 93.95%. Vilkomir and Anderson [29] received MC/DC coverage results in a slightly lower range of 77.8%. An interesting fact about Vilkomir and Andersons experiment is that it was conducted on programs with 20 parameters which is significantly higher than our average of 9.3 parameters per program.
M¨alardalen University Bachelor Thesis
6.7
Threats to validity
In this thesis we used automatically generated of mutants to provide the possibility of measuring mutation score. It might very well be that faults created by industrial engineers would yield dif-ferent or even more accurate results. However there are some evidence suggesting that injected faults are a viable substitute for the ones created by developers [30].
We used CTT and our own version of IPOG pairwise algorithm to automatically generate our test suites. There is a possibility to get different result if we were to use some other tool such as ACTS for the generating of test suites. According to the data in Figure5.2 it is even likely that the results might be slightly different using ACTS, when considering the number of test cases in the test suite.
To collect our data we have used a set of programs provided from the engineers at Bombardier. We used 53 programs at the start of the thesis. Out of these 53 only 45 could be used for various reasons. To be able to produce more conclusive results a much larger set of programs would have been needed.
Chapter 7
Conclusion
In this thesis we investigated the performance of automatically generated test suites using a pair-wise algorithm compared to test suites manually created by industrial engineers. To answer this we took the approach of implementing a pairwise version of the IPOG algorithm in a tool called CTT, which we used to automatically generate test suites. In terms of mutation score, manual test suites achieved a mean score of 88.90% whereas pairwise achieved a score of 81.58%. Manual tests achieved better code coverage of 97.29% compared to 93.95% for pairwise testing.
After investigating the results concerning individual and total number of tests cases for pair-wise and manual test suites, it is clear that pairpair-wise has a higher over all number of test cases. Nevertheless, if we direct our attention towards the numbers of test cases in each test suite, we find that pairwise had a lower number of test cases in a higher amount of test suites compared to manual. One could argue that the main reason that pairwise is fairing fairly good compared to manual test suites is that it has been allowed a higher number of test cases than what manual tests are using. A fair argument, but this is where the use of random as a baseline value comes in very handy. By the approach taken when generated the random test suites, random has the exact same number of tests as pairwise and pairwise is still outperforming random on both code coverage and mutation score see6.1. These results conclude that pairwise is doing something better than ran-dom. Another important aspect of how well pairwise is preforming is how high mutation score it can achieve. According to Kuhn et al. [9] we should expect results to be somewhere in the interval of 50-97% when it comes to mutation score. Once again we look at table 6.1 and see that our mutation score of 81.58% is right in the interval that other studies have predicted.
To answer our research questions shown in section2.3:
• RQ1: The implementation of the pairwise algorithm used was the IPOG algorithm, a thor-ough description of the implementation and algorithm can be found in chapter5.
• RQ2: Looking at both mean score and individual cases it is shown that manual tests performs better at fault detection.
• RQ3: While only measuring mean value, the manual tests suits were the winner here, but as shown in section6.5 pairwise is the winner when investigating the number of test suites instead of mean value. Thus a clear answer is absent.
• RQ4: Similarly to mutation score, manual tests performed better both in terms of mean value and individual cases, but worth noting here is that the times both pairwise and manual performed equal is greater than their individual achievements together.
M¨alardalen University Bachelor Thesis
7.1
Future work
In this thesis we limited the random algorithm to only generate the same amount of tests as pair-wise does. It would be interesting to see if the results that random achieves improves if we allow a much higher number of tests to be generated. We would still get a fair comparison between pairwise and random if we allowed random to generate as many test cases as possible during the same time it takes for pairwise to generate its test suite. A larger number of tests could very well provide better results from running a random algorithm.
Number of tests Mutation Score
Example 1 Pairwise 30 86.84% Engineer 11 78.95% Random 30 89.47% Example 2 Pairwise 30 86.84% Engineer 6 68.42% Random 30 81.58% Example 3 Pairwise 6 36.00% Engineer 29 70.00% Random 6 29.00%
Table 7.1: Showing three examples of number of tests and mutation score for pairwise, engineer (manual) and random test suites.
There are examples to be found where all of the three ways to generate test suites out preformed the others see table 7.1. With this is mind we want to raise the thought of combining either all three of them or two of them to see if it is possible to enhance the results. Too answer this a study on which of the different faults each way of testing kills needs to be conducted. If a study of this kind show that in many cases pairwise, engineers and random algorithm finds and kills different mutations, there is a good chance that a much higher mutation score can be achieved by combining different testing techniques.
In the pairwise algorithm, there is a place where a tie breaking has to be done on which value should be picked first when different values cover the same amount of possible test cases. As previously mentioned, Huang et al. [26] had discovered that there is no clear choice to handle these ties. Since CTT is a program developed especially for PLC programs, the tie breaking could be further investigated to present more distinct results according to their platform and type of programs. If the study shows that there are specific tie breaking techniques that would benefit Bombardiers programs, these should be implemented in CTT. By doing this CTT would be even more tailored for Bombardier and take another step in distinguishing itself from other applications like ACTS.
As shown in figure 5.2 the time consumption of CTT is sky rocketing when a large program is entered into the tool. This is happening because the pairwise algorithm that CTT is using have a high time complexity. The most obvious way to solve the problem with time consumption on larger programs would be to improve the algorithm in a way that will lower its time complexity. Just by looking at the time it takes ACTS to run the same large programs we know that it is possible to make improvements to the time complexity.
There is another way to lower the time consumption of CTT’s pairwise algorithm too. This is something that can be done either in correlation with rewriting the algorithm or as a free standing
M¨alardalen University Bachelor Thesis
improvement. At this point the pairwise algorithm in CTT is making sure that every single value in an interval of a parameter is tested at least one time. If an integer has an interval of 0-3, it will test 0,1,2,3 at least one time each, the same goes for larger intervals. A way to reduce the number of test cases in each test suite would be to treat intervals at ranges of interesting values. For example, if we have the interval of 0-100, a change in the algorithm could be made to instead of interpret 0-100 as 101 different values it interpret it as an range of interest and then pick a few values that covers the range, let us say 0, 25, 50, 100 and 101 would be a decent representation of that range. With this method we have reduced the number of values that needs to be tested on that specific interval from 101 to 5. A reduction like this would greatly decrease the number of test cases in a test suite using pairwise algorithm, and by reducing the number of test also reduce the time it it takes to create the test suite.
As mentioned in ”Threats to validity” in section 6.7, the data used in this study is of a small quantity. Redoing the study with a larger amount of PLC programs, that is divided into categories of small, medium and large programs, could provide more trustworthy results.
The last and maybe biggest improvement to CTT would be the addition of greater strength t-way combinations. The IPOG algorithm CTT has implemented does at the moment only support 2-way, but most of the code has been adapted to handle a higher strength. The biggest exception to this would be the creation of the π collection. By changing this to support other t values, the possibility for a follow up study is presented. Are the increased test suite sizes worth it in terms of fault detection? The biggest test suite in this study was presented to be 152 test cases, this was with a program with four parameters all with range between 0-10, meaning 11 possible inputs. Pairwise would in the most optimal case generate 112 = 121 test cases, 3-way would generate 113= 1331 and 4-way 114= 14641, this is not adding the vertical extension that could happen.
Bibliography
[1] R. Kitchin and M. Dodge, Code/space: Software and everyday life. Mit Press, 2011. [2] P. Ammann and J. Offutt, Introduction to software testing. Cambridge University Press,
2008.
[3] G. J. Myers, C. Sandler, and T. Badgett, The art of software testing. John Wiley & Sons, 2011.
[4] L. S. Ghandehari, J. Czerwonka, Y. Lei, S. Shafiee, R. Kacker, and R. Kuhn, “An empirical comparison of combinatorial and random testing,” in Software Testing, Verification and Vali-dation Workshops (ICSTW), 2014 IEEE Seventh International Conference on. IEEE, 2014, pp. 68–77.
[5] G. Fraser and A. Arcuri, “Evosuite: automatic test suite generation for object-oriented soft-ware,” in Proceedings of the 19th ACM SIGSOFT symposium and the 13th European confer-ence on Foundations of software engineering. ACM, 2011, pp. 416–419.
[6] W. Visser, C. S. Psreanu, and S. Khurshid, “Test input generation with java pathfinder,” ACM SIGSOFT Software Engineering Notes, vol. 29, no. 4, pp. 97–107, 2004.
[7] C. Pacheco, S. K. Lahiri, M. D. Ernst, and T. Ball, “Feedback-directed random test genera-tion,” in Software Engineering, 2007. ICSE 2007. 29th International Conference on. IEEE, 2007, pp. 75–84.
[8] N. Tillmann and J. De Halleux, “Pex–white box test generation for. net,” in Tests and Proofs. Springer, 2008, pp. 134–153.
[9] R. Kuhn, R. Kacker, Y. Lei, and J. Hunter, “Combinatorial software testing,” Computer, vol. 42, no. 8, pp. 94–96, 2009.
[10] M. Jamro, “Pou-oriented unit testing of iec 61131-3 control software,” Industrial Informatics, IEEE Transactions on, vol. 11, no. 5, pp. 1119–1129, 2015.
[11] J. Donandt, “Improving response time of programmable logic controllers by use of a boolean coprocessor,” in CompEuro’89.,’VLSI and Computer Peripherals. VLSI and Microelectronic Applications in Intelligent Peripherals and their Interconnection Networks’, Proceedings. IEEE, 1989, pp. 4–167.
[12] R. W. Lewis, Programming industrial control systems using IEC 1131-3. Iet, 1998, no. 50. [13] K. Doganay, M. Bohlin, and O. Sellin, “Search based testing of embedded systems
imple-mented in iec 61131-3: An industrial case study,” in Software Testing, Verification and Val-idation Workshops (ICSTW), 2013 IEEE Sixth International Conference on. IEEE, 2013, pp. 425–432.
[14] W. Bolton, Programmable logic controllers. Newnes, 2015.
[15] E. Jee, D. Shin, S. Cha, J.-S. Lee, and D.-H. Bae, “Automated test case generation for fbd programs implementing reactor protection system software,” Software Testing, Verification and Reliability, vol. 24, no. 8, pp. 608–628, 2014.
M¨alardalen University Bachelor Thesis
[16] A. Orso and G. Rothermel, “Software testing: a research travelogue (2000–2014),” in Proceed-ings of the on Future of Software Engineering. ACM, 2014, pp. 117–132.
[17] Y. Kim, Y. Kim, T. Kim, G. Lee, Y. Jang, and M. Kim, “Automated unit testing of large industrial embedded software using concolic testing,” in Automated Software Engineering (ASE), 2013 IEEE/ACM 28th International Conference on. IEEE, 2013, pp. 519–528. [18] ACTS, “ACTS User Guide - how to use the ACTS test generation tool,”http://csrc.nist.gov/
groups/SNS/acts/documents/acts user guide 2.92.pdf, accessed May 16, 2016.
[19] L. Yu, Y. Lei, R. N. Kacker, and D. R. Kuhn, “Acts: A combinatorial test generation tool,” in Software Testing, Verification and Validation (ICST), 2013 IEEE Sixth International Con-ference on. IEEE, 2013, pp. 370–375.
[20] R. A. DeMillo, R. J. Lipton, and F. G. Sayward, “Hints on test data selection: Help for the practicing programmer,” Computer, no. 4, pp. 34–41, 1978.
[21] J. H. Andrews, L. C. Briand, Y. Labiche, and A. S. Namin, “Using mutation analysis for as-sessing and comparing testing coverage criteria,” IEEE Transactions on Software Engineering, vol. 32, no. 8, pp. 608–624, Aug 2006.
[22] L. Inozemtseva and R. Holmes, “Coverage is not strongly correlated with test suite effective-ness,” in Proceedings of the 36th International Conference on Software Engineering. ACM, 2014, pp. 435–445.
[23] X. Wang, L. Zhang, and P. Tanofsky, “Experience report: how is dynamic symbolic execution different from manual testing? a study on klee,” in Proceedings of the 2015 International Symposium on Software Testing and Analysis. ACM, 2015, pp. 199–210.
[24] R. Kuhn, Y. Lei, and R. Kacker, “Practical combinatorial testing: Beyond pairwise,” IT Professional, vol. 10, no. 3, pp. 19–23, 2008.
[25] Y. Lei, R. Kacker, D. R. Kuhn, V. Okun, and J. Lawrence, “Ipog/ipog-d: efficient test generation for multi-way combinatorial testing,” Software Testing, Verification and Reliability, vol. 18, no. 3, pp. 125–148, 2008.
[26] R. Huang, J. Chen, R. Wang, and D. Chen, “How to do tie-breaking in prioritization of interaction test suites?.” in SEKE, 2014, pp. 121–125.
[27] D. M. Cohen, S. R. Dalal, J. Parelius, and G. C. Patton, “The combinatorial design approach to automatic test generation,” IEEE software, vol. 13, no. 5, p. 83, 1996.
[28] K. Burr and W. Young, “Combinatorial test techniques: Table-based automation, test gener-ation and code coverage,” in Proc. of the Intl. Conf. on Software Testing Analysis & Review. San Diego, 1998.
[29] S. Vilkomir and D. Anderson, “Relationship between pair-wise and mc/dc testing: initial experimental results,” in Software Testing, Verification and Validation Workshops (ICSTW), 2015 IEEE Eighth International Conference on. IEEE, 2015, pp. 1–4.
[30] R. Just, D. Jalali, L. Inozemtseva, M. D. Ernst, R. Holmes, and G. Fraser, “Are mutants a valid substitute for real faults in software testing?” in Proceedings of the 22nd ACM SIGSOFT International Symposium on Foundations of Software Engineering. ACM, 2014, pp. 654–665.
Chapter 8
Appendix
0% 10% 20% 30% 40% 50% 60% 70% 80% 90% 100% 1 3 5 7 9 11 13 15 17 19 21 23 25 27 29 31 33 35 37 39 41 43 45CODE COVERAGE
Pairwise EngineerM¨alardalen University Bachelor Thesis 0% 10% 20% 30% 40% 50% 60% 70% 80% 90% 100% 1 3 5 7 9 11 13 15 17 19 21 23 25 27 29 31 33 35 37 39 41 43 45
MUTATION SCORE
Pairwise EngineerFigure 8.2: Mutation score comparison between pair wise and manual tests for each program.
0% 10% 20% 30% 40% 50% 60% 70% 80% 90% 100% 1 3 5 7 9 11 13 15 17 19 21 23 25 27 29 31 33 35 37 39 41 43 45
SIZE OF TEST SUITE
Pairwise Engineer
M¨alardalen University Bachelor Thesis 0% 10% 20% 30% 40% 50% 60% 70% 80% 90% 100% 1 3 5 7 9 11 13 15 17 19 21 23 25 27 29 31 33 35 37 39 41 43 45
TIME SPENT TESTING
Pairwise Engineer
Figure 8.4: Execution time comparison between pair wise and manual tests for each program.
● ● ● ● ● ● ● ● ● ● ● ● ● ● ● ● ● ● ● ● ● ● ● ● ● ● ● ● ●