ROAD SAFETY PERFORMANCE IN BRAZIL: TOWARDS A
COMPOSITE INDICATOR
Jorge Tiago Bastos Federal University of Paraná
Departamento de Transportes da UFPR - DTT - Centro Politécnico, Bloco V - Jardim das Américas. Zip Code: 81.531-990 – Curitiba - PR, Brazil
Phone: + 55 41 3361 3595 E-mail: jtbastos@ufpr.br
Yongjun Shen, Hasselt University; Elke Hermans, Hasselt University; Tom Brijs, Hasselt University; Geert Wets, Hasselt University; Antonio Clóvis Pinto Ferraz, School of Engineering of São Carlos – University of São Paulo.
ABSTRACT
The monitoring of the road safety level in Brazil and particularly in its member states traditionally focuses on the available traffic fatality rates. However, this approach does not offer practical suggestions on how to improve road safety. In this context, the usage of Road Safety Performance Indicators (SPIs) is a growing and promising tendency. This research deals with the construction of a set of SPIs intended to serve as good indicators of the operational conditions of the road traffic system in each of the 27 Brazilian states. The set of 28 selected SPIs represents three domains (road user, environment and vehicle) and consists of further subdivisions. The hierarchical structure of the 28 indicators manifests the traditional distinction between the road user (RU), the environment (E) and the vehicle (V) domain of SPIs. In the first domain (1st to 10th indicator), road user behavior decomposes into alcohol (A), cell-phone (CP), protective systems (PS) and speeding (S). Protective systems decompose into seatbelt (SB) and helmet (H). In the second domain, environmental SPIs decompose into road (R) and health system (HS). Road (11th to 20ht indicator), decomposes into central division (CD), signing (SG) and roadside (RS). Signing decomposes into road markings (RM) and vertical signs (VS). Road markings decompose into central (C) and lateral (L). Health system (21st to 23rd indicator) decomposes into health professionals (HP) and health expenditure (HE). In the third domain, vehicle related SPIs (24th to 27th indicator), decompose into fleet composition (FC) and age of the fleet (AF). This paper aims to describe this innovative SPI research in Brazil, using data envelopment analysis to aggregate the SPIs into a composite indicator, as well as to show the potential for supporting future improvements on the theme. The results consist of graphical representations expressing the overall performance (composite indicator) and disaggregated performance (detailed per road safety domain) for all Brazilian states. The states were adequately divided into comparable clusters, accordingly: Cluster 1 - ES, MG, RJ, SP, PR, RS, SC and DF; Cluster 2 – AC, AP, AM, AP, PA, RO, RR, TO, GO, MS and MT; and Cluster 3 – AL, BA, CE, MA, PB, PE, PI, RN and SE. It enabled the setting of more clear and realistic benchmarks, in which the states of São Paulo (SP), Rio Grande do Norte (RN) and Acre (AC) figure as examples to be followed in their respective clusters. Therefore, policy makers from underperforming states have a more precise guidance to benefit from the experience of best performing states on improving the road safety situation.
1.
INTRODUCTION
The immense number of traffic fatalities on Brazilian roads resulted from the economic growth experienced during the last decades. The most recent numbers point to more than 42,000 traffic fatalities in 2013 (Ministério da Saúde, 2014). Yearly, many novice individuals start participating in the transportation system as motorized users, a considerable part of them in vulnerable two-wheeled vehicles. At the same time, non-motorized users endure the consequences of an unbalanced transportation policy, traditionally focused on individual motorized transport, which has prevailed in the country over the last decades.
From the strategic road safety planning point of view, in order to assess the effect of this kind of measures and also to monitor the road safety level throughout the country and particularly in its various member states, the traditionally available traffic fatality rates, such as fatalities per inhabitant or per registered vehicle, are the type of information most frequently used. Although very useful for a primary diagnosis and global view on the situation, the availability of fatality rates does not provide any suggestion on how to tackle the situation and improve road safety (Golob et al., 2004). In this context, the usage of Safety Performance Indicators (SPIs) in road safety research is a growing tendency to complement and provide extra information in addition to the traditional outcome-based diagnosis using traffic fatalities or injuries (Shen, 2012).
SPIs are measures reflecting the operational conditions of the road traffic system, which influence the system’s safety performance. The intention is to prevent the occurrence of problems at an early stage (before these problems result in accidents); in other words, an SPI serves as an assisting tool in assessing the current safety conditions, monitoring the evolution, measuring impacts of various safety interventions, making comparisons, and other purposes (Vis et al., 2005; Hakkert and Gitelman, 2007). In summary, an SPI should manifest real operational conditions and/or the power of remedial post accident measures.
SPIs are usually formulated with respect to the triad “road user – road – vehicle”, which is the standard decomposition of a road safety problem (WHO, 2004). In a broader interpretation of the road related aspect, the more recent literature labels it as an environment related domain with the inclusion of trauma management aspects too; e.g. Shen (2012).
Despite the level of complexity of a road safety explanatory framework, due to the demand for translating this knowledge into objective guidelines for road safety, it is apparently more valuable to invest in key indicators more closely related to the problem under investigation. In general, according to the European literature on SPIs, the following aspects by road safety domain are usually covered in research on the theme (Morsink et al., 2005; Hakkert and Gitelman, 2007; Vis and Eksler, 2008; Wegman et al., 2008; Shen et al., 2011):Road user: drink-and-drive, speeding, and protective systems wearing rates (helmet and seatbelt); Road/environment: road network, road design, quality of medical treatment, arrival time of emergency services at the place of the crash; Vehicle: fleet composition, fleet age and crashworthiness.
This research describes the construction of the CI is based on a data envelopment analysis procedure, in which each Brazilian state (the decision making units) search for the most favorable combination of SPIs and corresponding weights, so that any state is favored or flawed due to an unfair weight allocation process. The availability of this sort of CI is a crucial input information for decision makers on designing general policies for the nation, as well as specific one adapted to the context of each member state or region.
After discussing data quality and availability in Sections 2 and 3, this paper describes the process of building a composite indicator (CI) from the entire set of SPIs considered in this research through the application of data envelopment analysis in Section 4. Section 5 discusses the main results. Finally, Section 6 contains the conclusive comments and recommendations for future research.
2.
SPI DATA SOURCES AND AVAILABLE DATA IN BRAZIL
In terms of road user behavioral indicators in traffic, there are few researches at the national level that provide applicable information. One example is the research that the Ministry of Health of Brazil develops, named the VIGITEL (Telephone Survey System for Monitoring Risk and Protection Factors for Chronic Illness), which consists in an annual telephone survey performed in the 26 Brazilian state capitals and in the national capital. Although the focus of VIGITEL is not road safety, there are some questions concerning the drink-and-drive habits. The Ministry of Transportation provides information related to protective systems, however for very specific conditions, such as wearing rate of seatbelt or helmet federal highways accidents (Ministério dos Transportes, 2013).
The State Traffic Departments (DETRANs), an entity of the National Traffic System, control the statistics on traffic infractions in its respective state. Due to the absence of data concerning the road user behavior in traffic, the usage of these data under limited assumptions was the only alternative to enable the consideration of the road user aspect in the Brazilian SPI research. Therefore, we collected a dataset on infraction numbers due to the use of cell-phone while driving, the non-use of a seatbelt, the non-use of a helmet and speeding.
Regarding the environment related indicators, the National Confederation of Transports (CNT) periodically publishes highway related information in the form of annual reports intending to evaluate maintenance of the Brazilian paved highways according to perceptible aspects for the users and the delivered road safety level. Data on health system related indicators is based on the Ministry of Health for the information concerning the health expenditure and the number of health professionals.
The National Traffic Department (DENATRAN), linked to the Ministry of Cities, is an entity of the National Traffic System (SNT) and the main official provider of motor vehicle fleet data. DENATRAN’s fleet is an attractive data source due to the disaggregation level of the information it provides: per state, per vehicle class and per vehicle age.
3.
INDICATORS SELECTION
Due to the limited options for the definition of indicators for the case of Brazil, it would not be a reasonable approach to straightforwardly base the choice of indicators on a single criterion. For this reason, in order to guide the process of choosing the most adequate SPIs we tried to maintain the balance regarding the following aspects: correlation with the traffic fatality related rates, theoretical relationship with the road safety problem, objectivity of the indicator, outlier detection and the level of missing observations.
Intending to use similar data periods, we used the average values in the period 2009-2011, with exception of the infraction related indicators, for which we used the average in the period 2009-2013 (to decrease the number of missing observations). Finally, even though one indicator fulfills all the previously mentioned criteria, if it is available for only a few states its choice as an SPI might be compromised. Although this research applies a missing data imputation procedure, the larger the number of imputed missing observation, the higher the uncertainty level of the indicator set.
3.1. The set of chosen SPIs
After considering the aforementioned aspects, we decided to use a set of 28 SPIs, divided into the three road safety domains. Tables 1, 2 and 3 contain the description of the chosen set of SPIs, representing the traditional distinction between road user, environmental and vehicle related SPIs, as well as their corresponding subdivisions in subordinated domains.
Figure 1 illustrates the hierarchical structure of the SPIs for the computation of the composite indicator (CI) for each Brazilian state. The numbers in Figure 1 correspond to the identification of each indicator according to Tables 1, 2 and 3. The hierarchical structure manifests the already mentioned traditional distinction between the road user (RU), environmental (E) and vehicle (V) domain of SPIs. In the first domain (1st to 10th indicator), road user behavior decomposes into alcohol (A), cell-phone (CP), protective systems (PS) and speeding (S). Protective systems decompose into seatbelt (SB) and helmet (H). In the second domain, environmental SPIs decompose into road (R) and health system (HS). Road (11th to 21st indicator), decomposes into central division (CD), signing (SG) and roadside
(RS). Signing decomposes into road markings (RM) and vertical signs (VS). Road markings decompose into central (C) and lateral (L). Health system (22nd to 24th indicator) decomposes into
health professionals (HP) and health expenditure (HE). In the third domain, vehicle related SPIs (25th to 28th indicator), decompose into fleet composition (FC) and age of the fleet (AF). The (+) or (-)
signals below each SPI indicate the direction of the normalization, i.e., (+) means the higher higher the SPI value, the better the road safety situation; (-) means the higher the SPI value, the worse the road safety situation.
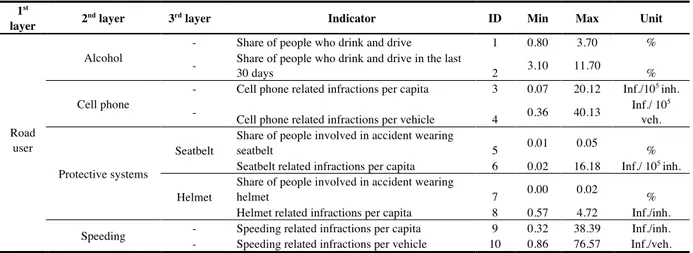
Table 1: Description of the chosen SPIs for the “road user” main domain.
1st
layer 2
nd layer 3rd layer Indicator ID Min Max Unit
Road user
Alcohol
- Share of people who drink and drive 1 0.80 3.70 %
- Share of people who drink and drive in the last
30 days 2 3.10 11.70 %
Cell phone
- Cell phone related infractions per capita 3 0.07 20.12 Inf./105 inh.
-
Cell phone related infractions per vehicle 4 0.36 40.13
Inf./ 105
veh.
Protective systems
Seatbelt
Share of people involved in accident wearing
seatbelt 5 0.01 0.05 %
Seatbelt related infractions per capita 6 0.02 16.18 Inf./ 105 inh.
Helmet
Share of people involved in accident wearing
helmet 7 0.00 0.02 %
Helmet related infractions per capita 8 0.57 4.72 Inf./inh.
Speeding - Speeding related infractions per capita 9 0.32 38.39 Inf./inh.
Table 2: Description of the chosen SPIs for the “environment” main domain. 1st layer 2nd layer 3rd layer 4th layer 5th
layer Indicator ID Min Max Unit
En v ir o n m en t Road Central
division - - Share of multilane highways 11 0.80 52.55 %
Signing
Road markings
Central
Share of highway length
with central road markings 12 69.17 99.43 %
Share of highway length with clearly visible central road markings
13 33.69 95.14 %
Lateral
Share of highway length
with lateral road markings 14 43.77 95.40 %
Share of highway length with clearly visible lateral road markings
15 31.87 91.96 %
Vertical signs
- Share of highway length
with vertical signs 16 29.43 86.16 %
-
Share of highway length with clearly visible vertical signs
17 34.12 99.19 %
-
Share of highway length with clearly legible vertical signs
18 24.33 91.80 %
Roadside
- -
Share of highway length equipped with adequate barriers
19 1.00 73.10 %
- -
Share of highway length with adequate barriers in risky curves
20 1.00 48.80 %
- - Share of highway length
with adequate shoulders 21 0.01 79.97 %
Health system
Health professionals
- - Number of medical doctors
per capita 22 0.06 0.37
Doc./103
inh.
- - Number of health
professionals per capita 23 2.64 9.78
Prof./ 103
inh. Health
expenditure - -
Health expenditure per
capita 24 360.71 847.29 R$/inh.
Table 3: Description of the chosen SPIs for the “vehicle” main domain.
1st layer 2nd layer Indicator ID Min Max Unit
Vehicle Fleet composition
Share of motorcycles in the total fleet 25 11.33 56.27 %
Share of trucks in the total fleet 26 1.77 6.02 %
Age of the fleet Share of 10-year vehicles or older 27 22.06 56.40 %
Figure 1: Hierarchical structure of the 28 SPIs used to compute the CI by means of the ML DEA-CI model.
The next step consists of the separation of the states into clusters (Figure 2), aiming to create groups of states with more comparable characteristics through the construction of hierarchical clusters using Ward’s method in the software R. Thus, the idea is also to compute the CI for each state in relation to its own cluster. The clustering is based on the combination of all the chosen SPIs for the 27 Brazilian states plus the highway density of each state (since there is a considerable number of highway related indicators in the chosen set of SPIs). The advantage of clustering in a road safety framework is to offer a more feasible basis for the safety performance comparisons and the transference of good experiences from best to under performing entities.
Figure 2: Clusters location.
The initials of each state represent: Distrito Federal (DF), Goiás (GO), Mato Grosso do Sul (MS), Minas Gerais (MG), Paraná (PR), Rio de Janeiro (RJ), Rio Grande do Sul (RS), Santa Catarina (SC) and São Paulo (SP) – Cluster 1 states; Alagoas (AL), Bahia (BA), Ceará (CE), Espírito Santo (ES), Maranhão (MA), Paraíba (PB), Pernambuco (PE), Piauí (PI), Rio Grande do Norte (RN) and Sergipe
(SE) – Cluster 2 states; Acre (AC), Amapá (AP), Amazonas (AM), Mato Grosso (MT), Pará (PA), Rondônia (RO), Roraima (RR) and Tocantins (TO) – Cluster 3 states.
4.
DATA ENVELOPMENT ANALYSIS
Data envelopment analysis or DEA is a term used to designate a “data oriented” approach that has become an attractive tool to deal with complex problems applying mathematical programming methods to handle a large number of variables and relations. The first concepts on the theme emerged in 1957 for measuring the productive efficiency of industries (Farrell, 1957), although about 30 years later Charnes, Cooper and Rhodes proposed its most widely known basic form (the CCR model) for the evaluation of production processes through exploring the relation between the amount of inputs and outputs. The entities under study, responsible to convert inputs into outputs, are named decision making units – DMUs (Cooper et al., 2011, 2000). Here, he 27 Brazilian states represent the set of DMUs.
The efficiency of a DMU usually varies between 0 and 1, with the first corresponding to the most inefficient and the second to the most efficient DMU. In other words, a DMU with a score equal to 1 is capable to convert all its inputs into outputs (output/input ratio equal to one); in contrast, an inefficient DMU will not succeed in converting all its inputs into outputs and its output/input ratio will not reach one. This efficiency measure is used in relation to a production frontier, and its construction is based on the best attainable performances; this frontier also supports a benchmarking process, an important tool to promote the transference of good practice actions from high to low-performing DMUs, suggesting that DMUs can learn from each others’ performance.
Many additional models were developed to support a variety of practical problems encountered from the introduction of the technique until today (e.g. Adler et al., 2002) including the conversion to a composite indicator model, in which indicators are combined into a single index (composite indicator).
4.1. DEA model for road safety assessment
In the road safety framework, for example, Bax et al. (2012) and Shen et al. (2010) for the case of Europe, applied this DEA technique in composite indicator research (as is the aim of this paper). Equation 1 presents an input-oriented converted form of the original CCR model, in which the inputs to be maximized refer to the SPI values of each state. Therefore, all SPIs point in the “safe” direction; this is, the larger the SPI value, the better the road safety situation. The scores indicating the best performers present a value equal to 1 (as in the original model), since they succeed in maximizing their sustained road safety level; and underperforming DMUs present a score lower than 1, since they did not succeed in maximizing their weighted inputs (or SPIs).
(1)
• – Optimum index score of DMUs;
• – j-th SPI of the s-th DMU;
• – Weight attributed to ;
OISs= max wSPIj j=1 q
∑
SPIj,s subject to wSPI j j =1 q∑
SPIj ,r ≤ 1 r =1,…,n wSPI j ≥ 0 j =1,…,q s =1,…,n OISs SPIj ,s wSPI j SPIj• – total number of DMUs; • – total number of SPIs;
For some practical complex problems, such as in the SPI research, it might be helpful to describe the issue under investigation in terms of its different categories linked in a multilayer hierarchy. By simply treating all the indicators in the same layer, obviously the information about the hierarchical structure of the indicators is being ignored and it further leads up to weak discriminating power and unrealistic weight allocations (Shen et al., 2011). This need for expressing a hierarchy present in the set of selected indicators motivated the development of the so-called multiple layer DEA-based composite indicator model (ML DEA-CI) by Shen et al. (2013). By solving Equation 2, the composite indicator based on a K-layered hierarchy of q SPIs can be calculated for each state s, where ufK is the weight
given to the f-th category in the K-th layer and wfK(K) denotes the non-negative internal weights
associated with the SPIs of the f-th category in the K-th layer; the sum of all wfK(K) within a particular
category is equal to one. The ML DEA-CI was computed with the software Lingo, developed by Lindo
Systems.
(2)
Additionally, we have to specify the concepts of optimum index score (OIS) and cross-index score (CIS). The first identifies the best performing DMUs (those with a score equal to one) among all the other assessed DMUs; however, the flexibility in selecting the most favorable weights for each DMU forbids the comparison on a common basis. It is therefore recommended to obtain the CIS from the
OIS, using an average value of the product between each DMU’s SPI and not only its own attributed
weights, but also all the other DMUs’ weights (Doyle and Green, 1994; Sexton et al., 1986). Equation 3 enables the computation of the CIS value (used for a direct comparison).
CISs= 1 n
( )
wSPI j ,r j=1 q∑
r=1 n∑
wSPI j ,r (3)• – Cross efficiency score of the DMU.
In order to guide the weight attribution process, avoiding unreasonable weight distributions as well as a “black box” effect, we applied different weights suggesting that road user related indicators are more important than environment indicators, which are more important than vehicle indicators. Therefore, the shares attributed to the main domains in the total CI value should be: 90%(CI) ≥ ShareRU > ShareE
> ShareV ≥ 5%(CI). Due to the same reasons, the weights attributed to indicators composing the same
domain or subdomain must vary within a range from 0.6 to 1.4 of their average weights; for example, alcohol (A) is divided in two SPIs, so the average weight of the indicators “1” and “2” is equal to 0.5 and thereby should lie between 0.3 and 0.7. Lastly, to avoid the concentration of high shares of the CI in a single SPI, we also introduced minimum and maximum shares for each indicator, accordingly: 0.01%(CI) ≤ Share1,…,28 ≤ 15%(CI).
5.
RESULTS
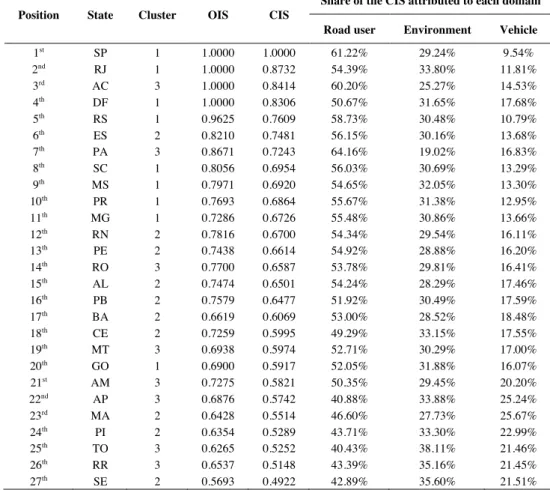
Firstly, according to the main goal of this research, we describe the general results of creating a road safety performance index for the entire set of states. Table 4 shows the OIS values and the CIS (which dictates the rank of states from best to worst performing) for each state. In addition, the table contains the shares of the CIS value attributed to each road safety domain (which are similar to the shares computed in relation to the OIS). The rank of the states presents reasonable statistically significant
n q OISs= max uf K fK1=1 q(K )
∑
( wK −1(K −1) fK −1∈AK(K )∑
(… wk(k ) fk∈Ak +1(k +1)∑
(… w2(2)( fk −1∈Af3(3)∑
wf 1 (1)SPI f1s)))) f1∈Af2( 2)∑
CISscorrelation coefficients at 95% confidence level with the outcome related rank based on the traffic fatalities per registered vehicle (equal to – 0.70).
Regarding the shares comparison, due to the inserted weight restrictions, the order of the relative importance of the road user, environment and vehicle related SPIs is the same in every state (ShareRU
> ShareE > ShareV). However, in the comparison of a particular domain share between different states,
the interpretation should obey the following logic: the smaller the share, the worse the performance in that domain.
Table 4: Rank of states according to the computed CIS, OIS and shares attributed to each road safety domain.
Position State Cluster OIS CIS
Share of the CIS attributed to each domain
Road user Environment Vehicle
1st SP 1 1.0000 1.0000 61.22% 29.24% 9.54% 2nd RJ 1 1.0000 0.8732 54.39% 33.80% 11.81% 3rd AC 3 1.0000 0.8414 60.20% 25.27% 14.53% 4th DF 1 1.0000 0.8306 50.67% 31.65% 17.68% 5th RS 1 0.9625 0.7609 58.73% 30.48% 10.79% 6th ES 2 0.8210 0.7481 56.15% 30.16% 13.68% 7th PA 3 0.8671 0.7243 64.16% 19.02% 16.83% 8th SC 1 0.8056 0.6954 56.03% 30.69% 13.29% 9th MS 1 0.7971 0.6920 54.65% 32.05% 13.30% 10th PR 1 0.7693 0.6864 55.67% 31.38% 12.95% 11th MG 1 0.7286 0.6726 55.48% 30.86% 13.66% 12th RN 2 0.7816 0.6700 54.34% 29.54% 16.11% 13th PE 2 0.7438 0.6614 54.92% 28.88% 16.20% 14th RO 3 0.7700 0.6587 53.78% 29.81% 16.41% 15th AL 2 0.7474 0.6501 54.24% 28.29% 17.46% 16th PB 2 0.7579 0.6477 51.92% 30.49% 17.59% 17th BA 2 0.6619 0.6069 53.00% 28.52% 18.48% 18th CE 2 0.7259 0.5995 49.29% 33.15% 17.55% 19th MT 3 0.6938 0.5974 52.71% 30.29% 17.00% 20th GO 1 0.6900 0.5917 52.05% 31.88% 16.07% 21st AM 3 0.7275 0.5821 50.35% 29.45% 20.20% 22nd AP 3 0.6876 0.5742 40.88% 33.88% 25.24% 23rd MA 2 0.6428 0.5514 46.60% 27.73% 25.67% 24th PI 2 0.6354 0.5289 43.71% 33.30% 22.99% 25th TO 3 0.6265 0.5252 40.43% 38.11% 21.46% 26th RR 3 0.6537 0.5148 43.39% 35.16% 21.45% 27th SE 2 0.5693 0.4922 42.89% 35.60% 21.51%
In Cluster 1, SP is the best performing state, with the best results regarding the road user domain (mainly in protective systems, speeding and cell-phone) and good results regarding the road/environment domain (performing particularly better in the road subdomain). In 2nd, DF presents
an average performance in the road user domain, but a relatively good performance in road/environment (mainly due to good results with respect to the health system) and the best performance in the vehicle domain (attributed to its most favorable results with respect to fleet composition). In 3rd, RJ performs also well, however this is more attributed to the road/environment
domain (presenting the best results for roads; as well as a good performance regarding health system); although not presenting the best road user related performance, RJ performs best regarding the alcohol subdomain. In 4th, RS shows a relatively good performance in the road user domain (mainly due to its performance on protective systems).
SC, PR, MG and MS do relatively well with respect to the age of the fleet and worst in the triad alcohol, health system and fleet composition. GO, the worst performing state, sustains its bad performance mainly due to the road user (in general) and health system related indicators, although it performs relatively well regarding the age of the fleet. To conclude the analysis for Cluster 1, in the three-domain perspective, they present a quite good association (at least in comparison to the display of the other clusters). Particularly regarding the road user related indicators, they present a high degree of association between themselves; in other words, those states that perform well on one road user related indicator tend to perform well on all the others as well. On the contrary, the disaggregation of the vehicle domain shows opposing tendencies for fleet composition and age of the fleet.
In Cluster 2, ES is the best performing state; this is most attributable to its good performance with respect to road user behavior (with emphasis on cell phone) and road/environment (with emphasis on the health system). RN, the second best overall performing state in this cluster, presents the best results in the road user domain (doing quite well essentially in speeding) and also decent values for the health system and fleet composition subdomains. In 3rd, PB has the best performance in road/environment related indicators (with emphasis on roads) and also the most favorable fleet composition. AL holds the 4th place, with intermediate performances in the three key domains,
although it shows good results on the alcohol and speeding indicators. In 5th position, PE appears with
an overall intermediate performance (in the triad road user, road/environment and vehicle), being the best performing state only regarding cell-phone behavior. In 6th position, BA presents a more
contrasting picture, with quite a good performance for the road user domain (mainly in alcohol and protective systems), despite unfavorable performances in the other two domains. CE and PI detain respectively the 7th and 8th position, in spite of CE’s good performance with respect to road/environment (with emphasis on roads) and PI’s satisfactory results for the vehicle domain, both states sustain very bad performances for the road user domain (with the most unfavorable performances especially on cell-phone and protective systems). In 9th, SE shows a general intermediate
performance for the main domains, but it performs relatively poor among the different aspects (with emphasis on speeding). MA is the worst performing state, in spite of its favorable performance regarding the age of the fleet. In comparison to Cluster 1, the defined parameters for evaluating the road safety situation present lower mutual association in Cluster 2.
In Cluster 3, AC exhibits the best performance, probably due to its favorable results in the road user and road/environment domain (including the relatively best performance on the health system). In 2nd
place, PA is a reference in the road user domain (mainly due to alcohol and cell-phone related indicators). MT is the next one in the rank, presenting intermediate performances regarding road user and road/environment and the worst performance regarding the vehicle domain (and its two subdivisions). In 4th and also in an intermediate position with respect to the main domains, AM has
better results for alcohol, cell-phone, speeding and fleet composition than for the rest of the indicators. In a similar general situation, RO holds the 5th position and it seems to be a specialist in road and
protective systems in the Cluster 3 context. In spite of its leading position concerning the vehicle domain (due to its good performance on the age of the fleet), AP performs poorly with respect to cell-phone, protective systems and health system, resulting in the 6th place. In 7th, RR does well in fleet composition, but quite bad in protective systems and roads. Although TO is the best state with respect to the age of the fleet, it results in the last position due to its very negative performance among almost all other indicators. The mutual association between the defined groups of SPIs presents a similar pattern in comparison to Cluster 2.
6.
CONCLUSIONS
This paper describes the research of SPIs in Brazilian states and the further development of a CI manifesting the overall picture of the most appropriate available information on the theme of road safety in the country. Actually, the background scenario for research on SPIs is somewhat unfavorable; however, the idea of this paper is to explore the available information and to deliver valuable conclusions from it. Although it is known that this information might not provide enough theoretical explanations of the road safety situation in every state, it consists of the part of the story that we can quantitatively assess and create meaningful insights on the evaluation of the overall situation of each road safety domain. Moreover, the idea is also that clarifying the current limitations is useful to offer source knowledge for future improvements on SPI research in Brazil.
Periodic data collection is encouraged in order to enable a monitoring process over time, creating support for re-planning the road safety strategy from time to time. For example, those states with bad performance on drink-and-drive behavior should invest more on enforcement measurers or campaigns to avoid this sort of behavior. An unfavorable environment situation might be tackled by i.e. improving signing or roadside conditions, or even by delivering a better quality health treatment for the injured individuals. Lastly, the vehicle domain might be improved by supporting policies to stimulate the usage of public transportation, removing drivers from vulnerable individual modes, such as the motorcycle.
The CI computation for three separate clusters enabled a more clear and realistic benchmarking process, since an efficacious action towards road safety in a certain state (i.e. concentrating efforts to improve an SPI situation) is more likely to generate desirable results in a state containing a similar background. For example, although ES is not between the top five best performing states at the national perspective, it is considered a benchmarking state for nine other states and it is mainly due to relatively better road user behavior and health system, suggesting that the states which are member of the same cluster should focus efforts towards these two aspects to improve their own road safety situation. In addition, Benchmarking recommendations suggest SP, ES and AC as good examples in their cluster contexts, instead of the vague and predictable indication of SP as an exclusive model state regarding SPIs for all other states. Now, policy makers from underperforming DMUs have a more precise guidance to improve the road safety situation because: first, they get insight regarding most of the problem aspects; second, there is the identification of a useful state to compare themselves to; third, it is possible to set up a more detailed study in order to check the measures taken in the benchmarking states.
REFERENCES
Adler, N., Friedman, L., Sinuany-Stern, Z. (2002). Review of ranking methods in the data envelopment analysis context. Eur. J. Oper. Res. 140, 249–265.
Bax, C., Wesemann, P., Gitelman, P., Shen, Y., Goldenbeld, C., Hermans, E., Doveh, E., Hakkert, S., Wegman, F., Aarts, L. (2012). Developing a Road Safety Index.
Cooper, W.W., Lawrence M. Seiford, Joe Zhu (2011). Data envelopment analysis: history, models and interpretations, in: Handbook on Data Envelopment Analysis, International Series in Operations Research & Management Science. Springer, pp. 1–39.
Cooper, W.W., Seiford, L.M., Tone, K. (2000). The basic CCR model, in: Data Envelopment Analysis: A Comprehensive Text With Models, Applications, References and Dea-Solver Software. Springer, pp. 21–40.
Doyle, J., Green, R. (1994). Efficiency and Cross-Efficiency in DEA: Derivations, Meanings and Uses. J. Oper. Res. Soc. 45, 567.
Farrell, M.J. (1957). The measurement of productive efficiency. J. R. Stat. Soc., 3 120, 253–290. Golob, T.F., Recker, W.W., Alvarez, V.M. (2004). Freeway safety as a function of traffic flow. Accid. Anal. Prev. 36, 933–946.
Hakkert, S., Gitelman, V. (2007). Road Safety Performance Indicators: Manual, Deliverable D3.8 of the EU FP6 project SafetyNet.
Ministério da Saúde (2014). Óbitos por causas externas [External causes deaths]. URL http://tabnet.datasus.gov.br/cgi/deftohtm.exe?sim/cnv/ext10uf.def (accessed 6.12.14).
Ministério dos Transportes (2013). Estatísticas de acidentes nas rodovias federais [Statistics of
accidents in federal highways]. Dep. Nac. Infraestrutura Transp. URL
http://www.dnit.gov.br/rodovias/operacoes-rodoviarias/estatisticas-de-acidentes (accessed 7.15.13). Morsink, P., Oppe, S., Reurings, M., Wegman, F. (2005). SUNflower+6: Development and application of a footprint methodology for the SUNflower+6 countries. SWOV, Leidschendam.
Sexton, T.R., Silkman, R.H., Hogan, A.J. (1986). Data envelopment analysis: Critique and extensions. New Dir. Program Eval. 1986, 73–105.
Shen, Y. (2012). Inter-national benchmarking of road safety performance and development using indicators and indexes: data envelopment analysis based approaches (PhD). Transportation Research Institute, Hasselt University, Diepenbeek.
Shen, Y., Hermans, E., Brijs, T., Wets, G. (2013). Data Envelopment Analysis for Composite Indicators: A Multiple Layer Model. Soc. Indic. Res. 114, 739–756.
Shen, Y., Hermans, E., Ruan, D., Wets, G., Brijs, T., Vanhoof, K. (2010). Evaluationg trauma managment performance in Europe: a multiple-layer data envelopment analysis model. Transp. Res. Rec. 2148, 739–756.
Shen, Y., Hermans, E., Ruan, D., Wets, G., Brijs, T., Vanhoof, K. (2011). A generalized multiple layer data envelopment analysis model for hierarchical structure assessment: a case study in road safety performance evaluation. Expert Syst. Appl. 38, 15262–15272.
Vis, M.A., Eksler, V. (2008). Road Safety Performance Indicators: Updated Country Comparisons, Deliverable D3.11a of the EU FP6 project SafetyNet.
Vis, M.A., Hafen, K., Lerner, M., Allenbach, R., Verbeke, T., Eksler, V., Haddak, M., Hollo, P., Arsenio, E., Cardoso, J. (2005). Building the European Road Safety Observatory. SafetyNet. Deliverable D3. 1 State of the art report on road safety performance indicators. (2005).
Wegman, F., J. Commandeur, E. Doveh, V. Eksler, V. Gitelman, S. Hakkert, D. Lynam, S. Oppe (2008). SUNflowerNext: Towards a composite road safety performance index. Deliverable D6.16 of the EU FP6 project SafetyNet. SWOV. URL http://www.swov.nl/rapport/sunflower/sunflowernext.pdf (accessed 10.29.13).