1
Improving antibiotics handling through
the use of lean methods
Master thesis
30 credits, Advanced level
Innovation, production and logistics
Karl Lidar
Supervisor (company): Åsa Sandberg
Supervisor (university): Koteshwar Chirumalla Examiner: Antti Salonen
2
Improving antibiotics handling through the
use of lean methods
Karl Lidar
Abstract
With the use methods originating from lean philosophy, the thesis focuses on improving health care in the specific process of mixing antibiotics. Value stream maps will be used for describing the current state of mixing antibiotics at an infection department. When viewing mixing processes from a lean perspective, all processes did not give value for the customer, in this case the patient. Through the use of different lean methods, improvements on the current state has been made. These improvements will establish the future state, a description of improved processes.
Conclusions drawn is that the problem can be divided into two categories, flow of information and movements. A machine were designed as a solution to the problems found in the current state. Both the flow of information and movements can then to some extent be automated, creating more value for the patient.
Keywords:
3
Table of Contents
Acknowledgements ... 3 1. Introduction ... 5 1.1 Background ... 5 1.2 Problem formulation ... 52. Aim and research question ... 5
3. Research method ... 6
3.1 Research context ... 6
Prevas ... 6
Hospital departments... 7
3.2. Research structure and process ... 8
3.3 Project limitations ... 8 3.4 Research approach ... 8 3.5 Data collection ... 9 Quantitative data ... 9 Literature ... 10 3.6 Data analysis... 12
3.6.1 Analysis of video recordings... 12
Definition of processes ... 12
Order of processes ... 13
Division of processes ... 13
Excel documentation ... 13
Construction of the graph ... 13
Construction of value-strem-map ... 13
3.6.2 Root cause analysis ... 14
The visual understanding of the problem ... 14
Different categories of waste... 14
Generalization of root causes connected to processes ... 14
Relationship between experience and process time ... 14
Generating of root causes ... 14
Generating solutions for the causes ... 15
Process maps ... 15
3.7 Validity and Reliability ... 15
3.8 Ethical considerations ... 16
4. Theoretical framework ... 16
4.1 Risks involving antibiotics ... 16
4.2 Philosophy of lean ... 17
4.3 Lean tools ... 17
Value stream map... 17
5S in lean ... 18
Process maps ... 19
Standardized work... 19
Poka Yoke ... 20
Root cause analysis ... 20
4
4.4 The applications of lean ... 21
4.4.1 Health care ... 21 Current situation ... 21 Barriers ... 22 4.4.2 Complex environments ... 22 5. Result ... 24 5.1 Current state ... 24 Processes ... 24 Flow of information ... 25
Value stream map... 25
5.2 Improvements through the use of lean ... 26
5.2.1 Deviation in the value stream... 27
5.2.2 Analysis of video recordings ... 28
Wastes in the processes ... 29
Applying standardized work and 5S ... 31
Solutions for wastes through automation ... 31
Hardware for automation ... 32
ISO-Standard ... 32
Limitations of the process map ... 32
Generating solutions to wastes ... 33
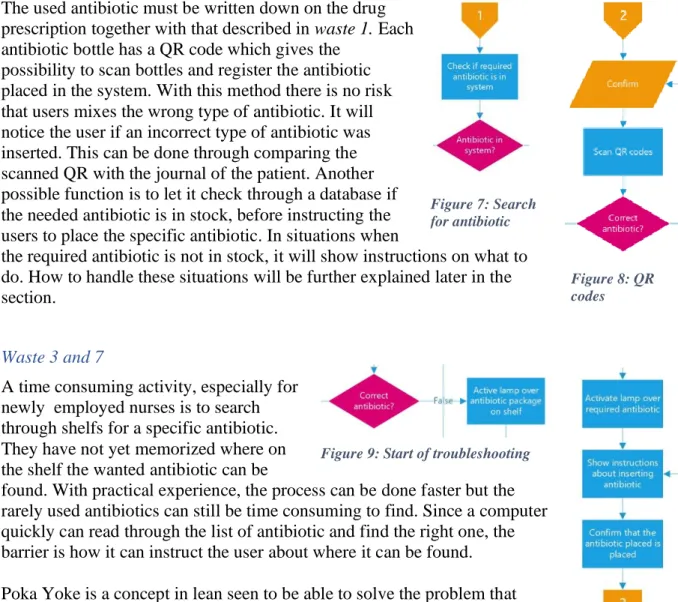
Waste 1 ... 33 ... 33 Waste 2 ... 34 Waste 3 and 7 ... 34 Waste 6, 8 and 9 ... 34 Waste 10, 11 and 12 ... 35 Waste 13 ... 36 Waste 14 and 15 ... 36 Waste 16 and 17 ... 37
Solutions for other problems ... 37
Substances with different names ... 37
Troubleshooting ... 38
Feedback from the manager ... 38
5.3 Future state ... 39
Safety ... 39
Process time ... 39
Information and motion ... 39
Investment plan ... 40
Capital budget ... 40
Closing statements in the result ... 41
6. Discussion ... 43
Lean methods in health care... 43
Engagement from nurses ... 43
Nurses knowledge and responsibility ... 44
Future possibilities ... 45
7. Conclusions and further research ... 47
References ... 48
5
1. Introduction
Health care is an expanding cost for societies and the causes can be found in ineffective processes. This is described in the background together with problem formulation. 1.1 Background
Technologic advancements in health care have resulted in new treatments for a lot of diseases. Hospital have therefore an obligation to take care of more patients than before because they can treat them. Due to this reason, more resources are needed which either governments or insurance companies has to pay (Fillingham, 2007). Statistics produced by StatisticsFinland (2019) shows that health care expenditure grows faster than Finland’s economic growth can withstand. In order to face these problem, hospitals needs to be more productive and use their resources in a better way (Fillingham, 2007). These increasing costs in health care is by Van Den Heuvel, Does, De Koning (2006) described as “just fighting against symptoms of a sick system”. Root causes has to be identified, giving hospitals the possibility for improvements. With improvements, hospitals can get a more competitive stance on the marked. So either invest in improving efficiency and quality of health care or surviving against competitors can be hard (Porter & Lee, 2013). The biggest problem according to Baker, Taylor and Mitchell (2009) is the expanded waiting lines for patients due to the inefficiency of the health care. Other problems related to nurses and not the hospital is the risks when handling different substances. One study published by Cetinkaya, Osman, Ozturk, Kutluk and Erdem (2006) confirmed that 12% of nurses handling antibiotics developed a sensitivity to the substance. This can lead to itching, eye irritation and asthma if one working with these substances over a longer period of time (Walding, 2011). Depending on the physical state of the substance, risks when handling it can vary. Solving medicine in powder form together with liquid is regarded as a critical process compared to handling medicines in other physical states (Segander, 2019).
1.2 Problem formulation
One of the processes in order to make a patient healthy might be to treat them with antibiotics. Breaking down this process of treating a patient with antibiotics gives two sub processes, preparing antibiotics and giving them. Both requires dedicated time from a nurse, costing money for the hospital department. Due to this factor, hospital departments has a limited capacity for treating patient because they only receive a limited amount of money from the government.
The problem can therefore be seen as the time spent preparing antibiotics. If the amount of time nurses spends on preparations can be reduced, more capacity for treating patient will then be released. Another benefit can be nurse’s ability to spend more time with patients, instead of preparing antibiotics.
2. Aim and research question
This research is aiming at improving the processes of preparing antibiotics for patients at the hospital. Research has shown the risks for nurses when handling medicine and growing cost of the healthcare. Improving with the perspective of automation can save time and liberate nurses from preparation risks. Due to the fact that improving is a rather broad description, the
6
aim can be divided into different categories, all relevant for the process of preparing
antibiotics. Since this process in its current state is executed by nurses, the aspect of time is an important one and therefore seen as the fundamental aim of the research. If this were the only aim would probably safety aspects has been jeopardized in the search for reduced process time. So through improvements, safety has to be taken into consideration and safety aspects of the processes has a potential for improvements. The future state will then be derived from all these improvements and validated by the nurses familiar with the current state.
i. How is the current process of preparing antibiotics?
ii. What could be the future process for preparing antibiotics if improved through lean tools?
3. Research method
For the ability to understand how the result will be developed, a well described method is important. It covers the methods and processes used throughout the research as far as possible, the rest is creativity.
3.1 Research context
The research will include two organization for data gathering and the possibility of
brainstorming with individuals having knowledge in the field. These two are described below in order to give readers a better insight in the aids used for creating the result.
Prevas
According to university rules, a company or organization have to be included in the process of writing a master thesis. In this case since the researcher have no experience working with hospitals and health care, a company with expertise in those fields would be beneficial. Prevas, a company with health care experience was contacted and asked if they would have the ability to be a supervisor for this master thesis. The researchers did meet representatives from Prevas at the event working exhibition which Mälardalenshögskola disposed in 2018. They talked about their product developments in health care and how they did work with process development. The choice of company to work with was therefore based on the experience from the working exhibition.
After meeting with a representative from Prevas, a broader picture of the company was gained and the potential knowledge inside the company. The categories of knowledge can be divided into the following:
- Process development in the industry
- Life science
- Product development
- Development of robot system
One employee from Prevas with experience in process development was chosen as the supervisor for this master thesis.. Prevas´ life science department is focused on building systems and products for health care, which leads to a broad knowledge around rules and ISO-standards used in the health care industry. Because of the distance between the office in Eskilstuna and Uppsala, the best way of communication was by email. One trip their office in
7
Västerås and robot lab was planned for the purpose of it was to get to know the whole company and the available knowledge.
Hospital departments
If the processes of mixing antibiotics was ought to be improved, data from hospital
departments had to be gathered. Mälarsjukhuset, a hospital in Eskilstuna giving health care possibilities for 140 000 individuals in the surrounding area was chosen for data gathering. Mixing of antibiotics is not a process occurring on each hospital department and they mixing antibiotics to varying extent. When talking to nurses, five different departments was seen as potential for data collection, they were the following:
Table 1: Hospital departments
Hospital departments
The infection department The surgery department Emergency care department Cardiac care department The intensive care departments
Each department manager was called, presented with the research case and asked if the data needed for the master thesis could be gathered at their department.
Five different hospital departments was called and all said that the best option for data gathering would be the infection department. Both the infection and AVA departments did respond fast when questing about data gathering at their departments. The other three departments was hard to reach, so before even received an final answer about the possibility to collected data at their department the infection department had been chosen for the data collection.
Knowledge gained from reading the papers about the use of lean methods in hospitals environments resulted in the approach to choose one hospital department instead of two or more. It was known from scientific papers that implementation of value-stream-maps in complex environments tends to give a static picture of the current processes which is not accurate (Jones & Womack, 2000).When instead collecting data from a system with little variation the value-stream-map tend to give a perfect picture (Gurumurthy & Kodali, 2011). The choice of method to present gathered data at the hospital was to use a value-stream-map. Since this method already ought to be complex enough when dealing with the variety in mixing antibiotics only one departments was chosen, the infection department.
Reasons behind this decision was drawn from the article written by Surl (2011) which mentions different sampling styles and how the researcher can choose between them. Maximum variation sampling is based upon gathering data to find dimensions of variations and cases. Two essential factors for the sampling method is that it contributes with collecting high quality data and having a detail description of the cases used for the sampling. The second is bringing clarity to shared patterns among the different cases (Surl, 2011). Maximum variation sampling method seemed to suit the research best because high quality data and clear patterns is needed for creating the future state. When talking to the different
departments, each one of the mentioned that the infections department handles most
antibiotics. Since a lot of data had to be collecting from each case to bring the benefits from the chosen sampling method. One department at the hospital was chosen for data sampling and because the infection department handled most antibiotic, they were chosen.
8
Other factors included in the choice of only gathering data from one department was discussed with the supervisor from the university. To give more depth into the required process time, nurses´ working experience and type of antibiotic handled at the data collection should be noted.
In the theory Seth, Seth and Dhariwal (2017) emphasized on making approximations to keep the value-stream-map simple and not use multiply value-stream-maps. Seeing the different processes on the map even if not with perfect accuracy would still make waste reduction possible. Potentially, data could have been collected from different departments and merged together in one value-stream-map, giving an overall approximation. Nurses experience would then probably differ a lot because variety and the numbers of antibiotic bottles. Therefor would it be harder and more inappropriate to discuss and come up with solutions to the approximated value-stream-map with the managers at the different hospitals departments because it should not have represented their own department.
3.2. Research structure and process
The overall research process will be structured in such a way that the three research question building on eachother. One example of this is that the future state will be created from the information gathered with the current state. Because of this, validations from Prevas and the infection department is beneficial for ensuring the quality the work. If not done this way, the future state can potentially be built upon an inaccurate current state.
The proposed research structure is by working in sprints. This is possibly though dividing up the work in the categories: Current state, creating process map, future state and so on. After each category is done, a meeting for validation is planned and received feedback will be used for improvements.
3.3 Project limitations
A clear way of describing limitations that have been set up for the master thesis is to define it as: Everything happens inside the medicine room when preparing antibiotics. This is seen as necessary because it is surely processes concerning preparation of antibiotics taking place outside of the medicine room. Thinking from this perspective gives good limitation for the thesis, but other limitations has to be defined. Inside the medicine room does nurses interact with computer systems which handles information about the medicine and patients. Since this thesis is written from the perspective of innovation, production and logistic would it not bring value to study the form of data in their computer. Thus the limitation is to solely concern for what type of data currently exists and how the future state potentially can use it.
Health care products have in general very strict guidelines because of safety aspects. When these products are developed, different ISO-standards has to be taken into consideration which can be an extensive processes. Since the company included as a supervisor for the thesis has a department called life science with competence among these topics. Further research about ISO-standards which the life science department would not be able to answer will not occur.
3.4 Research approach
When conducting a research project, the research approach will be either deductive, inductive or somewhere in the spectrum between them. The main difference in using deductive or
9
inductive is how a conclusion can be derived from a set of facts. A deductive approach can come to a conclusion through facts and statements which can be set as true, simply when these are true the conclusions are true. The inductive approach does not have a theory from the start of the research. Instead data is gathered and from data analysis, a theory can be proposed. When these two are combined and used together it is called abductive approach. It allows for a theory and from the gathered data potentially change the current theory.
(Saunders, Lewis, & Thornhill, 2015).
The abductive approach seems to be the one most fitting for this research. The research topic was chosen because a possible solution for handlings of antibiotics had already been created. The deductive approach consist of having a theory before the research which is the case for this research. Data gathered from the hospital will most likely indicate improvements which is not a part of the future state theory, therefore does it fit the inductive approach. Because the research clearly fits into both of the approaches, the abductive approach is the best one to use in the research.
3.5 Data collection
Data used for the report can be divided into two categories. First, data used for constructing the method gathered from literature reviews. The second category is the data gathered for the purpose of forming the result.
Quantitative data
Data is set out to be collected at the infection department at Mälardalens sjukhus. The chosed visiting time for data collection is between 0.00pm-2.00pm when they mixed antibiotics. Other potential hours during the day would have been at 6.00am and 8.00pm. Instead of collecting data over the three different opportunities on one day, data collection was done throughout one week between 0.00pm-2.00pm.
Nurses at the department received a short introduction about the research case and why data collection did take place. They were told to perform the mixing of antibiotics in their ordinary way. To capture the processes of mixing antibiotics in an accurate way video recording were chosen to be the best method. When using video recordings for data collection the whole processes can be documented and then later divided up in different processes with the time each one took.
While recording the mixing of antibiotics, nurses and the names of the patients had to be confidential. Therefore, faces of nurses and name tags cannot be recording. Also when nurses read journals on the computer, recordings will be permitted from capturing any computer screen. Since these restrictions did not seemed to cause any difference in output, video recordings was the choice of data capturing. After each recording, mixed antibiotic was written down together with the nurse´s working experience in years..
In order to get opinions of the current state from nurses at the department, a value stream map will be constructed from the gathered video recording was hanged up in their medicine room. This is together with a short introduction about the researcher, research case, why their opinion was important for the thesis and a box where they could put their opinions. Nurses often have a lot of tasks and their work can be stressful, therefore to not only rely on paper introduction the researcher presented itself and the research case for them. Working shifts overlap at the infection department, in this overlap will the concept of value-stream-maps be
10
explained. With the knowledge, each nurse can analyze the map, come up with possible improvements and put them in a box underneath. This method of data collection is seen as the best option because it gives everyone the opportunity to generate ideas. Because of the
stressful shift nurses has, interviews would have been hard to execute. Instead meetings with the department managers who is a nurse was booked in order to understand the current state more in depth.
Literature
When searching for information that should help answering the research question the researcher probably has a good idea about the relevant subjects. Definition of the following six parameters can still be unclear and should therefore be defined (Saunders, Lewis, & Thornhill, 2015). Below has a descriptions on each parameter been written, making the in the processes of conducting the literature review easier.
Language of publication: Which in the researcher is defined as English because of the difficulties to find scientific researches in Swedish.
Subject area: The research questions related to the work of nurses, so the subject area is the profession nurses.
Business sector: The aim of the research is to improve the process of mixing antibiotics, a processes performed at hospitals which is the business sector, health care.
Geographical area: A geographical area does not need to be specified for this research. Lean philosophy is a global concept used all over the world so the sources is not specified by any geographical boundaries.
Publication period: The three main categories of information for the search is lean tools, lean in hospital and lean in complex environment. Since lean tools is a quite old concept, older articles can be used because the foundation of lean is the same. Working environments such as hospitals are under constant change and also complex environments which hospitals can be. The articles about these two latter categories should therefore be quite new so a limit of 15 years will be set. An explanation behind this is that computers certainly where used then in health care. Articles from when much of the used information mediated by paper instead of computer is seen as too old.
Literature type: In the search of lean tools, books can be used as a source because lean consists of non-changing tools, or at least the concepts behind them. Since the environments in which lean can be used is changing, books about lean application can be outdated and scientific articles should be used.
In order to find a structured way of performing the searching process, a relevance tree can be used. This method gives a visual understanding of the different areas related to the research. Relevance trees is structured with headings of the unique areas connected to the research questions and with sub headings underneath, dividing up the areas into sub areas (Saunders, Lewis, & Thornhill, 2015).
11
Figure 1: Relevance tree
The tree is thought to be useful when searching and reading articles because if gives a clear understanding of the different areas covering the research question.
When searching for articles on online databases, achieving full coverage is an important aspect. A commonly mistake is to only use one or two databases for the search of articles, therefore should a range of different databases be used for the search of articles (Saunders, Lewis, & Thornhill, 2015).
Lean philosophy is developed by the automotive manufacturer Toyota, it has a connection to the industry and production areas. From this knowledge, online databases related to
production would seem as a good choice. Health care as an area is also related to the research question, so the online database should have articles from the health care disciplines. Because of the two different disciplines, the choice of database ought to be used in the research
become a more difficult choice. The first searches happened through MDH search engine and through that, the database Taylor and Francis appeared most frequent with relevant articles in the field of lean and health care. Further searches was then done with the database provided by Taylor and Francis, Science Direct and ProQuest. One criteria is that the selected articles has to be peer-reviewed, in order to validate their credibility.
Keyword used for the search of scientific articles are the following ones written in the table below.
Table 2: List of keywords used during the literature review
Keywords
Value stream map Health care Complex variation Product variation Through the collected articles was more articles gathered with the method called backward snowballing. When articles has been gathered, the researcher can go through the reference list of these articles in order to find more relevant articles for the research. The relevance is determined by a set of criteria, which can be language and year (Wohlin, 2019). In this research the parameters defined through Saunders et al. (2015) can be used to review the articles when snowballing together with the relevance tree.
12
Reading literature is an important part of the research and in order to find relevant
information, the researcher has to ask the questions “how does this contribute to the research questions?” Important information for the research questions should be noted out in the text and through this method, connecting the literature with the research questions becomes easier (Saunders, Lewis, & Thornhill, 2015).
For reviewing the literature, adobe acrobat reader was selected as the digital tool because it offers a practical method for highlighting text in different colors. This is important in order to find relevant information for the research question in a faster way when skimming through the literature afterwards. One of the sections in the research is the theoretical framework, which exists of sub-section. An effective method for writing the theoretical framework is through highlighting the different categories of information in the literature with different colors. Then when the writing begins, the researcher can look for information highlighted with the specific color for what should be written about. In this research, the following colors representing these different categories of information.
Table 3: Color coding
Color Category
Yellow Information about value stream maps
Green Lean tools
Blue Implementation of value stream maps
Red Case studies
3.6 Data analysis
Methods used for the data analysis are derived from the lean concepts written in the theory section. Since the research question is based on improvement through lean, explaining them in detail is necessary for ensuring the use of lean methods.
3.6.1 Analysis of video recordings
A value-stream-map was set out to be generated from the data collected through video recordings. It was mentioned by Seth et al. (2017) that inexperienced user would have an easier time leverage the lean philosophy if the value-stream-map was kept simple through the use of approximations instead of different value-stream-maps. Still for analysis of more depth fitted for more experienced users of lean philosophy, each case of mixing antibiotics should be presented alone in comparison with the other cases.
Definition of processes
In order to set the time for each process when mixing antibiotics, different processes has to be defined. Potentially the process of mixing antibiotics can be divided up into a large number of sub processes, for example moving the computer mouse or walking in the medicine room. For the purpose of keeping the value-stream-map simple, human movements will not be
categories as a process. They can instead always be seen as a process within another process. The movement of the arm when navigating the screen with the computer mouse are processes needed for reading patient journals. Movements in the medicine room can be seen as a
processes within the process of gathering materials for the mixing of antibiotics.
13
up into processes. If later one or more of the recordings showed other processes not fitting for the ones defined, it can be added into the collection of processes.
Order of processes
The process of mixing antibiotics consists of a number of sub processes which all have to be completed. Some of them have to be done in a specific order and others not. Therefore the can the order of the processes vary from case to case and complicate the construction of a value-stream-map. For simplicity, the most common order of subprocesses will be used to described as the processes of mixing antibiotics. The ones not following this order will be reordered and divided up into subprocesses, redeployed into the most common order..
Division of processes
Since the definition of processes will be known division of them can be executed in a simple way by going through them one by one, register the time a processes starts and when it ends. Then calculate the total time of each processes and write it down.
Excel documentation
Collected data had to be structured in some form of chart, Microsoft excel seemed to be a suited program for it. Through the use of the program, approximations of each process can be done and also the graph representing each case in comparison to the other cases.
To show the data in a clear way the excel chart will constructed with the top row given the different processes in the determined order. The row at the bottom of the chart will show the average value of the processes above. Columns to the left side of the data will be used for defining case, the right side with the working experience of the nurse and the type of antibiotic used in the case. Also the complete time for all processes will be shown, which includes the total time of the average processtime.
Construction of the graph
The purpose of the graph is to show when the specific case it differs in time compared to the other cases. When a process in the mixing of antibiotics is more time consuming compared to the same process executed in the other cases it will stand out from the rest. This can be achieved from structuring the graph with the total time of mixing antibiotic on the Y-axis and the different processes in the determined order on the X-axis.
Construction of value-strem-map
Data used to construct the value-stream-map will be the ones generated through taking the middle-value of the sum of different cases at the same process. Each process will be displayed in the determined order with the time it takes to execute inside it.
The value-stream-map will be created on a computer with the program Microsoft Visio, which has a template for that purpose. Inside the template different shapes and symbols can be used for explaining the flow of value and the processes taking place. In order to keep the value-stream-map simple for inexperienced practitioners of lean philosophy mentioned by Seth et al. (2017) as little symbols as possible should be used for showing the processes and their time.
14
3.6.2 Root cause analysis
Finding root causes for problems concerning antibiotic handling is an important part of the thesis. A detailed explanation of the root cause analysis seemed therefore necessary in the report.
The visual understanding of the problem
In lean philosophy one concept for process development is gemba walk. The main purpose is getting a deeper understanding of the problem through seeing it with one’s own eyes and not only hear the explanation of it. Video recordings done for the data gathering can serve as a gemba walk in this case. While gemba walk refers to the workflor where value is created described by Liker (2009), the work floor in the medicine room is not in constant operation. Therefore can analysing video recording for the root cause analysis be a more efficient method than an actual gemba walk.
Different categories of waste
A value stream map gives a visualization of the current state of how the processes are arranged and the time each of them takes. Through the value stream map the different processes can be analysed in search for root causes to the total process time. In lean philosophy there exist different categorisations of wastes, which can be seen as processes taking up unnecessary time (Fillingham, 2007).
If a processes has been analyzed through the lens of the different wastes in lean philosophy but still has unclear reasons for unnecessary process time, other categories of waste has to be formulated. This conclusion can be drawn from Miller (2015) who writes that value is defined from the customer perspective, therefore the patients perspective. Since waste is the opposite of value, unnecessary process time not adding value is a waste. When using the lean
categories of wastes in the root cause analysis it is beneficial to add all root causes into categories. Which is explained as one of the steps in executing a root cause analysis by (LeanForum, 1999).
Generalization of root causes connected to processes
Mixing antibiotics is quite similar each time, the difference in process time for each sub processes are expected to be small. Therefore when analyzing one sub processes in the search for root causes, other cases of the same sub process with similar process time will be
generalized to have the same root causes. If the time differs a lot between the same
categorization of root causes, then further investigation of the potential root causes has to be done.
Relationship between experience and process time
Working expericen can have a positive impact on the processes time compared to an inexperienced individual. This statement will be assumed true for the nurses executing the processes necessary for mixing antibiotics. For each case, working experience of the nurse will gathered which gives the opportunity to compare processes time with experience. Generating of root causes
Since the instructions to performing a root cause analysis is constructed from the setting of a group LeanForum (1999) it will be set out to strive for. It can be seen as a form of
15
(1987) mentions says that brainstorming is seen as a popular and effective tool which helps to generate creative solution. The reason for it comes from individual’s different experience which in a team can generate different solutions.
If the value of brainstorming is a result of individual’s different experience, it would be valuable for searching root causes to problems. Therefore should the opinions of nurses be taken into consideration and their opinions will be gathered as described in the data
collection. Knowledge about process development is also seen beneficial for the generating of root causes which can be gained from meetings with employees at Prevas, where
brainstorming sessions can take place.
Assemble the root causes derived by the research and the nurses at the hospital can be done through following the steps described by LeanForum (1999) written in the section theoretical framework under root cause analysis.
Generating solutions for the causes
Root cause analysis done correct should result in generated root causes for each process in the value stream map. The sixth step from the book LeanForum (1999) instructs an examination of which root causes have the highest probability of being the main causes to the problem. The same benefit from brainstorming in generating of root causes can be hold true for this case. Meetings with the manager at the infection department will be booked and also with Prevas and their employee in the field of process development.
Process maps
The main purpose of the root cause analysis is generating solutions to problems associated with each process. In order to explain these solutions in a precise way, process maps seems to be a suitable solutions.
3.7 Validity and Reliability
In order to get an accurate result from the research, the research has to been performed with valid information and methods (Saunders, Lewis, & Thornhill, 2015). It is of important that the literature review is valid because it strengthens the validity of the research (Creswell, 2009). Reliability can be evaluated by comparing the research the other researches in order to find similarities. These can consist of results and statements, which if similar with others increase the likelihood to be reliable (Yin, 2014). Through comparisons of used methods between the research and articles can the results also be more reliable (Creswell, 2009). The aim of the research is to improve the current state of handling antibiotics at the hospital and from that construct a future state. Reliability can be obtained from comparing the findings leading to the future state with the findings in the articles about lean in health care. Another way of confirming this can be through evaluations with the nurses working at the department where the material for the research has been gathered. They can compare the processes in the future state with the current one and evaluate if it theoretical can work. The information showed for the nurse at the hospital is in the visual form of a value stream map and process maps. Meetings with Prevas can help validating the construction of the value stream and process maps since they have the experience in both of these areas.
16
Other important factors for the validity and reliability are scientific articles used in the
research. Peer-reviewed articles is a requirement when searching on the databases and also the date of publication. The date seems to be important since health care constantly evolves and from that comes new ways of applying the lean concept. The foundation on lean is still the same even if the ways of applying it can differ. So books and articles describing lean instead of application of lean can be used without having the publication date as a limit.
3.8 Ethical considerations
According to Vetenskapsrådet (2017), no individual involved in the research should have the possibility to be harmed physically or mentally. This has to be taken into consideration when gathering data from the infection department at the hospital. Usually when nurses mixing antibiotics they are not observed or documented by anyone. Throughout the study, this will not be the case since documentation and observation of nurses has to be done. Being recorded when working can possibly be stressful when errors done by the nurse will be caught on camera. Therefore is it highly important to mediate to the nurse that no faces or name badges will be recorded. Before data gathering, nurses will be told to not feel any pressure and do the mixing of antibiotic as they normally should.
Mentioning that the choice of department was the infection department and that discussion with their manager ought to be held is not seen as an ethical problem. Even if the manager can be identified by mention this, no harmful information will be associated with manager
because the role the manager is confirming information. Mentioning these two is seen necessary for understanding the source of data and information used in the report.
4. Theoretical framework
Using previous knowledge gained from articles related to the subject can help ensuring the quality of the result. The research method is built upon the foundation of lean methods together with articles describing how it can be implemented in health care. This section will cover the relevant theoretical framework for creating and ensuring a good result.
4.1 Risks involving antibiotics
According to Arbetsmiljöverket (2019), antibiotics mixed in an inappropriate way can cause sensitivity for antibiotics among nurses. Signs of overexposure to antibiotics can be itching, welch and eye irritation. When working with these substances over a longer time as nurses do, they can experience anaphylaxis and asthma (Walding, 2011).
Different substances cause different risks for exposure and the ones in liquid form result in a bigger risk. Further risks are when the liquid is fused into a dry ampoule to dissolve the powder inside (Segander, 2019). Hospitals should have clear guidelines about how the substances are handled and they have to make sure that their employees have required competence (Arbetsmiljöverket, 2019).When mixing the substances, hygiene is an important factor for nurses safety and minimizing the risk of contamination. If an infusion of antibiotics should be given, nurses has to use a special mixing assembly to create a closed system. After the patient has been infused with the antibiotic, used material have to be placed in a sealed plastic bag and thrown to a container intended for antibiotics (Värmlandskommuner, 2019). In a study made by Cetinkaya (2006) did they choose 83 nurses without any sensitivity to antibiotics. This was confirmed through a spot-check and when later testing the nurse for sensitivity, it showed that 12% of them had developed a sensitivity to antibiotics.
17 4.2 Philosophy of lean
Optimizing the cost of an industry is what lean philosophy is designed for, it can be done through locating processes that not bring value, thus non-value added activities. It was developed by the Japanese company Toyota and their production system TPS (Toyota production system). The aim was to achieve higher production capacity and a more
competitive stance on the market. Today the lean concept is used in the western countries by manufacturer to achieve the same productive and competitiveness (Liker, 2009).
Non-value added activities can be identified through the classification defined by Toyota and can be applied to any form of work, which makes these lean principles universal (Fillingham, 2007). These non-value adding activities is seen as waste and written in table 3.
Table 4: Wastes defined in lean
Wastes Delay Over processing Inventory
Transportation Motion Over production Defects
4.3 Lean tools
Achieving a production environment that work in a lean operational state has been a goal for western manufactures and therefore have new lean tools been invented. Some of these tools seen as relevant for the thesis is described below.
Value stream map
In 1999 Rother and Shook introduced their concept of value-stream-maps which is a visual tool for eliminating non-value-added activities in a process. When used, it can through its systematic approach locate non-value-added activities and result in rearrangement of shop floors or supply chains (Rother & Shook, 2009). This is through visualizing the material and information moving in the system (Jones & Womack, 2000). Information can be a form of communication between costumer and the supplier (Bhalwankar & Mastud, 2014). The outcome can be seen as a product of the unique features value-stream-maps provide, summarized in six features.
1. Value-stream-maps provides an understanding of each process in the value stream and also how they together effect the whole system. Problem such as bottlenecks, waste and cycle time are identified through the visual method (Seth, Seth, & Dhariwal, 2017).
2. The use of value-stream-maps clarifies the connection between the production
schedule in manufacturing companies and the actual flow of material in the production (Braglia, Carmignani, & Aldo Zammori, 2006).
3. Different companies in different environments can benefit from using value-stream-maps because of the flexibility and adaptability value-stream-value-stream-maps offers. Usage can be seen in manufacturing, service and business organizations (Seth, Seth, & Dhariwal, 2017).
4. When discussing improvements everyone has to have a good understanding of the problem. The use of value-stream-maps enables this understanding (Singh, Singh, Singh, & Singh, 2017).
5. With the use of value-stream-maps, it becomes easier to choose which tools that should be used for analyzing the processes according to the lean concept (Singh, Singh, Singh, & Singh, 2017).
18
6. Tools used to analyze the current state can both be qualitative and quantitative due to how value-stream-map as a method, it is based on objective and scientific data (Serrano, Ochoa, & De Castro, 2008).
One of the reasons why value-stream-map as a method has been so successful for
manufacturers is because the straight forward method. At the same time it does provide a methodology for achieving a lean state in the manufacturing processes. This can be done with the main four steps of a value-stream-map, which are:
i. Selection of product family. ii. Current state mapping. iii. Future state mapping.
iv. Defining a work plan for achieving the future state.
The first step in mapping the value stream is to know what value stream should be mapped. Choosing for example different products can result in a complicated value-stream-map, therefore must the products chosen have similar processes. When products are decided, a map can be drawn and the analyses of it can start, this is the second step of the four. Through the analysis new processes can be formed and visualized with a new value-stream-map defined as the future state map. Implementation of the new process should be done successively and requires a plan, this is the aim of the fourth step (Schmidtke, Heiser, & Hinrichsen, 2014). When creating for the current state map should six different steps be done described figure 2. (Singh, Singh, Singh, & Singh, 2017)
Figure 2: Steps when creating a value stream map
5S in lean
When organizing a workspace everything should have a place which is the idea behind the 5S tool. The term 5S comes from the Japanese language and when translated to English it results in the following words (Zidel, 2006):
19 Figure 3: 5S in lean
Every one of the five word has a meaning for the transformation of a workspace. Objects not needed at the workspace should not be there, so when organizing the workspace everything needed should be given a specific place. The second principle orderliness means that the workspace have to be organized so items are easy to find, use and return. If one item is used more often than another should it be easier to access and placing them according to a labelling system are favorable (Manos, Sattler, & Alukal, 2006). To make the workspace as
comfortable as possible to work in, everything should be cleaned, hence cleanliness. If the staff is going to follow these three principles they must know exactly what to do, everyone has to them in the same way, therefore the work has to be standardize. When the staff knows what to do, they have to sustain it (Zidel, 2006). Compared with the earlier four principles, this one is harder to implement because staff tends to skip steps of different reasons in real work situations (Ballé & Régnier, 2007).
Process maps
With the use of symbols, processes maps can used for visualize the flow of activities or information. The main function of the process map is to help the reader to understand each steps in the process. When developed, delimitations of processes has to be determined. This can in other words be described as where the map should start and end. Processes can be described in different levels of detail, thereby does this level has to be set before constructing the processes map. Analyzing the process map when finished is an important part for
evaluating if the process map describes what it should. Sometimes the map can be simplified but still contribute with the same information (LeanForum, 1999).
Standardized work
One of the aims in lean production is to execute processes in the best possible way. Standardized work is necessary because all the employees should execute processes in an identical way, seen as the best way. Through this method processes can be validated as effective and further improvements can be done (LeanForum, 1999).
20
Poka Yoke
Ensuring that errors and abnormalities not occur, poka yoke can be a beneficial method. The method is used in three different types of scenarios, these are contacts, measurements and execution. Contacts can be shaped and designed so it just fits the specific target which eliminates the risk of errors when using it. Measurements ensures that for example a specific number of movements has been done or that data field has been filled correct. The last
category tells the user if something has been done in the wrong sequence (LeanForum, 1999). With the use of sound and light can the same functionally of eliminating errors be derived (Liker, 2009).
Root cause analysis
Through identifying different inputs the method gives a visual diagram over the different possible causes for a problem. When the inputs are written down the root causes linked to the output can be written down. The main strengths of the root cause analysis is that it collects experience from the team and focuses on causes which can be a good base for further investigations. The process of executing a root cause analysis are the followed (LeanForum, 1999):
1. Choose a problem and make sure that it is well defined, specific and delimited. All team member should be able to understand the problem so they can help solving it later in the process.
2. The second step in the process can be done with the use of stickers. The team
members writes potential cause for the problem, therefore everyone can contribute to solving the problem. The reason for using stickers is to be able to move them around on the diagram because later when no more ideas are generated, the sticker will be moved into different categories.
3. Create the root and cause diagram.
4. Analyze the stickers and determine what kind of categories they can be made into. Some common ones are humans, material, environment and machines but other categories can be chosen in different situations.
5. Place stickers with different causes for problems under each categories and if they fit under more than one problem they are placed under both. Every cause should be placed on the diagram as a branch in the category.
6. Examine which of the causes that is the most probable cause for the problem. This can be done through discussion in the group, see how the causes are connected to
categories and analyzing if any cause are repeated.
7. Look for evidence that selected root causes can be identified in reality through observations and collecting data.
Brainstorming
In a team, members have different experiences that can help to generate a creative solution to a problem. This is why brainstorming is seen as a popular and effective tool (Bottger & Yetton, 1987). Solving problems may be difficult because of established patterns of thinking, when discussing the problem with other team member these patterns can be worked around. At the same time it is a fun activity increases bonding between team members (Baumgartner, 2019).
21 4.4 The applications of lean
Lean philosophy can be used in different environments and is the main reason why it is used for improving the antibiotic handling. In order for succeeding the application of lean,
knowledge about the case it should be applied on and information about similar studies is important. The health care situation and use of lean in it will be presented together with a broader view of lean philosophy in complex environments.
4.4.1 Health care
Two main topics is presented below concerning the current situation of the health care and barriers that prevents improvements.
Current situation
Technologic advancements in health care industries have resulted in new and better
treatments for diseases. Therefore, hospitals have an obligation to take care of more patients than before because they now have the technology to treat them. Due to this reason more resources are needed at the hospitals which cost money that someone has to pay. Either governments or insurance companies has to pay them but there is a limitation of their capacity (Fillingham, 2007). Statistics in Finland shows that health care spending grows faster than Finland´s economic growth can withstand (StatisticsFinland, 2019). In order to face these problem the health care industry needs to be more productive and use their resources in a better way (Fillingham, 2007). These increasing costs of health care systems is by Van Den Heuvel et al. (2006) described as “just fighting against symptoms of a sick system”. Hospitals need to identify the roots to these problems and through that improve itself.
Through improvements the hospitals can get a more competitive stance on the marked. This is now the reality they facing, either invest in improving efficiency and quality of health care or they cannot survive against the competitors (Porter & Lee, 2013). The biggest problem according to Baker, Taylor and Mitchell (2009) is the expanded waiting lines for patients due to inefficiency in the health care.
Seen from a private company perspective, patients are the hospitals customer. Value is defined by patients and every process hospital employees executing must be valuated from the perspective of a patient. Even if health care employees is with patients every day they might not know exactly what is value for their patient, even if they think they know. Sometimes employees becomes used to problems linked to waste that they start to work around them, thus accepting the current situation (Fillingham, 2007).
Creating a value stream map in hospital environments has to be from the perspective of patients. Otherwise will it show a map of where the value is located but it will not be according to the customer, thus the patient (Miller, 2015). Creating a value stream map not only brings clarity about what are value adding and non-value adding processes. It also clarifies different processes in the current state and can be compared with how processes should be done. Because the reality and how things are ought to be done may differ, the reason is simply that employees sometimes forget or just skip steps in the process. When everyone executes the processes in the same way according to guidelines, patient safety improves and future improvements can be implemented (Ballé & Régnier, 2007).
Implementation of lean principles in health care industry has resulted in a concept called Lean healthcare. This concept have been recognized through the available literature to help
22
hospitals achieve better results. Even though value stream maps in hospitals may not always represent all important data that impacts the total treatment time for patients. Things such as processing laboratory exams and medication are often excluded because the patient and related data are the main focus (Rother & Shook, 2009).
Barriers
According to Radnor, Walley, Stephens and Bucci (2006) implementation of lean in health care sector have some barriers to it. People are often skeptic to improvements and no one has the ownership of the current and the future activities. When building team made for
improving health care, members are often the ones wanting to improve and not always the ones that should be on the team to make improvements. Poor communication can result in that a clear message about the improvements never reaches the employees and a lack of resources is also barriers to improving health care.
Staff has to identify waste in the activities they performing, this can be a problem because they want to feel that these activities has a value. A nurse hunting for supplies to patients can be seen as a waste because supplies should always be available. From a nurse´s perspective can that activity be seen as valuable because the medicine will bring value to the patient. Realizing that many of the activities in the everyday work are waste can be difficult. When implementing lean philosophy, employees has to have a clear vision of the right choices and see it from another perspective. Instead of performing the activities classified as waste, their skills and expertise can be used for something more appropriate (Miller, 2015).
4.4.2 Complex environments
In some industries, flow of material and information is simple to follow. processes can successfully be improved to a future state with the use of a value-stream-map (Jones & Womack, 2000). When production plants with complex processes tries to implement value-stream-maps the future state generated from it may perform poorly. This is due to limitations of the value stream maps ability to show complex processes, the value stream map tend to give a static picture of the current state while reality looks different (Jones & Womack, 2000). To solve problems with mapping out flow of material and information in complex production environments a concept called discrete-event simulation has been used and mentioned in (Ingalls & White, 2009). It is a simulation of the value-stream-map and it has already in scientific articles been noticed for the achieved improvements when used (Grimard, Marvel, & Standridge, 2005).
Schmidtke, Heiser and Hinrichsen (2014) emphasizes on trying to keep the value-stream-map simple and not use other tools such as simulations when capturing the current state. Involving other tools in the creation of value-stream-maps can overcomplicate the otherwise
straightforwardness of it (Schmidtke, Heiser, & Hinrichsen, 2014). Even tough, just capture the current state in some cases can be difficult due to the complex environment it is used in. Behind the concept of a value-stream-map lays five principles which are identification of value, value stream, flow, pull and perfection. These five principles are often presented without any guidance and that can be seen as the reason for why application of value-stream-maps in complex environments can be difficult (Seth, Seth, & Dhariwal, 2017).
Researcher with experience in applying value stream maps in complex environments conclude that there is no clarity about what concepts should be applied. With concepts
23
use of value stream maps in complex environments, data collections should be approximated. Another way instead of use approximations is to use multiply value stream maps to visualize the flow. According to researchers using one value stream map is recommended because a lot of the value in using value stream maps can be find in segregation of processes and waste reduction. Therefore would multiply value stream maps not have much advantage and only make things more complicated. Segregation of processes and waste reduction can be still be done. When using one value stream map made from approximations is it easier for
inexperienced practitioner to leverage lean through the map. If practitioners have previous experiences with value stream maps can the complexity can be elevated and multiply value stream maps can be used along with mathematical models (Seth, Seth, & Dhariwal, 2017).
24
5. Result
Three parts is described in the result section for answering the research questions in a structured way. First the Current state explaining how processes of mixing antibiotics does performed today. For creating a future state, analysis and improvements has to be done which creates the second section Improvements through lean. The third section is the Future state, showing through a value stream map how improvements can be implemented.
5.1 Current state
The value stream map of the current state has to be created from the perspective of patients, which Miller (2015) emphasizes on because the value is seen from the costumer, or in this case the patient. Improvements leading to the future state will therefore be based on what brings more value to the patient.
Processes
Through the use of video recordings to capture the value stream when mixing antibiotics the process can be categorized into sub processes, these are the following from 16 recordings.
Figure 4: Current state processes
The processes was confirmed by the department manager to be correct and when asked about any missing processes, no process had been missed. In the processes of going through
recordings, it was noticed that nurses did not always performed the first fourth processes in the same order. When the department manager was asked about the importance of performing them in a specific and she responded that it did not matter.
25
From video recordings was the processes time for each process extracted and inserted into an excel-sheet. This gave the possibility to calculate average process time for each processes among all the recorded cases.
Flow of information
When mixing antibiotics, nurses has to know what type of antibiotic, the dose, how it should be mixed, given and for who they make it to. Information about the patient and required medicine is in the current state found in the process reading the patient journal and the mixing directive, where the doctor has written down the dose of a specific antibiotic.
Nurses also has to remember information needed in different processes. They can be divided into the following categories:
- Information from the doctor: Through the journal showed on the computer, nurses receive information about the antibiotic specified for the patient.
- Information about the antibiotic: In the mixing process nurses has to know directives about how the antibiotic should be mixed. This information can either be received by reading the leaflet in the antibiotic package or from a folder on the wall that the infections departments had set up. This is seen as a faster way of reading directives of the specific antibiotic ought to be mixed. Sometimes though, rare antibiotics are ordered by the doctor which does not exist in the folder. Then the nurses has to read the leaflet found in the package from the antibiotics bottle. - Information about the patient: In order to write a drug prescription, nurses has to
receive information from a doctor through the journal and also from the antibiotic bottle which they have prepared for the patient.
Value stream map
Data needed for creating the value stream map is the mixing processes, average process time on each process and how the information flowed in the value stream. Processes is shown in the specific order of how they are performed. One example of this is that liquid cannot be fused into the antibiotics bottle before the hose has been mounted onto the drip bag. The first four processes can be performed with variation of the order since for example the drip bag can be collected before reading the journal. Even though variation existed, one order of processes was the most common one and used for the value stream map.
Making improvements on the current state is the reasons behind making a value stream map and it is according to Schmidtke et al. (2014) important that the map is not overcomplicated. When analysis the video recordings two different subjects was seen as important factors for the value. Processes that the nurse had to perform and information needed for the processes. In order to bring clarity about the differences between them, two fields was create for
explaining how they interact with each other. These two were the field named medicine room with all the physical processes and the one named administratively with the flow of
information. A complete value stream of mixing antibiotics is described by the value stream map in figure 5.
26
27 5.2 Improvements through the use of lean
With the created value stream map of the current state will lean methods be applied for improvements. This section explains all processes and analyzes which together formed the future state.
5.2.1 Deviation in the value stream
For the purpose of locating non-value adding processes, value stream maps can be a useful tool. Due to the theory section, where Seth (2017) recommended using one value-stream-map with approximations, the current state is described through one value-stream-map created from 16 other current states. The main idea behind using one value-stream-map is that a segregation of process and waste reduction still can be done (Seth, Seth, & Dhariwal, 2017). Even though this was set out to be the method of constructing a current state, variance in time of the different video recordings could not go unnoticed.
In order to benefit from the variance in time of the recordings and not only from
approximations leading to the value-stream-map. A graph was constructed with the Y-axis as the time variable and the X-axis for each of the processes. Thus, each line represent one video recording and the average of all lines is the values used for the current state value-stream-map. Each color represents one video recording case, making it easier to see how the line changes over time.
Graph 1: Total time of each case
When the videos were recorded at the hospital, disturbances happened and was seen by the researcher five times. In a excel-sheet these disturbances was located and the process time on each of them was over one hundred seconds. The rest of the processes never reach that process time even if some of them was close to it. One key difference between these cases was the amount of antibiotic bottles used in the mixing processes. Through all of the cases the amount did vary from one bottle to four bottles which is easily spotted in the graph created from process times. Because of this, disturbances cannot be found from searching the graph for the where process time is high. Instead, situations when the slope of the graph is high should be located, it gives a better indicator of disturbances. The four cases containing the five noticed disturbances are showed in the graph together with the average value of process time among all the cases.
0 100 200 300 400 500 600 700 800 900 1 2 3 4 5 6 7 8 9 10 11 12
28
Graph 2: Total time of disturbance in each case
5.2.2 Analysis of video recordings
The result from analyzing potential causes for the five different situations showed in graph 2 is described in detail below, in table 4, in accordance to disturbances.
Further evaluation of the problems behind the difference in processes time will be executed at the following:
VSM8: At process three. VSM9: At process 10. VSM15: At process one. VSM15: At process three VSM15: The whole line VSM16: At process eight.
Table 5: Description of disturbances in cases
Video recording Description of disturbances
VSM8
Independent on which antibiotic being mixed, nurses has to use a drip bag to fuse antibiotic into. In the medicine room where all antibiotics is mixed, drip bags can be found on a shelf. In this situations did not the nurse find any drip bags so she thought she had to restock them. When another nurse came into the medicine room she told her that the shelf with dripbags was empty. The other nurse then showed her another shelf where she could find more of them.
VSM9
Depending on the dose ordered from the doctor. Nurses in some cases only use one bottle of antibiotic but sometimes they have to use more than one bottle. For example if the doctor describe three grams and the bottles only exist in one or two grams. When using more than one bottle they have a routine to tape them together, so every nurse know
0 100 200 300 400 500 600 700 800 900 1 2 3 4 5 6 7 8 9 10 11 12 VSM8 VSM9 VSM15 VSM16 Average VSM 15 VSM 9 VSM 8 VSM 16 Average
29 which bottles has been used.
The reason for why this process did differ from the other was that the tape could not be found. When the nurse was not able find it, she had to search in the office for a new tape.
VSM15(1)
This case is one that differs most from the rest of the video recordings. It is clear from the graph that something happened at the start of the recording because process one took 4,5 times longer to execute than the average process time.
Most of the patient tend to be ordered similar antibiotics by the doctor. Therefore, the infection department has a storage from which material is picked with the most used antibiotics. In this case it was an
antibiotic type that they did not have in storage. The nurse searched through the storage without finding it until she realized that it was placed on a table beside her.
VSM15(2)
When mixing antibiotics, nurses has to know the directives for the specific antibiotic. Experienced nurses completed the process of reading mixing directives faster because they already know them. In this case, the specific antibiotic needed to be prepared was a quite unusual antibiotic at the infection department. The nurse did not know the directives so she had to look them up. Most of the time when they have to read about directives, they have a binder with directives on the wall. Because it was such unusual antibiotic, the nurse search through it without any findings. Then she had to read a leaflet from the
antibiotic package to know the directives.
VSM15(3)
Even if the line of VSM15 differs from the begging, the difference in the end is bigger than at the begging. A conclusion which can be drawn is that more processes had an effect on the total time. When analyzing the video recording is it clear that the number of antibiotic bottle handled is the reason for the total time. Usually, nurses used one or two bottles of antibiotic in the preparation. In this case the nurse used four bottles of antibiotic which had been ordered by the doctor.
VSM16
In the process of mixing antibiotics, liquid from the drip bag is fused into the antibiotic bottle. Depending on the substance, the easiness of mixing the liquid and powder together can vary.
Tazobactam is a type of antibiotic which is regarded among the nurses as hard one to mix. The powder inside the bottle easily lumps itself with the liquid and requires more time to spread evenly in the mix. This was the reason for the long time it took to complete the process of mixing the antibiotic and liquid together.
Wastes in the processes
With the use of seven different wastes described by Fillingham (2007) and the one formulated from the observation of information flow, the following problems with processes was found. Difference between wastes and disturbances is when they occur in the cases. Disturbances happens undetermined while wastes occur every time the process is performed.