ENERGY FLOW MAPPING OF A
SPORTS FACILITY
Energy flow mapping and suitable key performance indicator formulation for
Rocklunda sports facility
ANTON ESKILSSON
School of Business, Society and Engineering Course: Degree project Energy Engineering Course code: ERA403
Subject: Energy Engineering ECTS Credits: 30
Program: Sustainable Energy Systems
Supervisor: Fredrik Wallin Examiner: Ioanna Aslanidou
Customer/External Supervisor: Björn Sandvall, AB Arvid Svensson
Date: 2017-06-09 E-mail:
ABSTRACT
The aim of this degree project is to show where, when and for what purpose is energy used at Rocklunda Sports facilities. The flows to and within the facility are also examined and key performance indicators are proposed to describe the performance and consumption profile of the system. The main method used was to conduct an energy flow mapping of the facilities. The proposed key performance indicators were based on Monthly and hourly consumption data acquired from Mälarenergi AB and ÅF Konsult AB. By combining the energy flow mapping with the data, key performance indicators were proposed with varying time-span and purpose. The main users of energy were mainly the buildings of ABB Arena Nord and ABB Arena Syd. The cooling need of the facility accounted for 32 % of the electricity used throughout the year. The indicators for heat and electricity varied in usefulness with electricity usage being functionality driven and heat usage being temperature driven. Therefore, the indicators which utilized operational hours were more suited for electricity. The main conclusion of this degree project was that using several simple to compute and decipher indicators are superior to a few complex indicators, it was also concluded that utilizing indicators with different time-span was important for different purposes, with daily indicators being ideal for system diagnostics and monthly or yearly for future renovations and monthly problem identification.
Keywords: Key Performance Indicators, KPI, Energy flow mapping, Sports facility, cooling machine, operating hours, occupancy, energy consumption
PREFACE
This degree project was part of a larger cooperation with AB Arvid Svensson to increase the efficiency of the Rocklunda Sports facilities area. I would like to thank my external supervisor Björn Sandvall at AB Arvid Svensson, for the information provided on the facilities at
Rocklunda and necessary data.
I would also like to thank my supervisor, Dr.Fredrik Wallin and examiner Dr. Ioanna Aslanidou for their continuous support and guidance.
Västerås June 2017 Anton Eskilsson
SUMMARY
The energy consumption of sports facilities is significantly higher than in other facilities for service and recreation. With the differences in consumption profile different types of sports facilities have, it takes massive amounts of work to understand and describe such a facility accurately. With the mayor drive for renovation in such areas being economic, the need for performance describing parameters are crucial to give decision makers enough insight to make correct decisions.
The aim of this degree work is to address this by determining where and when energy is used within Rocklunda sports facilities and for what purpose. The degree work also includes the formulation of key performance indicators to describe different aspects of the systems consumption profile and performance.
The method used is an energy flow mapping which focuses on the flows within the facility in both direction and magnitude and with clear separation between heat and electricity. From this energy flow mapping key performance indicators will be formulated with account of the quality and amount of consumption data is available, other physical data which can be collected is also used in this process including occupancy and metrics of the facility and its’ different buildings and subsystems.
The work will be limited to data from 2016 due to the quality of measurements. Further limitations will be the current equipment for measurements where end-use division will be done when possible.
The results show the clear usefulness of indicators related to different areas, for both heat and electricity. By defining different areas for different processes the performance of the facility can be accurately described. The factors governing the electricity and heat usage of the facility were different resulting in some indicators being useless for heat. Since the electricity usage is dependent on the active processes and heat being mostly dependent on the outside temperature, indicators concerning the operational hours and occupancy becomes useless for heat, but very useful for electricity.
Since some metering points have a lower accuracy then others the accuracy of the results can be questioned, this is most evident for heating demand during the summer where the heat seems to be turned on and off due to an accuracy of hundreds kWh’s. The known errors in measuring points, however is the main source of error, with Solid Park Arena heat usage being negative for more than 2000 hours during 2016 making this meter unusable. The main conclusion of this work was that using several simple to compute and decipher indicators is far superior to the advanced indicators which use several physical parameters. By changing the time-span of an indicator the purpose for that indicator changes drastically. The indicators on a daily basis can be used to diagnose the system and identify problems on either the building or end-use level. Monthly and yearly indicators are more suitable to detect months of high usage or the potential and gain from renovations.
TABLE OF CONTENTS
1 INTRODUCTION ... 12 1.1 Background ...12 1.1.1 Problem Description ...13 1.2 Purpose ...13 1.3 Research Questions ...13 1.4 Delimitations ...14 2 METHODOLOGY ... 142.1 Energy flow mapping ...14
2.2 Literature study ...15
2.3 Formulation of key performance indicators ...15
2.3.1 Load factor and corrected load factor ...16
2.3.2 Operational hour indicator ...16
2.3.3 Area indicator ...16
2.4 Sankey diagrams ...16
2.5 Mean monthly hourly consumption ...17
3 LITERATURE REVIEW ... 17
3.1.1 Description of the facility ...18
3.1.2 Data acquisition ...18
3.1.3 Identifying potential energy efficiency increasing measures ...18
3.2 Measuring energy efficiency ...18
3.4 KPIs for describing building performance ...19
3.4.1 Heating degree days and cooling degree days...20
3.4.2 Building operating hours and occupancy ...21
3.4.3 Area related indicators ...22
3.4.5 Advanced indicators ...24
4 ROCKLUNDA SPORTS FACILITIES ... 26
4.1.2 Heat usage measuring ...27
4.1.3 Electricity usage measuring ...29
5 RESULTS ... 33
5.1 Energy flow mapping ...33
5.1.1 Electricity usage ...34
5.1.2 Heat usage ...37
5.1.2.1. Mean monthly hourly consumption ... 38
5.1.3 Seasonal behavior ...40
5.1.4 Outside Air Temperature influence ...41
5.1.5 Building Wise Consumption ...43
5.2 Indicators ...44
5.2.1 Load factor ...44
5.2.2 Corrected load factor...46
5.2.3 Occupancy and operational hour ...48
5.2.3.1. Specific energy consumption in relation to operational hours ... 49
5.2.3.2. Consumption during operational hours ... 52
5.2.4.1. Yearly indicator ... 55 5.2.4.2. Monthly indicator ... 56 6 DISCUSSION... 59 6.1 Measuring Accuracy ...59 6.2 Measuring Errors ...59 6.3 Energy audit ...60 6.4 Cooling machines ...61 6.5 Load Factor ...61 6.6 Operational hours ...62 6.7 Area indicators ...62 7 CONCLUSIONS ... 63 8 FUTURE WORK ... 65 8.1 Metering ...65
8.3 Heat usage strategy ...65
FIGURE TABLE OF CONTENTS
Figure 1 Rocklunda Sports Facilities Area ... 26
Figure 2 Rocklunda Area main metering points ... 27
Figure 3 Rocklunda Area Heat sub-metering points ... 28
Figure 4 Sub-meters connected to main meter HEL6558 ... 29
Figure 5 Sub-meters connected to main meter HEL6557 ... 30
Figure 6 Main metering Bombardier arena, Rocklunda Ridhus, Rocklunda Gård and Apalby ... 32
Figure 7 Rocklunda Main meter consumption ... 34
Figure 8 Rocklunda main meter nord + south sub-metering ... 35
Figure 9 Rocklunda Area main meter PT435 sub-metering ... 36
Figure 10 Electricity flow sankey diagram ... 36
Figure 11 Rocklunda Heat metering points ... 37
Figure 12 Heat flow sankey diagram... 38
Figure 13 Electricity mean monthly hourly consumption ... 39
Figure 14 Heat mean monthly hourly consumption ... 39
Figure 15 Electricity to cooling machines mean monthly hourly consumption ... 40
Figure 16 Monthly energy usage ... 40
Figure 17 Electricity usage as a function of outside temperature ... 41
Figure 18 Heat usage as a function of outside temperature ... 42
Figure 19 Building consumption share of heat and electricity ... 43
Figure 20 Building energy consumption split for end-use ... 44
Figure 21 Load Factor Electricity ... 45
Figure 22 Load Factor Heat ... 46
Figure 23 Daily load factor ABB Arena Nord ... 46
Figure 24 Mean monthly Hourly consumption ... 48
Figure 25 Yearly specific energy consumption in relation to operational hours ... 49
Figure 26 Monthly specific energy consumption in relation to operational hours ABB Arena Syd ... 50
Figure 27 Monthly specific energy consumption in relation to operational hours ABB Arena Nord ... 50
Figure 28 Monthly specific energy consumption in relation to operational hours Mimerhallen ... 51
Figure 29 Monthly specific energy consumption in relation to operational hours Solid Park Arena ... 51
Figure 30 Monthly specific energy consumption in relation to operational hours Bombardier Arena ... 52
Figure 31 Electricity usage during operational hours ... 52
Figure 32 Heat usage during operational hours ... 53
Figure 33 Electricity usage related to hours SECOHR and SECNOHR ... 54
Figure 34 Heat usage related to hours SECOHR and SECNOHR ... 54
Figure 35 Yearly Specific energy consumption in relation to area building wise ... 56
Figure 36 Monthly Specific energy consumption SECUA,EL ...57
Figure 38 Monthly Specific energy consumption SECNIS,Ncool ... 58
Figure 39 Monthly Specific energy consumption SECIS,ELCool ... 58
TABLES TABLE OF CONTENTS
Table 1 Summary of indicators relevant for the current study ... 25Table 2 Rocklunda Area Main meters ... 27
Table 3 Rocklunda Area Heat Sub-meters ... 28
Table 4 Sub-meters connected to HEL6557 ... 31
Table 5 Metering point for other areas ... 33
Table 6 Heating Degree days 2016 ... 42
Table 7 Load Factor ... 45
Table 8 Corrected load factor Electricity ... 47
Table 9 Corrected load factor Heat ... 47
Table 10 Summary of area indicator on a yearly basis ... 55
Table 11 Proposed yearly indicators... 63
Table 12 Proposed monthly indicators ... 64
NOMENCLATURE
Name Description Unit
SEC Specific energy consumption – an
indicator which is defined as the ratio between energy consumed by a process and a physical activity term.
kWh/physical activity term
C Energy usage – the energy used for
heating or electricity
kWh
A Area m2
LF Load factor – the ratio between the
mean usage of energy during a period divided by the maximum energy usage during an hour of that same period
kWmean/kWpeak
t Time h
T Temperature °C
ABBREVIATIONS
Abbreviations Description
KPI Key performance indicators – Units used to describe
the efficiency of a process or structure, with kWh/m2
being one of the most commonly used.
GHG Greenhouse Gas Emissions – emissions that
contribute to the greenhouse effect, usually recalculated to CO2 equivalents.
EEI Energy Efficiency Index – Most commonly used type
of KPI’s used to describe the efficiency of buildings.
HVAC Heating, ventilation and air conditioning – System
which goal is to provide indoor comfort in the form of heat and air quality.
UA Usable area – the area of a building which is
considered usable space. Not included machine rooms etc.
WS Water surface – the surface area of water used to
indicate performance in swimming facilities.
IS Ice surface – the surface area of ice used to indicate
performance of cooling machines in ice rinks.
HA Heated area – the area of a facility which is heated
through direct heating from a heat pump or other direct heating source.
OH Operational Hours – The number of hour that the
building is operational during a period
HDD Heating Degree Days – The sum of the difference
between a reference temperature and the current daily average temperature for temperatures below the reference.
CDD Cooling Degree Days - The sum of the difference
between the current daily average temperature and a reference temperature for temperatures above the reference.
MMHC Mean Monthly Hourly Consumption – The average
consumption for each hour for a particular month
EL Electricity usage
DH District heating usage/heat usage
1 INTRODUCTION
This study will address the opportunities for energy efficiency measures through analysis of KPI. KPI stands for Key Performance Indicators and are used to describe the performance and characteristics of a system. These KPI’s are obtained through an in-depth energy flow mapping of the entire system that includes both an analysis of the total energy demand of the system and its’ parts and an analysis of the peak demand.
1.1
Background
The biggest challenge of the 21st century is undeniably climate change, with symptoms such
as increasing global temperatures and rising sea levels our planet is in dire need of action.(Intergovernmental Panel on Climate Change, 2014)
The cities have the biggest potential for change, with half of the worlds’ population living in cities and with a contribution of 60 % of the GHG emissions with a staggering 75 % of the world’s primary energy usage.(Gossop, 2011)
As of the recent agreement in Paris the countries involved submitted national climate change action plans. The total contribution of the involved countries are as of yet not enough to keep the average increase in global temperature below the 2°C which is the agreed upon acceptable limit. (Paris Agreement, 2016)
The residential and service sector makes up 40 % of the total energy usage in Sweden, with 90 % of that consumption coming from residential buildings and facilities for service and recreation. Increasing the energy efficiency of buildings is one of the major measures in reducing overall greenhouse gas emissions during a buildings lifespan. (Energimyndigheten, 2015)
The energy consumption in sports facilities are significantly higher than the consumption in other facilities for service and recreation. (Energimyndigheten, 2010a)
Depending on the type of sports facility both the amount of consumed energy and the consumption profile will differ, the consumption for a sports facility often reaches its’ peak demands during the winter. However, the opposite is true for a facility with an ice rink, where the most energy is consumed during the summer months. (Energimyndigheten, 2010a) The total energy consumption is in these cases highly dependent on factors which are difficult to change after the facilities have been constructed. There is much evidence that the total energy consumption for sports facilities can be lowered by as much as 35 % in just a few years. The mayor driving force for increasing energy efficiency is the economic aspects, then
about the economic gain of applying measure of increasing energy efficiency. (Energimyndigheten, 2010a)
In order to give a detailed description of the consumption profile of a system, an energy flow mapping is a useful tool that describe the energy flows from, to and within a system. The study uses consumption data for the system, this type of data usually consists of monthly measurements of heat, electricity and sometimes cooling. The energy considered in these studies are usually purchased energy and can in some cases even be purchased energy on an hourly basis.
From this type of descriptive study “key performance indicators” can be developed to give accurate background information for future energy efficiency measures to be implemented.
1.1.1 Problem Description
With the constant integration of new technologies in a very complex system, it continuously becomes more and more important for decision makers to get better understanding of the system in question. With the simultaneous consumption of heat, cooling and electricity it becomes difficult to pin point the effect a small change in a sub-system has on the
performance and characteristics of the entire system. This degree project will address that issue. The degree project will be conducted for AB Arvid Svensson as a base for their work to make their facilities at Rocklunda more energy efficient and energy independent. This energy flow mapping will be used as a basis for future energy efficiency measures.
1.2
Purpose
The purpose of this degree project is to examine the energy flows within and to the facilities of Rocklunda Fastigheter AB. The investigation will focus on how energy of different kinds flow within the system and its’ different sub-systems, to both magnitude and direction. From this consumption data, the importance of each metering point will be evaluated. This will be used to create several key performance indicators to describe the performance and
consumption profile of the buildings.
1.3
Research Questions
When, where and how is energy used in a sports facility? What kind of energy flows exist within and to the system?
What kind of key performance indicators can be used to accurately describe the performance and consumption profile of a sports facility?
1.4
Delimitations
The geographical scope of this degree project is the properties owned by Rocklunda
Fastigheter AB located in Västerås, Sweden. The detail of this work will be further limited by the existing measuring equipment at the premises, where some areas of the premises have a more in depth documentation of heat and electricity consumption. The data resolution for this work will greatly influence the quality of the results, where only an hourly consumption profile is usable to evaluate peak consumption performance.
The energy consumed from heating the facilities covered in this degree project mainly consist of direct data from the district heating provider but some energy from existing heat pumps within the premises are also included.
Electricity consumption will include electricity for the different cooling machines and heat pumps. Also, the consumption for ventilation and lighting will be stated where such metering is available.
The work will be based on consumption data from the year of 2016 due to the quality of measurements.
2 METHODOLOGY
The main methodology was to conduct an energy flow mapping of the facility to gain intricate knowledge of the flows within and to the facility and to evaluate the current metering
situation. This was coupled with a literature study to understand the process of such a mapping and to understand which key performance indicators are most commonly used and how they are computed.
2.1
Energy flow mapping
The methodology used in this degree project was to first evaluate the consumption data monthly using Microsoft Excel. A basic mapping and general description of each of the main metering points in Rocklunda and internal flows within the area was described using maps containing the different metering points provided by AB Arvid Svensson.
The first step in the mapping was to identify where data was missing from either metering malfunctions or where the time resolution of the data was too low. The years of 2015 and 2016 had a very low amount of missing data and was deemed as a good starting point for analysis.
The consumption data for electricity was obtained from ÅFkonsult, which provided an hourly consumption for each of the main-meters and monthly consumption for sub-meters and
substations. Consumption data for the year of 2015 and 2016 were first examined to identify which of the substations belonged to a certain main-meter and which sub-meter belonged to a certain substation. By inspecting the data in this way one could identify “fictional meters” which are calculated by subtracting all energy measured by sub-meters connected to a substation or main-meter.
The mapping continued by obtaining the consumption data for the district heating side. This was done initially by using data for the main-meters from Mälarenergi, which provided data on an hourly basis and ÅFkonsult, which provided consumption data for both main- and sub-meters but monthly. Like the main-metering points on the electricity side, there was also “fictional meters” on the heating side that had to be identified.
From this the magnitude and direction of each flow could be thoroughly examined including the resolution of each meter. To conduct an analysis on the peak consumption for both electricity and heat a new hourly metering had to obtained for each of the sub-meters. After the initial analysis of the system was complete a literature study was conducted to determine how key performance indicators was used to describe similar systems and varied depending the time-span used.
2.2
Literature study
The literature study was conducted by first, searching in the database “ScienceDirect” for Review articles on the search term: “key performance indicators buildings”. The search area was then widened to include several different areas for key performance indicators. The search area was then further widened to include other peer reviewed articles. From the pool of articles the references for each article was reviewed to find more information linked to the subject. By considering articles which the current article pool was referencing more
information linked to the subject of indicators and energy efficiency was found.
2.3
Formulation of key performance indicators
The process of formulating indicators to describe different aspects of building performance was to use the literature study as a background and review how literature used different types of indicators to describe building performance. The process of formulating an indicator was to first identify the specific problems or characteristics of the system and address those in the form of an indicator. After considering whether the purpose would benefit the final results of the work, the possibility to formulate an accurate indicator with the current amount of data available from the study was considered. If the indicator in question would add to the result of the work it was then added to the list of proposed indicators to be included for further analysis. The time in which this indicator would be considered was also considered. The process of data treatment was performed using MATLAB.
2.3.1 Load factor and corrected load factor
The load factor was deemed a very interesting indicator for both electricity and heat. The corrected load factor was created to evaluate the yearly consumption of heat and electricity, but at the same time include the seasonal variations. The monthly load factor had a similar purpose to the corrected load factor however the user does not need the consumption data from the entire previous year. When the load factor was computed daily the purpose was changed to a diagnostic indicator. The indicators were calculated using MATLAB by finding the mean energy consumption during the period and dividing this by the maximum energy consumption during that same period, with that period being either months or days. Since the load factor is highly correlated with energy efficiency it was deemed useful to include on facility, building and end-use level.
2.3.2 Operational hour indicator
The proposed indicators which include operational hours were chosen due to their inclusion of the number of hours of both operation and idle load. This choice was motivated by the fact that by including the number of hours the relation between idle and operational load could also be examined through these indicators. The difficulties to determine the number of idle and operational hours for individual processes lead to the usage of operational hour indicators being applied building wise. Similarly, the measuring of operational hours daily was deemed impossible with the current equipment for measuring which is why these indicators are considered monthly and yearly. With heating having a high influence from outside temperatures these indicators which are dependent on the provided functions were deemed unsuitable to depict heat usage performance.
2.3.3 Area indicator
The usage of area to describe the performance of both heat and electricity was motivated by the flexibility and the easy calculation. By varying the area to include the heated area for heat usage or the cooled area for the electricity used by the cooling machines, the indicator for heat could depict the performance of a process by only knowing the building metrics and the consumption of the process during the period examined. This lead to the usage of area indicators, yearly, monthly and daily to describe performance for both heat and electricity.
2.4
Sankey diagrams
The usage of Sankey diagrams to illustrate the results of the energy flow mapping was
motivated by the high amount of energy flows. Since a Sankey diagram can illustrate both the share and magnitude of a flow, they were deemed superior to the alternative of a pie- or a bar-chart. However, when showing the yearly variations in energy usage over different months or the influence of temperature, the Sankey diagrams are not usable.
The Sankey diagrams were created using the total energy usage for the year 2016 measured from the various metering point. Heat and cooling flows were approximated and the size of each arrow shows no correlation with actual values and serves only as a visual to show the direction of the flows. The software used to create the Sankey diagrams in Figure 7, Figure 8, Figure 9 and Figure 11 were an online tool called Sankeymatic which lets the user create simple Sankey diagrams (“SankeyMATIC (BETA): Build a diagram,” n.d.). For the more advanced Sankey diagrams in Figure 10 and Figure 12 a software called eSankey was used. This software lets the user draw a Sankey diagram while using a picture as a background.
2.5
Mean monthly hourly consumption
The mean monthly hourly consumption was created by taking the mean usage for each hour during a month, this was used to illustrate the difference between operational and idle hours, as well as the difference in energy usage between seasons.
3 LITERATURE REVIEW
The literature review will first consider the process of an energy flow mapping followed by different studies where the formulation and application of KPIs have been included.
3.1
Energy Audit
The purpose of an energy audit is to gain insight into where energy is used
(Energimyndigheten, 2010b). The energy usage is then divided for different processes and systems. The energy audit process can be divided into 5 main tasks which includes
(Energimyndigheten, 2004).
Description of the facility, which facility is under audit and which types of systems does this include.
The facility’s current energy usage which is mapped by answering the following questions: for the current year: how much energy has been used? Where has it been used? and for what purpose?
The energy usage on during the next few upcoming years. The long-term energy usage. (>10 years)
The final task is to identify the potential of conducting measures to increase energy efficiency or lowering overall energy usage.
3.1.1 Description of the facility
The description of the facility is done to show which facility is under audit and which subsystems this facility has (Energimyndigheten, 2004). During this process, the type and direction of the flows of the facility is thoroughly described. The flows can include products or material, or different types of energy or media. This process also includes parameters such as the schedules of employees and activities of the facilities and the specifics of the HVAC system and the heating systems (Escrivá-Escrivá et al., 2011).
3.1.2 Data acquisition
In order to establish an overall picture of the consumption data for the facility the hourly consumption data must be obtained for the total electricity consumption of the facility and the electricity consumption of the HVAC system (Escrivá-Escrivá et al., 2011). The quality and the detail of the data acquired will greatly affect the quality and the representability of the results.
3.1.3 Identifying potential energy efficiency increasing measures
According to Energimyndigheten, identifying potential energy efficiency increasing measures is the most troublesome step, in many cases the processes which requires the most amount of energy are not the processes where the most energy can be saved (Energimyndigheten, 2010b). Furthermore, the measures which are related to behavior and routines are overlooked. The usage of energy during hours where the facility is not operational is an important part in keeping a facility energy efficient. Since this kind of idle energy usage does not hold any value for the company and needs to be kept at a minimum, this can be done by analyzing hourly consumption values of electricity and heat to identify the idle consumption of the facility. One solution is to shut off all unnecessary equipment during such hours and monitor the change in idle consumption. Energimyndigheten estimates in a report from 2009 that the energy usage of the average ice rink in Sweden can be halved, this is partly due to the reference ice rink being optimized with an energy efficient cooling compressor and optimized system temperatures.
3.2
Measuring energy efficiency
According to Patterson, Energy efficiency is an important measure when defining the efficiency of a process. Since the term of “energy efficiency” can be used to describe different types of processes that cannot be compared quantitively, indicators are used as a way to indicate efficiency. The energy efficiency of a process is in many cases determined by
considering the energy consumption of the process and relating it to some physical property, a commonly used indicator is to relate the energy consumption to an area or a volume (González et al., 2011). Therefore, the term of “Key performance indicators” or KPI was
developed, this type of indicators gives a broader understanding of performance in comparison to the traditional way to describe energy efficiency as:
input
Energy
energy
Useful
(1) The problem when considering this thermodynamic way to describe efficiency comes when in many cases the useful energy is to be decided. In many processes this is difficult to
define.(Patterson, 1996)
3.3
Key performance indicators
Key performance indicators are useful tools for measuring the performance of a system. The indicators function as a way to easily compare the system performance to its’ expected value. There are various different areas of application for KPIs but their main usefulness is to give an insight for customers, users or decision makers to compare performance of time-periods for comparable systems. (“Key Performance Indicators,” 2010)
With the usefulness of KPIs for measuring the performance of a system, little attention has been directed into creating a universal system for comparison and measuring of building performance(Patterson, 1996). As of today, there are few systems for comparing efficiency and there is no clear code of conduct when it comes to formulating such indicators. The usage of KPIs to indicate the room for energy efficiency measures is very important. There are also several types of indicators to determine the performance of a certain energy efficiency measure. These indicators are similar to those used in economics to describe the financial gain of a renovation or an improvement of sorts. They deal mainly with amount of saved energy during a period of time or the amount of prevented GHG emissions. Similar to the payback time used in economics the concept of an energy payback time or emission payback time can be used to show the time needed for a retrofit action to save as much primary energy as which is consumed during the life cycle of each of the components used in the retrofit. (Ardente et al., 2011)
3.4
KPIs for describing building performance
In an article by Kylili et al., 2015, key performance indicators are divided into several categories depending on how they are used to describe different aspects of performance. These categories are of varying significance depending on the area of application. However, the most important KPIs for describing a building can be Environmental, Social and Economic. The environmental category includes KPIs for energy, emissions and resource usage, just to mention a few. Since different types of systems are used to fulfil different tasks, the chosen indicator needs to be considered to prevent unfair comparison, this could also be the case when comparing different types of buildings as some buildings might differ
significantly from one another (Abu Bakar et al., 2015). It is also very important when looking at the KPI’s for a building that one differentiates between the usage of electricity and heat in order to be able to evaluate the performance on an accurate level, also the
differentiation of electricity and heat helps with increasing the understanding of the performance of electricity and heat separately (C.A. Balaras et al., 2015).
A common way to describe the efficiency of a building is to utilize what is called an Energy Efficiency Index (EEI) this indicator is also referred to as Specific Energy Consumption (SEC) in many articles, this type of KPI is used to describe the ratio between the energy
consumption in kWh related to some sort of factor (Abu Bakar et al., 2015). There are several different factors that are of varying importance depending on the area of application. This type of KPI is the most common way to describe the overall consumption on a daily, monthly or yearly basis. It does not however, give any insight into the peak load profile of a system (Steinfeld et al., 2011). To get an accurate description of how the consumption of heat or electricity looks on an hourly basis the variations in peak load of the system must be known.
3.4.1 Heating degree days and cooling degree days
Since building energy usage is highly dependent on outside temperature, an indicator that handles the energy consumption of heat and electricity respectively in relation to the deviation from a certain reference temperature is a commonly used indicator (Escrivá-Escrivá et al., 2011). This can be interesting when comparing the consumption between different years or the influence of seasonal behavior. A common way to describe these variances in temperature between years is to use the concept of heating degree days (Ma et al., 2017). The number of heating degree days (HDD) is calculated by using a reference temperature and adding the difference between the outside temperature and the reference temperature for days where the outside temperature is lower than the reference.
C
days
T
C
T
C
T
T
C
HDD
o ref i o ref
,
365 1 (2)The corrected heating consumption is then calculated by dividing the standard annual heating degree days with the calculated value and multiplying with the measured heating usage (Ma et al., 2017).
C
days
C
kWh
HDD
days
C
HDD
C
S measured corr Heat
, (3)The same process for determining the number of heating degree can be used to determine cooling degree days (Jing et al., 2017). The cooling degree day (CDD) is used in the same way as HDD, the average daily temperature is related to a reference which often reflects the temperature which gives the best indoor climate. Unlike the HDD the CDD does not reflect all types of cooling, only those types connected to the indoor climate of a building. For example, if the CDD were to be calculated for and ice rink, the base temperature has to be set differently but the same main principles apply.
Similarly, to HDD and CDD, Escrivá-Escrivá et al., considers in an article the temperatures effect on building consumption by introducing a parameter that normalizes the energy consumption for each month.
10
22
10
T
T
K
T (4)The temperature considered is the outside temperature (Escrivá-Escrivá et al., 2011). The idea behind this parameter is that during months with low consumption it will be near 1 and during months with unusually high or low temperatures the parameter will take a value lower than 1. The parameter is to be used in conjunction with the monthly energy consumption to identify certain months where the consumption is not correlated with the outside
temperature.
3.4.2 Building operating hours and occupancy
The consumption of offices and public buildings tend to vary greatly during the active and inactive hours, therefore some studies have decided to include this in their analysis with corresponding indicators (Sekki et al., 2015). Sekki et al., has described such indicators that concern the hours of occupancy, where the energy consumption during a period is related to the hours of occupancy during the same time. Such an indicator is described as:
h
t
kWh
C
SEC
O OH
(5)The period of time for this indicator can be varied to account for seasonal differences in both consumption and operation hours, but also heating and electricity usage can be handled separately (Sekki et al., 2015). Often when considering an indicator that is dependent on the operational hours of a building it is beneficial to include an indicator that shows the
consumption during hours of low energy usage. Such an indicator will describe the baseload of a system and any deviation from this expected value. The importance of such an indicator is enforced by Masoso and Grobler who concludes that the importance of occupancy behavior influences the consumption during low load hours, this is mainly due to the failure to turn off unused equipment, such as computers and lighting, their study concluded that more than 50% of the energy used in the buildings they studied was due unnecessary waste from the behavior of occupants.
In an article by Sekki et al., the indicator of kWh/occupant is used in several different variations. The main findings of the article concluded that even though there is a known connection between occupancy and energy consumption patterns, their study showed that this connection was not as strong as previously expected. Therefore, one could argue the importance of occupancy driven KPI’s in public facilities. When considering occupancy, the next step of assessment becomes the operating hours of a building and considering factors related to these (Ioannidis et al., 2016). The ratio between the energy use during the active hours and the hours with low activity can be used to indicate the overconsumption of energy
related to the maintenance consumption. According to Ioannidis et al., the operational performance of a building can be described by what they call the “building operational performance” KPI which is calculated as:
Ems h t m A kWh C kWh C kWh C BOPerf O HVAC Lig Eq 2 (6)Where tO indicates the hours of operation and the Ems is an emission factor (Ioannidis et al.,
2016). Another way to indicate the performance in relation to the operational hours is the simply divide the energy usage by the operational hours of the facility(Mårten Berdenius and Ingvi Aron Thorkelsson, 2015). When it comes to these kinds of facilities the use of area to indicate the performance was misleading and the hours of operation were a more suitable indicator.
3.4.3 Area related indicators
The use of area related indicators such as kWh/total area in m2 are an effective tool for
illustrating a buildings performance. According to E.H. Borgstein et al., 2016, the use of these types of indicators carries some risk when it comes to the performance of an entire building. When it comes to systems integrated into the building itself, such as HVAC systems - the performance of such a system is best shown when calculated and displayed on its’ own. It is therefore often worthwhile to make a separation when conducting energy audits or energy flow mappings to show the performance of individual parts of a large system. This indicator is commonly referred to as the specific energy consumption or SEC and is defined as:
m
2A
kWh
C
SEC
(7)There are several different variants of area indicators for building energy performance, depending on the type of facility described in a study - the indicators for describing the performance can vary. When describing a commercial facility, the indicator kWh/m2UA can be
useful, where UA denotes the usable area (Kampel et al., 2016). For specialized facilities such as ice rinks or swimming facilities the area of ice and water respectively can be interesting when describing the electricity or heat used for cooling or heating. Thus, an indicator where the ice area (IS) or water area (WS) is applicable.
m
2A
kWh
C
SEC
WS WS
(8)
2 , m A kWh C SEC IS Cool Cool IS (9)Another useful way to describe a system is to consider the indicator kWh/m2HA (Heated area),
depending on the type of facility described (Magrini et al., 2016). This indicator only considers the area which is supplied by direct heating and not waste heat. According to González et al., the use of indicators like SEC which consider metrics are not efficient for comparison between different types of buildings or between buildings in different countries due to their varying economic structure and differences in climate. To accurately compare buildings with differing conditions the consumption needs to be related to a reference.
kWh
C
kWh
C
SEC
SEC
f f Re Re
(10)By predetermining a reference building for a particular type of building, a system for energy certification can be defined to simplify the comparison of buildings of a certain type
(González et al., 2011). In a study by Jing et.al., 2017, the usage of area related indicators gave results that varied greatly depending on the type of building considered and what types of services the building provided, they concluded similarly to González et al., that due to this reason, the breakdown of each building into smaller parts divided by its’ end-use systems are a more efficient way of assessing the overall performance and gives a more accurate image. This notion of end-use division is further reinforced by Mårten Berdenius and Ingvi Aron Thorkelsson which claims that the comparison between sports facilities and other facilities gives are misleading when comparing the energy related to area or heated area. This is partly due to the significantly higher ceilings that the sports facilities tend to have which gives an uneven distribution of indoor temperature.
If the complete metrics of a building is known and of interest to the study the indicators can be expanded to include the volume of the building instead of the area. These indicators however, typically provide the same information as the area based indicators and are mostly important for buildings with a very high ceiling or height differences in the ceiling. These types of indicators are influenced by the buildings shape factor which can be expressed as the ratio between the surface area and heated volume. (Magrini et al., 2016)
3.4.4 Peak load related indicators
In a study by Steinfeld et.al., 2011, that reviewed the peak load characteristics of office buildings concluded that the most energy efficient buildings have reduced peak loads. Therefore, such an indicator could be used to accurately describe how energy efficient a building is. To describe this type of correlation the load factor can be used (Personal et al., 2014). The load factor is the ratio between the average load during a certain period and the peak load during the same period. This could be described in hours, months or years depending on the usage.
kWh
C kWh C LF peak mean (11)The load factor is a dimensionless indicator with a value that ranges between 0 and 1, the closer the value is to 1 the better (Personal et al., 2014).
3.4.5 Advanced indicators
When considering operating hours for a particular type of building it is usually not enough to only consider the hours of operation. To make a comparison between two buildings of the same type, the metrics for those buildings need to be considered. By using an indicator that considers the energy usage when the building is in operation, information about energy usage compared to other buildings and about deviations from the normal energy usage can be obtained. The same indicator can be made for when the building is not being used, if the value of this indicator is high it means that energy usage is unnecessarily high during hours of non-operation. (Escrivá-Escrivá et al., 2011)
h
A
m
2t
kWh
C
SEC
O OHC
(12)
h A
m2 t kWh C SEC NO NOHC (13)By combining an indicator that describes the number of occupants with an indicator for operational hours, the energy usage during a certain period related to the occupancy and operational hours can be described. This is calculated by taking the consumption when the building is in operation and dividing it by the average number of occupants and summing that for each day, the sum is then divided by the number of hours when the building is operational. (Escrivá-Escrivá et al., 2011)
h t Occ O kWh C SEC O D i i i OHOC O
1 (14)This type of indicator gives insight into how much energy is used in comparison to the
number of occupants during operational hours, other than being useful for comparing similar buildings it gives information of possible overconsumption when the energy usage is high and the number of occupants are low. (Escrivá-Escrivá et al., 2011)
Table 1 Summary of indicators relevant for the current study
Name Unit Input Purpose Pros Cons
SEC
kWh m2
m2 A kWh C - Used to indicate overall building energy consumption - Benchmarking - Easy to calculate - Good for comparison and benchmarking - Can be modified for components and sub-systems - Misleading when considering complex buildings LF -
kWh
C
kWh
C
peak mean- Used to indicate the variations in load - High correlation between load factor and energy efficiency - Requires hourly measurements OH SEC
kWh
h
h t kWh C O - Identifies hours of high consumption during operational hours -Good for comparison and benchmarking - Does not account for energy used during these hours NOH SECkWh
h
h t kWh C NO - Identifies hours of high consumption during non-operational hours -Good for comparison and benchmarking - Does not account for energy used during these hours OHC SEC kWh h, m2
h A
m2 t kWh C O - Problem identification from deviations - Gives a more realistic picture than SEC - Can be difficult to compute due to variance of schedules NOHC SEC kWh h,m2
h A
m2 t kWh C NO - Identifies hours of high consumption during non-operational hours - Identifies the waste of energy - Identifies easy to implement actions - Can be difficult to compute due to variance of schedules OHOC SECkWh
Occ
,
h
h t Occ O kWh C O D i i i O
1 -Identifies high consumption during
hours of low occupation
- Also considers the number of occupants - Requires tracking of occupants
4 ROCKLUNDA SPORTS FACILITIES
The Rocklunda area is a large property owned by “Rocklunda Fastigheter AB”. The property is located in Västerås, Sweden and consists of several different facilities for sports and recreation. All the main metering for electricity start with “HEL” followed by their individual number, the main meters for heat start with “FJV” and the sub-meters for both electricity and heat start with an “U” before their respective designation. The pictures used depicting Rocklunda Sports facilities were obtained from Björn Sandvall at AB Arvid Svensson with Figure 1 being the original (Björn Sandvall, 2016).
Figure 1 Rocklunda Sports Facilities Area
The area consists of several different facilities with varying detail of measuring. The area has been divided into 5 geographical zones to simplify the measuring process.
4.1
Rocklunda Area
The “Rocklunda Area” is includes all of the ice rinks in the Rocklunda sports facility and is the only area with sub-metering. This area has electricity and heat usage from the electricity grid and district heating grid, but also simultaneously produce some heat through a heat pump and cooling from several cooling machines located throughout this area. These cooling machines provide cooling for the ice rinks.
Figure 2 Rocklunda Area main metering points
4.1.1 Main metering
This includes 5 main meters for electricity and one for heat received from the district heating network. The meter for district heating: “FJV2361” makes up for all the heat consumption of this area. There is also a more in-depth level of metering which includes several sub-metering points for both heat and electricity. As shown in Figure 2 the meters “HEL6565” and
HEL6564 are placed to the side of the map. “HEL6564” is used to measure the electricity consumption of a pumping station outside of the map and “HEL6565” is used to measure electricity usage of a gravel field shown on Figure 1 as a parking lot.
Table 2 Rocklunda Area Main meters
Area Name Designation
Rocklunda Area
Rocklunda Nord + Syd HEL6557
Rocklunda, Pt 435 HEL6558
Pumpingstation Vallbybron HEL6564
Rocklunda Gravel Field HEL6565
Rocklunda Area FJV2361
4.1.2 Heat usage measuring
The “Rocklunda Area” has 13 active sub-meters for measuring the heat consumption and one “fictional meter” which is calculated by subtracting 12 of those sub-meters from the main-meter “FJV2361” this fictional main-meter is used to measure the usage of heat for the building of
Solid Park Arena. Solid Park Arena is an artificial turf football field that has both heating from the district heating network and residual heat from heat pump.
Figure 3 Rocklunda Area Heat sub-metering points
The area also includes a heat pump which is used to heat mainly the Bandy Arena ABB Arena Syd with some heat being used to keep the grass on the Solid Park Arena ice free, the residual heat of this heat pump is then used to heat the gym: “Friskis & Svettis”. The heat produced by the heat pump is measured on “UFJV658” and is not used when calculating the district heat usage for the building of Solid Park Arena.
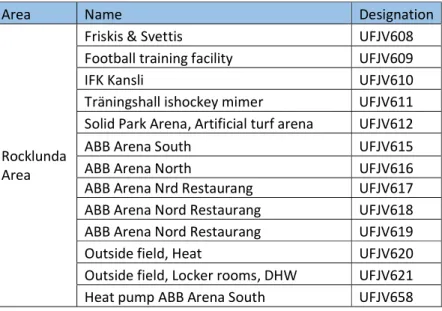
Table 3 Rocklunda Area Heat Sub-meters
Area Name Designation
Rocklunda Area
Friskis & Svettis UFJV608
Football training facility UFJV609
IFK Kansli UFJV610
Träningshall ishockey mimer UFJV611
Solid Park Arena, Artificial turf arena UFJV612
ABB Arena South UFJV615
ABB Arena North UFJV616
ABB Arena Nrd Restaurang UFJV617
ABB Arena Nord Restaurang UFJV618
ABB Arena Nord Restaurang UFJV619
Outside field, Heat UFJV620
Outside field, Locker rooms, DHW UFJV621
4.1.3 Electricity usage measuring
On the electricity side the meters “HEL6564” and “HEL6565” are smaller meters not connected to any sub-metering. The other two meters shown in Figure 2 Rocklunda Area main metering points include several points for sub-metering. “HEL6558” is a substation that includes 5 sub-meters and a fictional meter that is calculated by subtracting the electricity usage of each of the sub-meters from the main-meter “HEL6558”. This fictional meter is used to calculate the electricity consumption of the building for Solid Park Arena.
Figure 4 Sub-meters connected to main meter HEL6558
The main meter “HEL6558” is also called substation PT435. For “HEL6557” there are three substations that add up to the total consumption of the meter. For each of these substations there are several sub-meters that are used to calculate a fictional meter for each substation.
Figure 5 Sub-meters connected to main meter HEL6557
As shown in Figure 5 there are three sub-meters that are used to measure substations; UEL1058, UEL1066 and UEL1067.
The fictional meter connected to the substation PT95 is the electricity usage for the building of ABB Arena Nord and is calculated by subtracting all the sub-meters connected to that substation shown in Table 4. The building ABB Arena Nord also includes a restaurant and several events are held which influences the consumption of the building. For PT37 the fictional meter is the electricity usage for the cooling machines that run the outside ice rinks, “Hakonplan” and “Månskensrinken”. Hakonplan is a bandy field and is cooled for large parts of the year, Månskensrinken however is covered with a roof and three walls leaving the side facing Mimer Ice hockey training facility exposed to the outside. The fictional meter for substation PT304 is the electricity usage for the cooling machines for ABB Arena Nord and Mimer Ice hockey training facility. In contrary to ABB Arena Nord, Mimer Ice hockey training facility does not host any events with crowds making the conditions different.
Table 4 Sub-meters connected to HEL6557
Area Name Designation Substation Main meter
Rocklunda Area
Restaurant ABB Arena Nord UEL1059 PT95 HEL6557
Outside field (Hakon) UEL1060 PT95 HEL6557
Cooling Machine VKA21 UEL1061 PT95 HEL6557
Cooling Machine VKA22 UEL1062 PT95 HEL6557
Cooling Machine VKA23 UEL1063 PT95 HEL6557
ABB Arena Syd, Building,
ventilation,lighting UEL1064 PT95 HEL6557
ABB Arena Syd UEL1065 PT95 HEL6557
Electricity to heat pump ABB
Arena Syd UEL1096 PT95 HEL6557
Outside Ice rink
(Månskensrinken) UEL1054 PT37 HEL6557
Event parking UEL1055 PT37 HEL6557
Ice hockey training facility
(Mimerhallen) UEL1056 PT304 HEL6557
The instances of Månskensrinken and Mimerhallen in Table 4 refers to the electricity consumption related to lighting etc. cooling is only included in the fictional meter for substation PT37
4.2
Other Areas
Figure 6 Main metering Bombardier arena, Rocklunda Ridhus, Rocklunda Gård and Apalby
As Figure 6 shows there are one main meter for electricity and heating for both Bombardier Arena and Rocklunda Ridhus (HEL6562 has been discontinued) however the electricity usage for Rocklunda Gård has been split into three meters for electricity, one for each of the tenants. Bombardier Arena is sports facility used for several different indoor sports with events of different kinds taking place. Rocklunda Ridhus includes a stable and an indoor horse riding facility. Apalby includes three main meters for electricity and one for heat.
Table 5 Metering point for other areas
Area Name Designation
Rocklunda Ridhus
New Horse riding house HEL7238 Old Horse riding house HEL6562 Horse riding house FJV2360
Rocklunda Gård Rocklunda Gård HEL6559 Rocklunda Gård HEL6560 Rocklunda Gård HEL6561 Rocklunda Gård FJV2359 Bombardier Arena
Bombardier Arena HEL6563
Bombardier Arena FJV2362
Apalby
Apalby Gård OBJ 207 HEL6551 Idrottsplats OBJ 207 HEL6552 Apalby Gård OBJ 200 HEL6554
Apalby IP FJV2358
In Table 5 the metering point of heat and electricity is presented. As shown no in-depth metering of end-use is available.
5 RESULTS
In this section, the results of the energy flow mapping are presented first followed by the formulated indicators for the facility. The results are from measured data during the year 2016.
5.1
Energy flow mapping
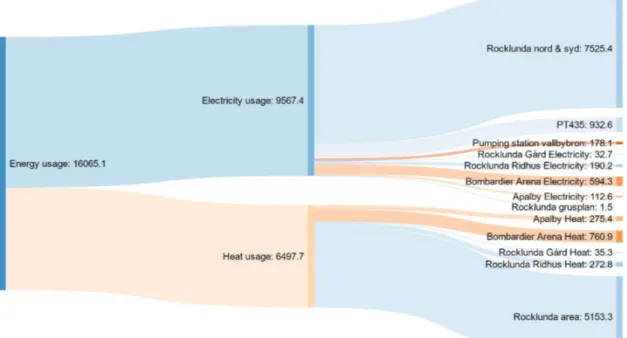
Here, the results of the energy flow mapping are presented. First the yearly consumption of each meter for both heating and electricity are displayed followed by the hourly values and the influence of temperature and seasonal variance of the facility. The results of the energy flow mapping clearly display that the majority of the energy is used in the geographical area known as Rocklunda Area as shown in Figure 2. All Sankey diagrams shown in section 5.1 are displayed in the unit MWh.
Figure 7 Rocklunda Main meter consumption
Figure 7 illustrates the energy usage during the year 2016 for all main metering point separated for electricity and heat. As shown in Figure 7, the main usage of electricity is measured by the meter Rocklunda nord & syd designated as HEL6557 in Figure 2. The heat usage is dominated by the meter Rocklunda Area which is shown as FJV2361 in Figure 2. The energy usage of Rocklunda Area consists of the main meters shown in Table 2 and account for around 90% of the electricity and 79% of the heat usage.
5.1.1 Electricity usage
The electricity usage is mainly located to main meter Rocklunda nord & syd, the electricity usage of this meter is measured by three sub-meters which measure the electricity usage of three substations shown in Figure 8. The total electricity usage of the facility during 2016 was 9567,4 MWh.
Figure 8 Rocklunda main meter nord + south sub-metering
Figure 8 shows the sub-metering point that are connected to the main meter HEL6557, the three substations which makes up the meter and their connected sub-meters are included, the fictional meters for the substations are: ABB Arena Nord for PT95, Cooling machines outside field for PT37 and Cooling machines ABB Arena Nord and Mimerhallen for PT304. The electricity usage of the buildings in this area make up for the majority of the electricity usage of the entire facility as Figure 8 shows the building ABB Arena Nord is the biggest consumer of electricity even when excluding the restaurant located in the building. The electricity to power the cooling machines for the different ice rinks accounted for 32% of the total electricity. Figure 8 also includes the metering of the electricity used for the heat pump, this post is not included for heat since only the purchased energy for the facility is
Figure 9 Rocklunda Area main meter PT435 sub-metering
The sub-metering for PT435 is connected to smaller buildings which does not have individual measuring of different end-users. In comparison to Rocklunda Nord & Syd, PT435 measure a small amount of the total electricity usage as Figure 9 clearly show. The sub-metering for this meter however includes the building of Solid Park Arena which is the 3rd biggest user of
electricity according to Figure 19.
Figure 10 Electricity flow sankey diagram
By consulting Figure 10 it is clear that the majority of the electricity used by the entire facility is concentrated to the four buildings: ABB Arena Syd, ABB Arena Nord, Solid Park Arena,
Mimerhallen and Bombardier Arena. Figure 10 shows electricity flows as yellow, heat flows as red and cooling flows as blue. It is also worth noting that the magnitude of the cooling flows is unknown due to the lack of metering, the same goes for heat since the amount of energy used by Solid Park Arena and Friskis & Svettis are unknown.
5.1.2 Heat usage
The total heat usage for Rocklunda Sports Facilities during 2016 was 6497,7 MWh with most of that usage measured by the Rocklunda Area main meter which is shown as FJV2361 in Figure 2, by itself this meter measures 79 % of the facilities heat usage. This meter is the only main meter for heat where further sub-metering is available.
Figure 11 Rocklunda Heat metering points
The heat usage during the year 2016 is shown in Figure 11. As for electricity, ABB Arena Syd, ABB Arena Nord, Solid Park Arena, Mimerhallen and Bombardier Arena are among the top user of energy, the building of ABB Arena Syd only uses 572 MWh of purchased heat, however, the building used an additional 1082 MWh of heat produced by the heat pump.
Figure 12 Heat flow sankey diagram
The heat usage during the year 2016, which is illustrated in Figure 12, shows the flow of heat to and within the facility. ABB Arena Nord is the main user of purchased heat with 39 % of the total heat used (restaurant included). The second biggest user of purchased heat is Solid Park Arena which used 15 % of the total heat, with an unknown amount used to keep the turf ice free.
5.1.2.1. Mean monthly hourly consumption
In this section, the mean energy usage for each hour during a month for the entire year is shown. The results are shown for purchased heat, electricity and electricity to cooling machines.
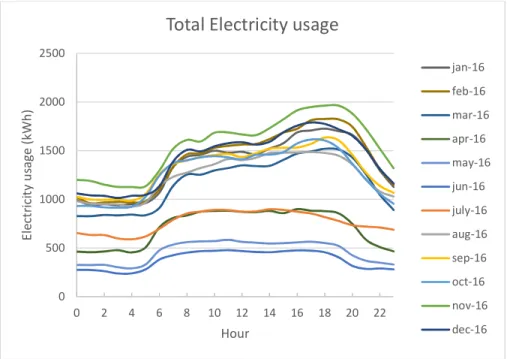
Figure 13 Electricity mean monthly hourly consumption
The mean electricity used has its’ maximum value during November and the minimum during June. As Figure 13 illustrates the mean consumption for every month has similar trends, with the maximum during each day at approximately 7 o’clock in the evening.
Figure 14 Heat mean monthly hourly consumption
The mean heat used has the maximum during January and its’ minimum during June and July with around 200 kW. The usage of heat is significantly more stable during the day than electricity as can be seen in Figure 14.
0 500 1000 1500 2000 2500 0 2 4 6 8 10 12 14 16 18 20 22 El ec tr ic ity u sa ge (k W h) Hour
Total Electricity usage
jan-16 feb-16 mar-16 apr-16 may-16 jun-16 july-16 aug-16 sep-16 oct-16 nov-16 dec-16 0 200 400 600 800 1000 1200 1400 1600 1800 2000 0 2 4 6 8 10 12 14 16 18 20 22 H ea t u sa ge (k W h) Hour
Total heat usage
jan-16 feb-16 mar-16 apr-16 may-16 jun-16 july-16 aug-16 sep-16 oct-16 nov-16 dec-16
Figure 15 Electricity to cooling machines mean monthly hourly consumption
The electricity for powering the cooling machines have a consumption profile resembling the total electricity usage. As shown in Figure 15 the daily load for cooling have similar peak hours to the total electricity usage.
5.1.3 Seasonal behavior
The monthly usage of energy shows the same results as the mean monthly hourly consumption with the distinction that it shows the total energy used during that month.
Figure 16 Monthly energy usage
In Figure 16 the monthly energy usage for the year 2016 is shown. The heat usage has its’ peak during the month of January with 18 % of the total heat for 2016 being used during this
0 100 200 300 400 500 600 700 800 0 2 4 6 8 10 12 14 16 18 20 22 El ec tr ic ity u sa ge (k W h) Hour
Total electricity to cooling machines
jan-16 feb-16 mar-16 apr-16 may-16 jun-16 july-16 aug-16 sep-16 oct-16 nov-16 dec-16 0 200000 400000 600000 800000 1000000 1200000 1400000
Jan Feb Mar Apr May Jun July Aug Sep Oct Nov Dec
Monthly energy usage
month, during the months of June and July only 1 and 2 % of the yearly heat was used respectively. The electricity usage is distributed more evenly throughout the year with the maximum during November with 12 % of the total electricity for 2016 and the minimum during June with 3 % of the total electricity.
5.1.4 Outside Air Temperature influence
The influence the outside air temperature has on the electricity and heat usage is presented in this section. The figures shown are in this section is based on the daily electricity and heat usage of the year 2016.
Figure 17 Electricity usage as a function of outside temperature
There is no clear relation between the outside air temperature and the electricity usage when temperatures rise over 0°C. The electricity usage can vary from ~5000 kW to ~3500 kW for temperatures over 0°C. 0 5000 10000 15000 20000 25000 30000 35000 40000 45000 50000 -20 -15 -10 -5 0 5 10 15 20 25 30 kW h Outside temperature (°C)
Figure 18 Heat usage as a function of outside temperature
There is a very clear relation between heat usage and outside air temperature which can be seen in Figure 18.
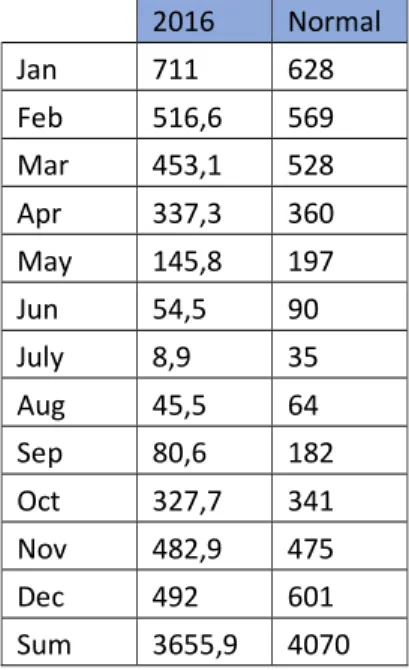
Table 6 Heating Degree days 2016
2016 Normal Jan 711 628 Feb 516,6 569 Mar 453,1 528 Apr 337,3 360 May 145,8 197 Jun 54,5 90 July 8,9 35 Aug 45,5 64 Sep 80,6 182 Oct 327,7 341 Nov 482,9 475 Dec 492 601 Sum 3655,9 4070
The difference between the normal year and the current year HDD is around 10 %. The normal year HDD was used for the city of Lindesberg (“Graddagar - Linde energi,” n.d.). The 2016 year HDD was calculated from temperature measurements from SMHI, the station was located in Hässlö, Västerås (“SMHI Öppna Data | Meteorologiska Observationer,” n.d.).
0 10000 20000 30000 40000 50000 60000 70000 -20 -15 -10 -5 0 5 10 15 20 25 30 kW h Outside temperature (°C)
5.1.5 Building Wise Consumption
As Figure 19 shows, the main part of consumption of both heat and electricity are centered to the cooling machines and the facilities they are located in, the football stadium Solid Park Arena and Bombardier Arena also contribute to the total amount substantially. The electricity to cooling for ABB Arena North and Mimerhallen are the same consumption, however in the figure these have been considered as a contribution to both facilities, hence their equality. Hakonplan and Månskensrinken has been combined. When considering the heat pump which supplies the building ABB Arena Syd with heat, this heat flow has only been expressed as the purchased energy in the form of the electricity to the heat pump i.e. meter UEL1096.
Figure 19 Building consumption share of heat and electricity
The main user of heat is ABB Arena Nord which stand for around 39 % of the purchased heat. ABB Arena Syd tops the chart for purchased electricity with 33 % of the total electricity usage where 1 % is used to produce heat. ABB Arena Nord also use a significant amount with 24 % of the total electricity used (cooling excluded). The total electricity used for cooling is 32 % of the total yearly electricity usage.
0 0,05 0,1 0,15 0,2 0,25 0,3 0,35 0,4 0,45
Building share of total electricity and heating
Electricity to cooling Heat
Figure 20 Building energy consumption split for end-use
In Figure 20 the energy used has been divided for electricity and heat use for the different types of end-use. The main end-user for electricity is the buildings, the split between the different processes such as HVAC, lighting etc. is however unknown.
5.2
Indicators
In the following sector the indicators that were examined are presented. All indicators are based on monthly or hourly consumption data from the year 2016.
5.2.1 Load factor
The load factor was computed as the mean usage during a period divided by the maximum usage for the same time. The indicator was considered at the monthly and daily level and was separated for electricity and heat usage.
0 500000 1000000 1500000 2000000 2500000 3000000 3500000
Electricity Heat Electricity Heat Electricity Heat
ABB Arena Syd ABB Arena Nord Solid Park Arena
kW
h
End-use buildings
Electricity to cooling Building Event Electricity to Heat pump
Table 7 Load Factor Electricity Heat Jan 0,66 0,50 Feb 0,65 0,58 Mar 0,53 0,51 Apr 0,51 0,51 May 0,54 0,36 Jun 0,45 0,24 July 0,47 0,32 Aug 0,67 0,37 Sep 0,70 0,48 Oct 0,56 0,48 Nov 0,64 0,47 Dec 0,63 0,48
The load factor for heat and electricity vary throughout the year with a clear drop during the summer months. The load factor is more stable for heat than for electricity, however, the load factor for electricity usage is significantly higher than heat. Meaning the usage of electricity is more stable than the heat usage.
Figure 21 Load Factor Electricity
The electricity load factor for the entire facility has the most stable consumption when the cooling machines are switched on, during the summer months when the cooling machines are switched off the load factor drops below 0,5 as shown in Figure 21.
0 0,1 0,2 0,3 0,4 0,5 0,6 0,7 0,8
Jan Feb Mar Apr May Jun July Aug Sep Oct Nov Dec