VT/s"rtryck
173
1991
The in uence ofsight distance on subjects
Iateral control
A study ofsimulated fog
Lisbeth Harms
Paper presented on the IV Conference on Vision in Vehicles, Leiden
27-29 august, 1991. Session D: Visual perception and vehicle control:
Collision avoidance
VHy-OCII Bil/(- Statens väg- och trafikinstitut ( VTI) ' 58 1 01 Linköping
Inst/tutet Swedish Roadand Traffic Research Institute . 8-581 0 1 Linköping Sweden
1 73
1991
The influence ofsight distance on subjects
lateral control
A study ofsimulated fog
Lisbeth Harms
Paper presented on the IV Conference on Vision in Vehicles, Leiden
27 29 august, 199 1. Session D: Visual perception and vehicle control:
Collision avoidance
%, Väg 'De/I a /(' Statens väg- och trafikinstitut l VTI) 581 01 Linköping
THE INFLUENCE OF SIGHT DISTANCE ON SUBJECTS' LATERAL CONTROL: A STUDY OF SIMULATED DRIVING IN FOG.
LISBETH HARMS
Swedish Road and Traffic Research Institute, VTI S-58101 Linköping, Sweden.
A driving simulator was used for investigating the
influence of sight distance on subjects speed and
lateral position on a simulation of a real road. The sight distance was varied by simulated fog delimiting
the sight distance to approximately 480 m, 120 m, 60
m and 30 m. Sight distance was found to influence
subjects mean speed whereas their lateral position
and lateral variation was not systematically
influ-enced by sight distances.
The correlation between the lateral position in free
sight conditions and conditions of reduced sight
(ba-sed on 100-m intervals of the driving route) was po sitive but it declined with decreasing sight
distan-ce. This finding strongly suggested that the pattern
of lateral variation differed between sight
distan-ces. Furthermore short sight distances resulted in a
weaker relationship between the angular deflection of the road and the subects lateral position than longer
ones. The mean z scores in 100 m intervals of the
driving route indicated that lateral deviations were both less sensitive to road curvature and less
consi-stent between subjects for shorter sight distances
than for longer ones. This result may suggest that
reduced sight increase the amount of random variation
reduced visibility 1
1 . INTRODUCTION
Reduced visibility poses a serious problem to car driving since
both longitudinal and lateral control are probably based on
en-vironmental references (OECD, 1976). Most car drivers reduce
their speed when confronted with severe sight restrictions but their speed reductions are usually found insufficient to prevent
the brake distance from exceeding the sight distance (Sumner et
al. 1976, Hills, 1980 and Hawkins, 1988). Reduced visibility may
also disturb the drivers lateral control by forcing them to ad just their lateral position to few, close and rapidly changing visual cues. Thus, under conditions of reduced sight the lateral
control can hardly be maintained without speed reductions.
Previously Tenkink (Tenkink, 1988) demonstrated that the amount
of lateral variation increased with decreasing sight distance
when the speed level was held constant, whereas in free-speed
conditions the increase in subjects lateral variation was
appa-rently compensated by speed reductions. However, it was also
found that the speed difference between a straight road and a curved road was smaller for short sight distances than for long
ones, and that the subjects lateral position in curves differed
between sight conditions. Both these findings indicated that
subjects mode of control was actually affected by restricted
sight i.e. The shorter the sight distance the less was the
influence of road layout on subjects' speed and lateral
posi-tion.
Providing that reduced visibility force drivers to use other
vi-sual cues for their lateral control than they would do during
free-sight, the pattern of lateral variations on a driving route
may differ considerably between sight distances. The present
study investigated subjects speed and lateral position on a
si-mulation of a rural road with different fog densities. The in
fluence of reduced sight on subjects pattern of lateral vari
ation in lOO-m intervals of the driving route was analyzed and
reduced visibility 2 2 . METHOD
2.1 Apparatus and simulations
The moving-base driving simulator at the Swedish Road and
Traf-fic Research Institute, was used for the experiment (see
Nord-mark et al., 1986 for technical specification of the driving si
mulator). The simulation of horizontal and vertical curvature
was based on measures of the angular deflections in 12 m
inter-vals of a 3.2 km long and 7 m wide section of a rural road. The
road included 3 major curves: Two reverse curves with minimi
radii of 250 m occupied a total of 1.2 km of the road section,
and one reverse curve with a minimum radius of 430 m.occupied
400 m. The mean angular deflection calculated for 100-m
inter-vals of the driving route varied between -23 (left-hand angles)
and +22 deg (right-hand angles). The angular deflection in
straight sections of the road varied between 0-5 deg. Road markings followed Swedish standard with intermittent edge and
centerlines.
Fog" was simulated by continuous reduction of the chromatic
value of pixels as a function of their calculated distance from
the driver. The maximum reduction, representing non-transparent
fog, was obtained at distances of approximately 480 m
(free-sight), 120 m, 60 m and 30 m (see Lidström, 1991 for specifi-cation of the fog function).
2.2 Procedure
Subjects participated in a comprehensive experiment including
(1) driving on a real road, (2) driving on a simulation of the
road and (3) driving on a simulated section of the road in fog.
This paper is concerned with fog-trials only. Each subject
per-formed 24 fog trials (six of each sight distance) of 3.6 km.
Fog-trial succeeded no-fog trials of 7.6 km and included 400 m
warmrup driving before the 3.2 km experimental driving. Speed
reduced visibility 3 of the driving route. Driving speed was measured in kilometers
per hour and the lateral position was measured in centimeters
from the (imaginary) left front-wheel to the centerline. 2.3 Subjects
Seven subjects participated in the experiment. They were aged
24-54 years with a mean age of 29.8 years. Their reported amount
of driving was 10.000-35.000 km/year with a mean of approximate-ly 14.000 km/year. They were trained in the driving simulator
before performing experimental sessions. Sight distances were
balanced between subjects and between successive sessions of
individual subjects.
3. RESULTS
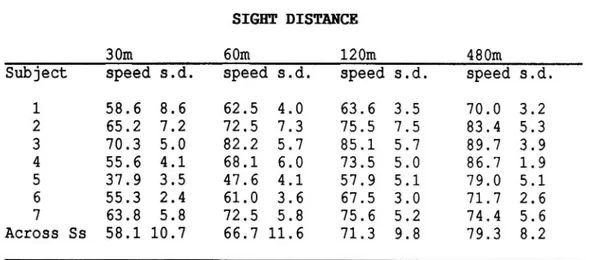
Table 1 presents the mean speed of individual subjects for the
four different sight distances. As can be seen in Table 1 the
mean speed decreased with decreasing sight distance but both
Table 1.: Mban speed (km/h) and standard deviations for the four
sight distances: 30m, 60m, 120m.and 480m.
SIGHT DISTANCE
30m 60m 120m 480m
Subject speed s.d. speed s.d. speed s.d. speed s.d. 1 58.6 8.6 62.5 4.0 63.6 3.5 70.0 3.2 2 65.2 7.2 72.5 7.3 75.5 7.5 83.4 5.3 3 70.3 5.0 82.2 5.7 85.1 5.7 89.7 3.9 4 55.6 4.1 68.1 6.0 73.5 5.0 86.7 1.9 5 37.9 3.5 47.6 4.1 57.9 5.1 79.0 5.1 6 55.3 2.4 61.0 3.6 67.5 3.0 71.7 2.6 7 63.8 5.8 72.5 5.8 75.6 5.2 74.4 5.6 Across Ss 58.1 10.7 66.7 11.6 71.3 9.8 79.3 8.2
the speed level and speed reduction varied between subjects. On
the average the mean speed for conditions with free sight was
79.3 hm/h, mean speed for 120-m sight was 71.3 km/h and for the
reduced visibility 4 66.7 and 58.1 km/h respectively. Driving speed was subjected to a standard analysis of variance with subjects and sight distance as independent variables. Both the speed difference between
sub-jects (F(6,18)=11.16, p <.0001) and sight distances (F(3,18)=
20.89, p <.0001) were found significant.
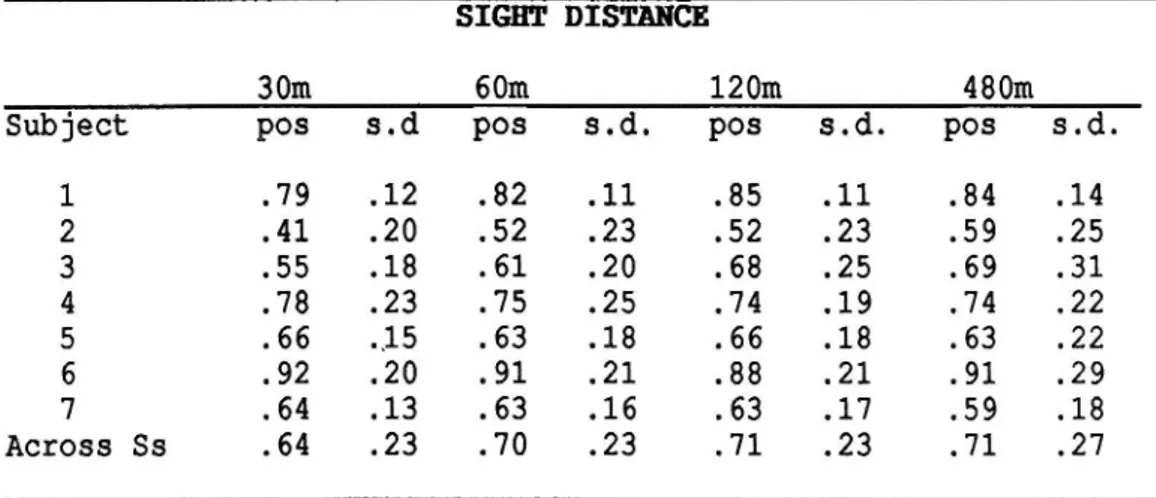
Table 2 presents the distance to the centerline for individual
subjects and its standard deviation. Both the lateral position and its standard deviation varied between subjects, whereas the
influence of sight distance on these measures was small and it
differed between subjects.
On the average the lateral position for free-sight was .68 m.
The lateral position was .70 m.for 120-m sight and it was .71 m
both for sight distances of 60 m and 30 m. The mean standard
de-viation of the lateral position for free-sight conditions was
.27 m. For all other sight distances it was .23 m. The lateral
position was subjected to a standard analysis of variance with
subjects and sight distance as independent variables. The
dif-Table 2.: Mban lateral position. (meter from. centerline) and
standard deviation for the four sight distances: 30m, 60m, 120m and 480m.
SIGHT DISTANCE
30m. 60m. 120m. 480m
Subject pos s.d pos s.d. pos s.d. pos s.d.
1 .79 .12 .82 .11 .85 .11 .84 .14 2 .41 .20 .52 .23 .52 .23 .59 .25 3 .55 .18 .61 .20 .68 .25 .69 .31 4 .78 .23 .75 .25 .74 .19 .74 .22 5 .66 _15 .63 .18 .66 .18 .63 .22 6 .92 .20 .91 .21 .88 .21 .91 .29 7 .64 .13 .63 .16 .63 .17 .59 .18 Across Ss .64 .23 .70 .23 .71 .23 .71 .27
ference in the lateral position between subjects was significant
F(6,18)= 42.00, p <.0001) whereas the effect of sight distance
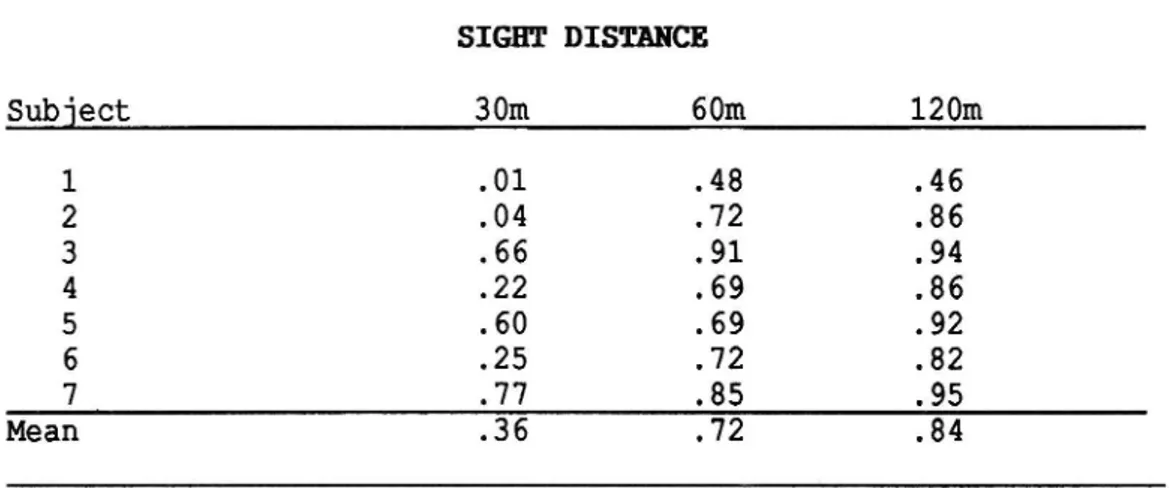
reduced visibility 5 The lateral position in each 100-m intervals of the driving
rou-te was compared between the different conditions of sight for
each subject individually. Table 3 presents product-moment
cor-relations between subjects lateral positions in conditions with
free sight and conditions of reduced sight. Generally the
coef-ficients were positive and generally their numerical value
de-creased with decreasing sight. Furthermore the correlation
be-tween the deflection angle of the road in lOO-m. intervals and
the subjects lateral positions was found to decline with
decreasing sight distance.
Table 3.: Productemoment correlations between lateral position
in free-sight conditions and conditions of reduced sight based
on 100emetres intervals of the driving route. SIGHT DISTANCE Subject 30m 60m. 120m 1 .01 .48 .46 2 .04 .72 .86 3 .66 .91 .94 4 .22 .69 .86 5 .60 .69 .92 6 .25 .72 .82 74 .77 .85 .95 Mean .36 .72 .84
The mean correlation between the horizontal angle of the road
and the lateral position was .76 for conditions with free-sight, .74 for 120-m sight, .58 for 60-m, and .20 for the 30-m sight distance.
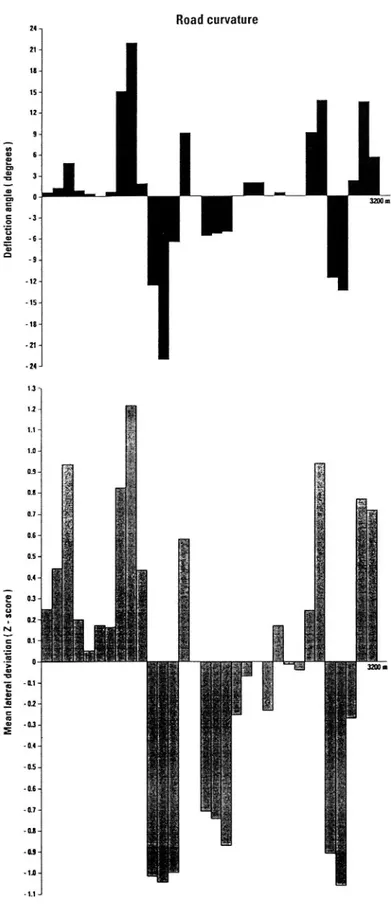
The lateral deviation in successive 100-m intervals of the
driving route was estimated by converting the lateral position
of individual subjects to z-scores for each sight distance
se-parately. Thus, the mean z score in a 100-m interval reflected
the average deviation from the mean in that interval within a
certain sight condition. Figure 1 shows the angular deflection
in successive 100-m intervals of the road (upper part) and the
reduced visibility 6 Road curvature 24 21-1 IS'1 12-De fl ec ti on an gl e (d eg re es ) -12--15_ -18... -21% -24-Me an la te ra l de vi at io n (Z -s co re )
-1.1-Figure 1.: Upper: Angular deflections (deg) in successive 100 m
intervals of the road. Lower: lateral deviations (z score) in
reduced visibility 7
As can be seen in Figure 1 the z-scores followed the road
curvature: Left-hand curves (negative angular deflections) were
associated with negative z-scores indicating a displacement
towards the center of the road, whereas right-hand curves were
associated with positive z-values indicating a lateral deviation
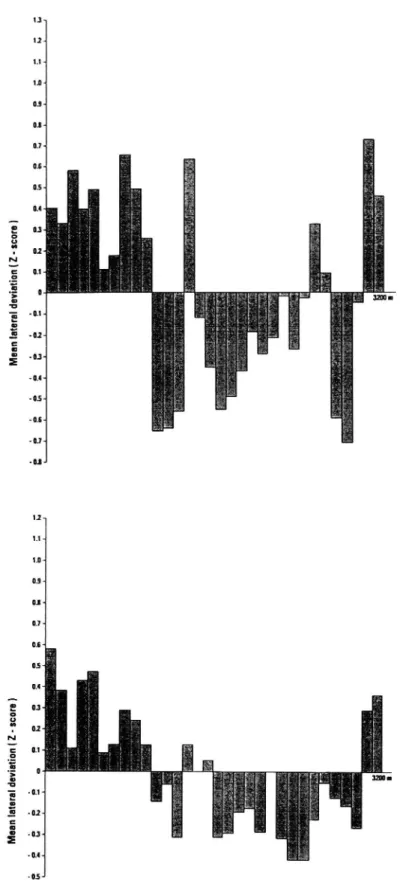
towards the road edge. Figure 2 (see page 7 and 8) presents the
corresponding z-scores for each of the three sight distances:
120-m, 60-m, and 30-m. Figure 2 illustrates the fact that the
lateral deviations were more sensitive to road curvature the
longer was the sight distance. Furthermore the pattern of
z-scores demonstrated that the lateral deviations were less
consistent between subjects for short sight distance than for
long ones. Thus, although the amount of lateral variation was
rather unaffected by sight distance the different patterns of
deviation on the driving route suggested a change in the
efficiency of the lateral control.
& _ ; gas Me an la te ra l de vi at io n (Z _S e m ) få? 'i '$: igt
reduced visibility 8 0.9 0.8-Ma an la te ra l de vi at io n (Z -s co re ) M e a n la te ra l de vi at io n (Z -s co re )
.os-Figure 2.: The mean lateral deviation (z score) in 100 m inter vals of the 3.2 hm.road section in conditions with 120em.sight
(previous page) 60am sight (This page, upper part) and 301m sight (this page, lower part).
reduced visibility 9 4. DISCUSSION
The present study was consistent with previous studies in
fin-ding that reduced sight caused a spontaneous reduction of
dri-ving speed. The speed reductions were not sufficient to maintain a positive safety margin but they may have prevented reduced
sight from increasing in the amount lateral variation.
The different patterns of lateral variation on the driving route
found in this study, suggested subjects' lateral control was
actually influenced by sight distance. In free sight conditions
subjects consistently used their preview for compensating the
road curvature i.e. their lateral displacements followed the
direction of the curves. Sight reductions resulted in a gradual
degradation of the visual references and apparently prevented
the subjects from compensating road curvature by lateral
dis-placements.
The change in the pattern of lateral deviations on the driving
route between conditions of sight reflected both poorer sensi
tivity to road curvature for shorter sight distance than for
long ones, and less consistent patterns of variation between
subjects for short sight distances.
Thus, speed reductions may have prevented an increase in total amount of lateral variation on the driving route. Since reduced visibility deprived the subjects of visual references the amount
of random variation in their lateral positions on the driving
reduced visibility 10
ACKNOWLEDGMENT
This study was conducted with grants from The National Swedish
Road Administration.
REFERENCES
Hawkins, R.K.: Motorway traffic behaviour in reduced visibility
conditions in Gale et al. (eds.) Vision in Vehicles II, pp.
9-18, 1988.
Hills, B.L.: Vision visibility and perception in driving.
Perception vol. 9 pp. 183 216, 1980
Kochmond, W.C and K. Perchonok: Highway fog. NCHRP report nr.
95, 1970
Lidström, M.: R5/11 Fog effects, Version 1.0 91-03 12,
(unpub-lished reference manual) VTI, 1991.
Nordmark, S., H. Jansson, M. Lidström and G. Palmkvist: A moving
base driving simulator with a wide angle visual system. TRB 64.
annual meeting. TRB, 1985.
OECD: Adverse weather, reduced visibility and road safety,
driving in reduced visibility due to adverse weather, Road Research Report, OECD 1976.
Sumner, R., C. Baguley and J. Burton: Driving in fog on the M4.
Supplementary Report nr. 281. TRRL, 1977.
Tenkink, E.: Lane keeping and speed choice with restricted
sight distances in Rothengatter T. & R. deBuin (eds.) Road User