Optimisat'on of clot oid'lengths
simulations of dyn mic vehicle
reactions on horizontal curves
with track irreg Iarities
Paper presented at Railway Engineering 2000,
5th 6th July, 2000, London, United Kingdom
Björn Kufver
O O c N moo
m
: O >= :s. +| h B w"fig.-23523? ix ;
w e ? ? ? 1 1 7 0 1 '. .-.> 't "'
w It.*Å'lff'(,,,.mov-J... "q \_»_ ;-'='/W..)J3r; I _
Swedish National Road and
Fansport Research Institute
VTI särtryck 335 - 2000
Optimisation of clothoid lengths
simulations of dynamic vehicle
reactions on horizontal curves
with track irregularities
Paper presented at Railway Engineering 2000,
5th 6th July 2000, London, United Kingdom
Björn Kufver
OPTIMISATION OF CLOTHOID LENGTHS
- SIMULATIONS OF DYNAMIC VEHICLE REACTIONS ON
HORIZONTAL CURVES WITH TRACK IRREGULARITIES
B Kufver VTI
SE 581 95 Linköping Sweden
KEYWORDS: Alignment, Clothoids, Radii, Track irregularities, Transition curves, Vehicle dynamics
ABSTRACT
In this study, equally costly alignment alternatives are compared. The cost is assumed to be correlated to the extent to which existing obstacles along a new alignment need to be removed. Hence, different combinations of radii and clothoid lengths are located in prede ned terrain corridors.
An X2000 power car, a tilting X2000 coach and a non-tilting Eurofima coach have been studied. Vehicle reactions have been simulated in the time domain with non-linear vehicle/track models using 46 degrees of freedom for each vehicle.
Vertical wheel/rail forces, track shift forces and wheel climbing ratios have been used in boundary conditions, with limits suggested by UIC and CEN, Passenger comfort has been used as the object function. It has been found that in curve design, the most suitable single value is Comfort on Curve Transitions (PCT) since this takes into account the combined effects of lateral acceleration, lateral jerk and roll velocity of the vehicle body.
The simulations are focused on the in uence of the (design) alignment, but the track model also includes lateral, vertical, cant and gauge irregularities measured with the Swedish track recording vehicle STRIX. INTRODUCTION
When increasing permissible train speeds on existing lines, the horizontal alignment is often the binding constraint. Therefore, the present study is focused on dynamic vehicle reactions when running through horizontal curves.
The alignments that are compared are selected in order to t predefined terrain corridors. All alignment alternatives passing the same set of obstacles are assumed to be equally costly to build (Kufver, 1997a &
1998a). If an "obstacle" can be removed at no cost, it should not be classified as an obstacle, and vice
versa if two compared alignment alternatives are not equally costly to build, this must be explained in differences in obstacles to be removed.
The concept of equally costly alignment alternatives and obstacles has been used in studies of the usefulness of S-shaped superelevation ramps (Kufver, 1999) and in studies of optimal combinations of
radii and lengths of transition curves (Kufver, 1997b), (Kufver & Andersson, 1998), (Kufver & Gåsemyr,
ALIGNMENT ALTERNATIVES
In the present study, four prede ned alignment corridors have been evaluated. In each corridor, there must be a single curve (a clothoid/circle/clothoid combination), which may be de ned by the radius R
and the length of each transition curve Lt. The curves are located between tangent tracks, where the
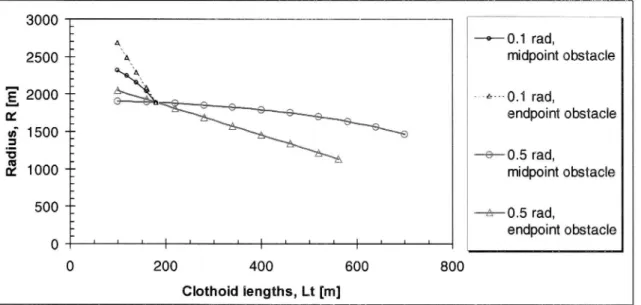
change in direction is 0.1 rad for two of the corridors, and 0.5 rad for the other two. The corridors enable the use of clothoid lengths of 180 m and radius 1888 m, which is the smallest curve radius for 200 km/h operation with conventional trains, according to Swedish track standards. (Certain vehicles, including tilting trains, may pass R=1888 m at a higher speed than 200 km/h.)
The binding obstacles de ning the edges of the corridors are placed either in the middle of the curve or at the end. The latter cases may consist of turnouts on the adjacent tangent tracks, which should remain straight and without cant, see Figure l.
Figure l. A double slip at Älvsjö (8 km south of Stockholm C) as a binding endpoint obstacle. Largest possible curve radius R as a function of clothoid length Lt is shown in Figure 2.
3000 A ° O.1 rad, 2500 midpoint obstacle & 0.1 rad, endpoint obstacle _e 0.5 rad, midpoint obstacle Ra di us , R [m ] _ ; _. L N O 01 O o o o O O O l l l 500 + 0.5 rad, endpoint obstacle l l l l l I l I l l l | | | | I l | l | l l l l | l l l | O N O O 400 600 800 Clothoid lengths, Lt [m]
VEHICLE MODELS
In the present study, the evaluation of different alignment alternatives is based on dynamic vehicle reactions. For economic and practical reasons, the dynamic vehicle reactions are estimated through simulations instead of measurements in full-scale tests. Such tests are expensive, but it also too dif cult to control background variables such as vehicle speed, friction in wheel/rail contact, track stiffness and track irregularities.
The simulations have been conducted with the multibody code GENSYS. This code is used in a wide range of applications concerning track/vehicle interaction. Descriptions of the software and its performance in benchmark tests are published in Iwnicki (1999).
In the present study, the vehicles are modelled with seven rigid bodies (a vehicle body, two bogies and
four wheelsets), each having six degrees of freedom, see Figure 3.
i ,- Longitudinal and roll
Lateral and pitch $'% :l
Vertical and yaw
---- %> - -- £6»
C (
Figure 3. Degrees of freedom in the vehicle models.
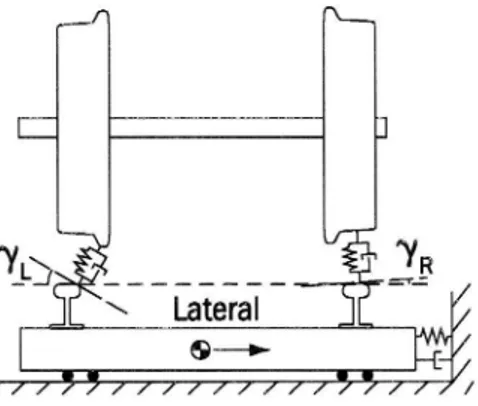
The track model consists of a lumped mass connected to each wheelset. Each mass has one degree of freedom, lateral displacement. Vertical exibility is introduced by a spring, representing a lumped exibility, in wheel/rail contact, Figure 4. Data for dampers and horizontal springs in the track model are published in Kufver (1997b). Friction in the wheel/rail contact patches has been set at 0.4.
P s M
Figure 4. Flexibility between wheel and track and between track and ground in the model. The following three vehicles have been studied:
(1) The Euro ma coach (UIC-Zl), a non-tilting standard coach, used by several railway
companies in Europe.
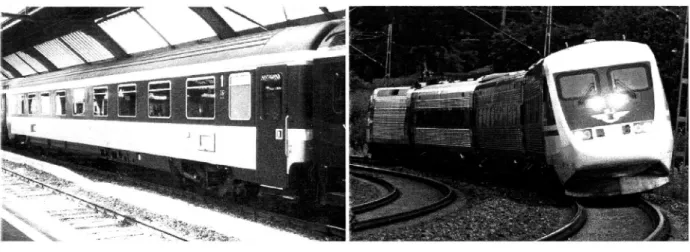
(2) The SJ UA2 coach, a tilting coach used in the Swedish X2 trainsets (also called XZOOO).
Figure 5. A Eurofima coach. Figure 6. An X2000 trainset. Public vehicle data are published in Kufver (1997b).
EVALUATION VARIABLES
In the present study, it has been decided to follow recent CEN (1995 & 1999) and UIC (1999) draft standards on evaluation of track/vehicle interaction as closely as is possible and relevant. In wheel/rail
contact, vertical wheel forces Q, track shift forces ZY and climbing ratios Y/Q have been evaluated, see Table 1.
Table 1. Variables in wheel/rail contact, processing and limits.
Variable Low-pass lter Statistics Limit
Vertical wheel force, Q 30 Hz 99.85 percentiles 180 kN
Track shift force, ZY 30 Hz, 2 m averaging 99.85-percentiles 10 kN+static axle load/3
Climbing ratio, Y/Q 30 Hz, 2 m averaging 99.85-percentiles 0.8
According to CEN (1999) and UIC (1999), the quantities in Table 1 should be evaluated at a slightly higher speed than the planned operating speed, but this has not yet been done. Further simulations are planned and will be presented during autumn 2000.
Passenger (dis)comfort is expressed as PCT, passenger comfort on curve transitions. This measure takes
into consideration the combined effect of lateral acceleration, lateral jerk and roll velocity of the vehicle body when passing transition curves (CEN, 1995). The signals are 2 Hz low pass ltered and averaged during 1 second according to CEN. There are two PCT functions, one of which is validated for seated passengers and the other for standing passengers. In this paper, PCT for standing passengers will be shown. The PCT values indicate the percentage of the passengers who consider the level of comfort to be low.
TRACK IRREGULARITIES
Two sets of track irregularities were used in the present study, denoted Track A and Track B. They were selected on the criteria that the data sets are to represent poor track quality for 200 km/h operation, and that they are to be approximately equally poor over the entire length used in the simulations. The latter criterion was dif cult to ful l. Neither of the selected tracks contains any switches or crossings.
Track A contains irregularities from a compound curve on the up line from Malmö to Stockholm
(southern main line in Sweden) at chainage 153+800 (km+metres). However, the curve is classified only
for 130 km/h (165 km/h for tilt operation). The track quality just matches the maintenance limit for a
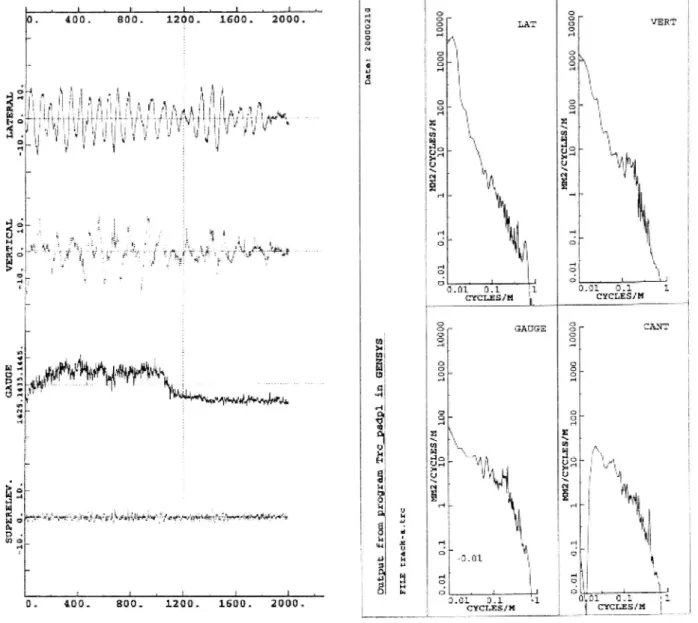
140 km/h track, and the limit is exceeded if standards for 145 km/h (and above) are applied. On the tangent track before the curve, the gauge is approximately 1430 mm, and on the transition curve, the gauge widens. On the circular portions of the curve, the gauge is approximately 1440 mm. In the simulations, the track irregularities were superimposed so that the start of the transition curve in the design alignment was in phase with the start of the transition curve in the le containing the irregularities. Appendix A shows irregularities plotted against chainage and power spectral density (PSD) for Track A.
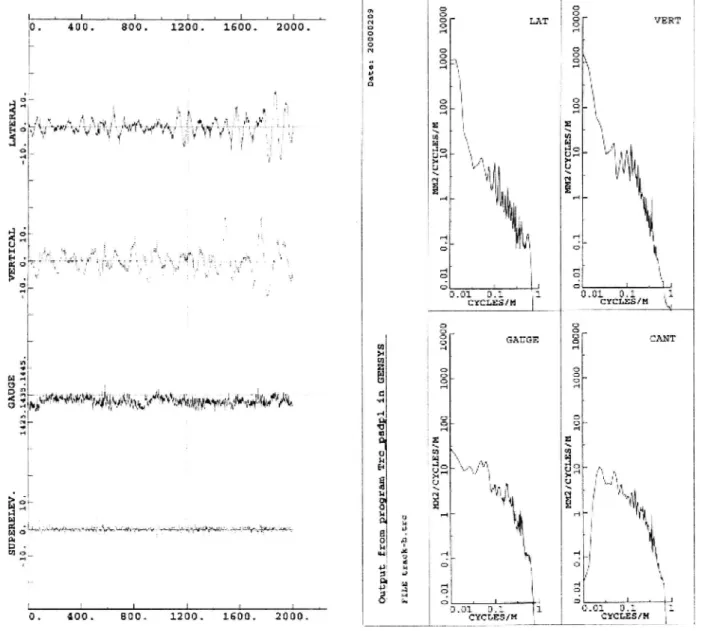
Track B contains irregularities from tangent track on the up line from Gothenburg to Stockholm (western main line in Sweden) at chainage 158+000 (km+metres). The track is classi ed for 160 km/h (190 km/h for tilt operation). The track quality matches the maintenance limit for 145 km/h (and above). The limit is exceeded slightly for vertical irregularities, but there is a small margin for cant irregularities. The gauge is approximately 1433 mm. Appendix B shows irregularities plotted against chainage and PSD for Track B.
When superimposing track irregularities, the forces (99.85-percentiles) increase. Figure 7 shows Q forces and Y forces (plotted against distance along track) from a simulation of the Euro ma coach on tangent track with track irregularities, Track A.
... H N O 09 EH 0. 200. 400. 600. 800.dist 0. K 200. I 400. I 600. 1800. dist
Figure 7a b. Vertical Q forces [kN] and lateral Y forces [kN] of two wheels of the Euro ma coach running on tangent track at a speed of 200 km/h. Irregularities from TrackA are used in the simulation. An overview of the effects of the irregularities on the vertical Q forces is shown in Table 2. (The length of the simulations on straight track is the same as for the two corridors with a change in direction of
0.1 rad.)
Table 2. Vertical Q forces (99.85-percentiles, worst wheel) on tangent track.
No irregularities Track A Track B
Euro ma coach, 200 km/h 58.0 kN 71.2 kN 74.3 kN
SJ UA2 coach, 250 km/h 596 kN 78.5 kN 79.6 kN
SJ X2 power car, 250 km/h 90.2 kN 121.4 kN 118.8 kN
Measured irregularities from the outer rail of Track A have always been superimposed on the outer rail in the simulations. Track B, which contains irregularities from a tangent track, has been used twice for each alignment alternative, so that irregularities from the left rail and right rail have both been superimposed on the outer rail in the simulations.
SIMULATIONS ON CURVES
The vehicle reactions were estimated on the alignment alternatives in the terrain corridors, as de ned in
Figure 2. The circular curves were provided with 150 mm cant. The cant varied linearly on the clothoids, the ramps coinciding with the transition curves.
The non-tilting Euro ma coach passed the curves at a speed of 200 km/h. At the clothoid length
Lt=180 m, cant de ciency is IleOmm and rate of cant is dD/dtz46 mm/s, which are the limits
according to Swedish track standards for conventional vehicles. On longer transition curves, the cant de ciency I exceeds the limit, while on shorter transition curves (and superelevation ramps), the rate of cant dD/dt exceeds the limit.
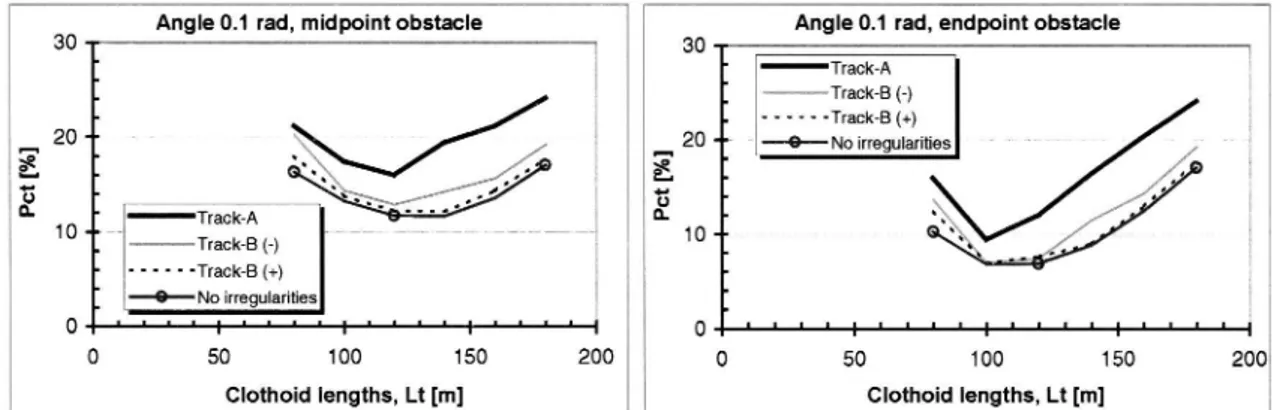
The resulting PCT values are shown in Figures 8 9. Each alignment alternative has been evaluated without irregularities, once with TrackA and twice with Track B.
30 Angle 0.1 rad, midpoint obstacle Angle 0.1 rad, endpoint obstacle
' 30 ' ' Track-A WW Track-B (-) _ . --- Track-B (+) __ 20 " - . 20 " 9 No irregularities å. ' å ' * 8 . '5 n' 10 _: 7 Track-A , ' ' ' " ,, , , 1 n. . _ www-Track-B (-) 10 ': --- Track-B (+) 9 No irregularities 0 ' ' ' ' : ' ' ' ' : ' ' ' ' : ' ' ' ' : 0 0 50 100 150 200 0
Clothoid lengths, Lt [m]
Clothoid lengths, Lt [m]
Figure 8a-b. PCT for the Euro ma coach (speed 200 km/h). Terrain corridors with an angle of 0.1 rad.
Angle 0.5 rad, midpoint obstacle Angle 0.5 rad, endpoint obstacle
40 : 60 . ' 50 30 -40
--s
s
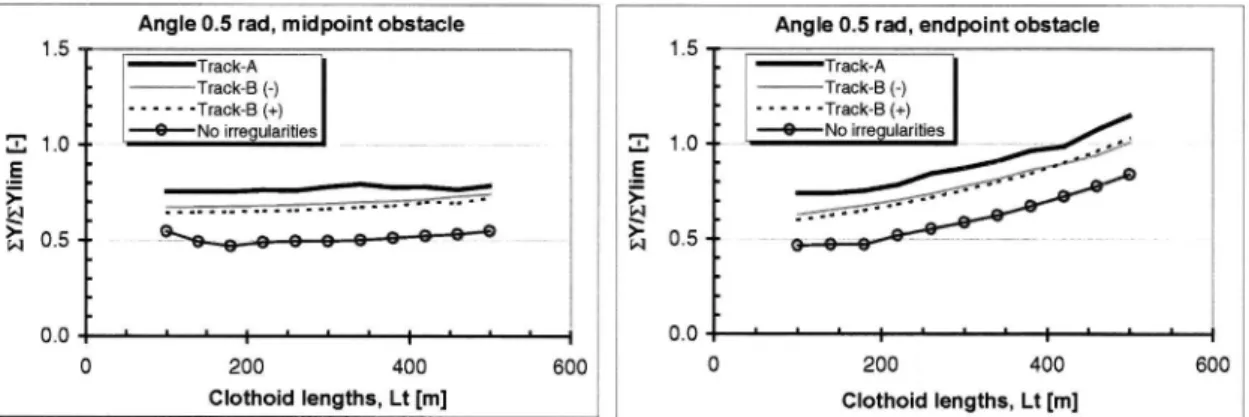
-% 20o E' 30 --0 . n. . Track_A o. 20 __ TraCk'A 10 =: ,, www m Track-B (-) . smm-Track-B (-) --- Track-B (+) 10 " ' ' ' ' ' -Track-B (+) 0 9 No irregularities . 6 No irregularities | I " l O | 0 200 400 600 0 200 400 600Clothoid lengths, Lt [m]
Clothoid lengths, Lt [m]
Figure 9a-b. PCT for the Euro ma coach (speed 200 km/h). Terrain corridors with an angle of 0.5 rad. The variables in the wheel/rail contact were all below their limits, This may be a consequence of the low cant de ciency in the reference alternative (1:100 mm). Certain railway administrations accept a cant de ciency of approximately 150 mm for this vehicle.
The tilting SJ UA2 coach passed the curves at a speed of 250 km/h. At the clothoid length Lt=l80 m, cant de ciency is I=24l mm, which is slightly below the limit (245 mm) according to Swedish track standards for tilting trains. However, the rate of cant de ciency is a'l/dt=91 mm/s, which is above the Swedish limit (78 mm/s). When lengthening the clothoids, cant de ciency I exceeds the limit of 245 mm. The resulting PCT values are shown in Figures 10 11. Again, each alignment alternative has been
Angle 0.1 rad, midpoint obstacle Angle 0.1 rad, endpoint obstacle
40 _ _ . 40 _
30 -E 30 .:
s
:
$
5
&- 20 -: % 20 -- ,, ,,,, ~
&) . Track A _ : å : - Track-A
- Track-B (-) f : mmerack-B (-)
10 --: --- Track B (+) , ..
, 10 - ---Track-B (+)
9 No irregularities f : e =No irregularities
0 I . I L lL . I l I? : l l . l : l l l l : 0 . | I | | : | | 1 1 '1 1 | | | : | | | | :
0 50 100 150 200 0 50 100 150 200
Clothoid lengths. Lt [m] Clothoid lengths, Lt [m]
Figure lOa-b. PCT for the SJ UA2 coach (speed 250 km/h). Terrain corridors with an angle of 0.1 rad.
Angle 0.5 rad, midpoint obstacle 40 Angle 0'5 rad, endpoint obstacle
40 _ " : Track-A Track-A , : X m,,»mTrack B(-) 30 _: i , , ,, ' " ' Track-B H 1 30 -: x --- Track-B (+) : """ Track-B (+) - 9 No irregularities . _ 9 No irregularities : få" ' i Q o . E' 20 -1 7: 2° ':
&
:
&
10 -- 10 O l l r l I I . I 0 l l l l J I 0 200 400 600 0 200 400 600Clothoid lengths, Lt [m]
Clothoid Iengths, Lt [m]
Figure lla b. PCT for the SJ UA2 coach (speed 250 km/h). Terrain corridors with an angle of 0.5 rad.
For the SJ UA2 coach, the track shift forces do not exceed the limit if cant de ciency is less than
297 mm for Track A (track quality for 140 km/h operation!) and 344 mm for Track B. The most critical
case is the corridor with a change in direction of 0.5 rad and an endpoint obstacle, since this corridor
generates the smallest radii (see Figure 2).
Angle 0.5 rad, midpoint obstacle Angle 0.5 rad, endpoint obstacle
1-5 * 1.5
Track-A 'Me MW Track-B (-)
--- Track-B(+) -0 No irregularities
3 1.0 2 1_0 _:
.§ lg '
ä
ä
_
33 0.5 33 0.5 _.
. Track-A ämne MMTrack-B (-)
_ --- Track-B (+) O No irregularities
0.0."'t"':"': 0-0"'="':"':
O 200 400 600 0 200 400 600
Clothoid lengths, Lt [m] Clothoid lengths, Lt [m]
Figure l2a-b. Track shift forces ZY (worst Wheelset, 99.85-percentiles) of the SJ UA2 coach (speed 250 km/h). Terrain corridors with an angle of 0.5 rad.
Vertical Q forces and the wheel climbing ratios Y/Q of the SJ UA2 coach did not exceed their limits. The SJ X2 power car is heavier than the SJ UA2 coach and hence the limit for track shift forces XY is higher. Figure 13 shows that track shift forces (in relation to the limit) are not worse for the power car than the tilting coach.
Angle 0.5 rad, mid point obstacle Angle 0.5 rad, endpoint obstacle
. 1.5 1 5 - Track-A jf - Track-A zvmmTrack-B (-) i - w Track-B (-) ______ Track-B (+) " ' ' ' ' ' -Track-B (+) '. 1 O 9 No irregularities ' "T' 1 0 i: 9 No irregularities å __ .§ >_- _ _ WW ; Z.,] 0.5 w [>,-q 0.5 " 0.0 ' ' ' ' : ' ' ' : ' ' ' i 0.0 r - 1 O 200 400 600 0 200 400 600
Clothoid lengths, Lt [m]
Ciothoid lengths, Lt [m]
Figure 13a b. Track shift forces ZY (worst wheelset, 99.85-percentiles) of the SJ X2 power car (speed 250 km/h). Terrain corridors with an angle of 0.5 rad.
Vertical Q forces reach the limit of 180 kN at a cant de ciency of 320 mm for Track A and 370 mm for Track B. Such high cant de ciencies were only used in the terrain corridor with an angle of 0.5 rad and an endpoint obstacle (R=1573 m/Lt:340 111 and R=1414 m/Lt=420 m, respectively). Wheel/climbing ratios Y/Q were lower than the limit 0.8 in all alignment alternatives.
DISCUSSION AND CONCLUSIONS
The results from the present study con rm earlier observations and conclusions published in Kufver
(1997b), Kufver & Andersson (1998) and Kufver & Gåsemyr (1999a-b). The clothoid lengths of a single
curve that minimise comfort disturbances (PCT) depend on:
(1) The angle between the adjacent tangent tracks. A larger angle results in longer optimal
clothoids.
(2) The position of the binding obstacles. A binding obstacle in the middle of the curve
normally results in a longer optimal clothoid than a binding obstacle at the end.
(3) Vehicle characteristics. Tilting vehicles result in longer optimal clothoids than non tilting
vehicles.
The PCT values are generally higher for track with irregularities than without, and are generally higher for
Track/1 than Track B. However, the clothoid lengths Lt* that minimise PCT are in most cases the same,
independent of the track irregularities.
A small percentage of passengers suffer from symptoms of motion sickness when travelling in a tilting train. The contribution from different types of motion is unclear (Förstberg & Ledin, 1996), but results from Japan (Koyanagi, 1985), (Ohno, 1996) and Sweden (Förstberg, 1996) indicate that roll motions are important. In Japan, it has been found that when limiting roll velocity of the vehicle body to 0.1 rad/s and roll acceleration to 0.3 rad/52, tendencies to motion sickness have been reduced, although they have not been completely eliminated (Ohno, 1996). In the present study, roll velocities are lower than 0.1 rad/s when the clothoids are 140 m or longer for the 0.1 rad curves, and 180 m or longer for the 0.5 rad curves.
In the four evaluated terrain corridors, roll velocities for of the tilting SJ UA2 coach become less than 0.1 rad/s when PCT is minimised.
In planning new railways and realigning of existing ones, the following two aspects should be taken into consideration:
(1) The optimal alignments are not the same for tilting vehicles compared to non-tilting
vehicles. The optimal transition curves are longer for tilting trains.
(2) For tilting trains, the desire for long transition curves (due to passenger comfort) must be
balanced against the desire for large curve radii (due to wheel/rail forces).
ACKNOWLEDGEMENTS
This paper is based on results from a research project on track geometry nanced by Adtranz Sweden, the Swedish National Rail Administration (Banverket), the Swedish Transport and Communications Research Board (KFB), the Swedish State Railways (SJ), and the Swedish National Road and Transport Research Institute (VTI). The project is being conducted in cooperation with Professor Evert Andersson at the Division of Railway Technology, Royal Institute of Technology (KTH), Stockholm, Sweden. REFERENCES
CEN, (1995). Railway applications - Ride comfortfor passengers - Measurement and evaluation. CEN TC256 WG7 (Final committee draft for of cial CEN enquiry). Brussels.
CEN, (1999). Railway applications - Testing for acceptance of running characteristics of railway vehicles - Part l : Testing ofrunning behaviour. CEN TC 256 WG 10 (Draft January 1999). Brussels. Förstberg, J., (1996). Motion related comfort levels in trains - A study on human response to different tilt control strategiesfor a high speed train. TRlTA-FKT Report 1996:41. Stockholm: KTH.
Förstberg, J. & Ledin, T., (1996). Discomfort caused by low-frequency motions - A literature survey of hypotheses and possible causes of motion sickness. VTI Meddelande 802A. Linköping: VTI. (Also published as TRlTA FKT Report 1996z39. Stockholm: KTH.)
Iwnicki, S., (1999). The Manchester benchmarks for rail vehicle simulation. Supplement to Vehicle System Dynamics Vol. 31. Lisse: Swets & Zeitlinger. ISBN 90-265-1551-0.
Koyanagi, S., (1985). Ride quality evaluation of a pendulum car. QR ofRTR], 26 (3): 89-92.
Kufver, B., (1997a). Mathematical description ofrailway alignments and some preliminary comparative studies. VTI Rapport 420A. Linköping: VTI. (Also published as TRlTA-FKT Report 1997z30.
Stockholm: KTH.)
Kufver, B., (l997b). Optimisation ofsingle horizontal curves in railway alignments. VTI Rapport 424A. Linköping: VTI. (Also published as TRITA FKT Report 1997145. Stockholm: KTH.)
Kufver, B., (1998a). Realigning railways in track renewals Methods and objectives. Proceedings:
Railway Engineering - 98, 10 July 1998, London pp 53 57. Edinburgh: ECS Publications. ISBN 0-947644-37-7 (Also published as VTI Särtryck 303. Linköping: VTI.)
Kufver, B., (1999). Realigning railways in track renewals - Linear versus S-shaped superelevation ramps. Proceedings: Railway Engineering - 99, 25 26 May 1999, London. Edinburgh: ECS Publications. ISBN 0 947644-39-3. (Also published as VTI Särtryck 318. Linköping: VTI.)
Kufver, B. & Andersson, E., (1998). Optimisation of the railway alignment considering vehicle reactions. Proceedings: International seminars on Infrastructure and vehicle/in astructure interaction, 17-19 February, Hong Kong. The Institution of Civil Engineers. (Also published as VTI Särtryck 302. Linköping: VTI.)
Kufver, B. & Gåsemyr, H., (1999a). Adaptation of Norwegian tracks to tilting trains - Speci c aspects of high speed curving. Proceedings: WCRR '99, World Congress on Railway Research in Tokyo, 19-23 October 1999 (Also published as VTI Särtryck 327. Linköping: VTI.)
Kufver, B. & Gåsemyr, H., (1999b). Norwegian railways adapted for higher train speeds - Track aspects of tilting trains. Proceedings: Railway Engineering 99, 25-26 May 1999, London. Edinburgh: ECS Publications. ISBN 0 947644 39 3. (Also published as VTI Särtryck 319. Linköping: VTI.)
Ohno, H., (1996). What aspect is needed for a better understanding of tilt sickness? QR of RTR], 37 (1): 9-13.
UIC, (1999). Test and acceptance of railway vehicles from the points of view of dynamic behaviour, safety, trackfatigue and quality ofride. UIC 518 OR (Draft of January 1999). Paris.
Figure A. TrackA: Irregularities as a function of distance along track and as PSD. S U P E R E L E V . G I G ; 0. i n . 9 | | rr r '?enfina.-543.irn'j-ffw'fJÄE' IBG. Såå 300. &h 1200. *?uwwweåäwawwWÅe i AA 1500 2000.1 GJ IM JE I I ' l -400. # ana. & 41 .. .. .. L 1200. H W 1600. |" J _ l 2000. ! Ou tp ut fr am pr aa r5 9_ ?£ 9, 2é gp l in GE Hå äs u F I L E t : a a k -n . t r c M H R I C T C L E S I H 0. 1 1 10 ID G 3. 01 10 09 LU QO U " 'I * ~ 1 ' | xx | :. ] _
5.01 lL.-|_ MI # * 14 ; an'-'"' CYCLEEIH h D a n s E l l LH HJ IC YC LE SI HW L MW Mu La ng e HI.-|__| Ö 13 1G B l u A | | M M Z I C X C L E S I H ' 1c . här? 11 949 .-9Å1"" cwcnzsxm n. m; u. 1 1 l n (I ' . I ' . i * " . i f ,
mn zf cr cn r3 fn . LD LD U lU GD D | h-l' d k : å h . f _ n -£ . "___ _j ? van? ; Appendix A
Appendix B '" "" '"_l_ _'_' ' ! av D 3 o : | . | -- _L . L - i . 1 . == g i G- .. -; . . : " T ; C" VERT ; in. 400. 300. 1.200. 1500. 2000. g & LA E; . L lå ' j
I
!"
ä _
s .,
*_ s ä 3 33 5 . 2= I| | . ' | En . | ' lj l' 4 , U _ L ; r:; ' G 'EH; ' p'i: ' ET. | '37'.
m .ka .". H+ "= " »; j.; %% JF"! ." ;P? .; .". :. '? m ,'h'l .. {3 _| Tlf-. ?" ". °.":" ';E'- - .| *. .';Jh 1, l, L |<'-A .'--')--r~| :. 4 , I »al 2 " z '- L. l
ä a f " " $ '$ .: "" * . r W M: i ',- L; a, G 1 '
IE; %* ! ! EC? Il| SG __| * z , EH . (å. o. I u U nu... 'En
'
% '
...-|;'å'
,...:5. 3"
.
" 1-
"-H r I .:]: A;. 2 D D-" . . r: - -.- " * _ Å- '- :; Zi" "1 E D .... '=' ...",. s: akg . .4 d - | J _; __ | . HW _ å n ': ' _ * | 5. C. _ 3 _ ' .:; . at..____.|__.___l_.! . D. 0.01. 13.2 . l{l CYCLESIH "x' .::, U' U _. D _ _ z % sansa % CART % ; A H ,; m ? ' 1 "* D å. : M : å ; '=- -5'-' _ 4",.'1_4= :| ll a., ."; .' _ #,u = JEN ! MW, ,'ulllägatug'läg Vi.-fgmig'rquwmqwmuw [p% ....
...-1 . få :; g .a... __ - L,
::
"3
q- 5
: g, ;; F. :E _£2&
U "-a än: _UF" .. "||FM".| UHä.::: .. |";. 4, _ . H I ä *; ' " [" å E:: "1. 1 %. ; I in! I! _E 'S'
E
3
f '
E f
"M
a A - än U '_' r . fl ! 7å a:r-a-w4n-MAM-m-vaéz;ataxia- m- q-v1 »¢.:ga' ~ft #MJ-'n,;yu4_¢i,e-,%g¢.q-j -¢a E 3 | .?
nu 0 H i |
:| . "; .:: , .
Ul &_ nu! & ; ml _| _| L
T 4-3!= asao *! D':' , .:' .: ,- l , å ; [ . _. ." '. g 8 | 3. ' 1 . S (" ':; ** - i = 4 -f !7"-"" "4"J L _ . | J , . 3 + .:...31 0.1 1 0.01 0.1 51 'D. 400. soo. 1200. 1500. 2000. cmmzsm ammar" I
![Figure 7a b. Vertical Q forces [kN] and lateral Y forces [kN] of two wheels of the Euro ma coach running on tangent track at a speed of 200 km/h](https://thumb-eu.123doks.com/thumbv2/5dokorg/4844157.131155/8.892.122.770.509.768/figure-vertical-forces-lateral-forces-wheels-running-tangent.webp)