SMALL SCALE ENERGY CONVERSION
OF PLASTIC WASTE
Identification of gasification process parameters through modelling in Aspen
Plus
FANNY OLOFSSON
HENRIK HALVARSSON
School of Business, Society and Engineering
Course: Degree Project in Industrial Engineering
and management with Specialization in Energy Engineering/Degree Project in Energy
Engineering
Course code: ERA402/ERA403 Credits: 30
Supervisor: Lara Carvalho Examinor: Erik Dahlquist Costumer: Re-use
Date: 2020-05-28 Email:
fon15002@student.mdh.se hhn14009@student.mdh.se
ABSTRACT
The present work investigates further development of a small-scale fixed bed batch operating gasification pilot system intended to be used as a waste-to-energy process to reduce littering of PET-bottles on Pemba Island in Tanzania. By developing a simplified gasification model and identifying the most important parameters to obtain a syngas with a lower heating value suitable for combustion and maximizing the overall efficiency and cold gas efficiency. By a literature study the most important parameters were identified along with how the
methodology for developing the model and selection of modelling software. The model was developed as an equilibrium-based model in Aspen Plus representing the pilot system, the most important parameters was identified as equivalence ratio and temperature. Multiple scenarios, regarding sensitivity analysis of these parameters was conducted to determine how the outcome of the process was affected. The model was validated against a reference study and was proven to be accurate with small variations. High content of methane and carbon monoxide promoted the highest lower heating value which was at an equivalence ratio of 0.25 and a temperature of 450℃, which also indicated the highest overall efficiency.
Increasing the temperature favoured the carbon monoxide content and the cold gas efficiency but indicated a decrease in lower heating value and overall efficiency. It was concluded that the optimal operational conditions were at an equivalence ratio at 0.25 and a temperature at 450℃. At these conditions, the formation of by-products from the gasification is higher than at higher equivalence ratios and temperature which needs to be further investigated through experimental work. It was also concluded that the system could benefit to operate in a semi-batch configuration with a higher equivalence ratio to utilize the excess heat from the process.
Keywords: Aspen Plus, Equivalence ratio, Gasification, Pilot system, Plastic waste, Polyethylene terephthalate, Small-scale, Temperature
PREFACE
The present work is a master thesis in Industrial Engineering and Management with Specialization in Energy and Energy Engineering at Mälardalens University in Västerås, written by Fanny Olofsson and Henrik Halvarsson during the spring semester 2020. The idea of the present work comes from a company called Re-use that wanted us to investigate their idea of gasification of PET, to help a village in Africa to reduce some of their plastic bottles. The purpose of this report was from the beginning to do laboratory work and later validate the result with a simple model in Aspen Plus. This report was done in the spring of 2020 when COVID-19 was spreading in the world. The equipment that we were supposed to use would be sent from China in the beginning of the year, but at the same time, the country was at lookdown, so they could not send it. The second plan was to go to KTH in Stockholm to use their gasification equipment, but then the disease came to Sweden and affected especially Stockholm, so then we could not go there. The current situation also made the Swedish universities change to distance learning and no education, examination or lab work could be conducted in the campus. Therefore, the work changed direction, and we were forced only to do the simulation.
Finally, we will send a big thank to our supervisor Lara Carvalho Postdoctoral Researcher at Mälardalens University for all the support and guidance during the report.
Västerås May 2020
CONTENT
INTRODUCTION ... 1 1.1 Background ... 1 1.2 Purpose ... 3 1.3 Objectives ... 3 1.4 Delimitation ... 3 METHOD ... 4 2.1 Selection of method ... 4 2.2 Literature study: ... 4 2.3 Modelling... 5 LITERATURE STUDY ... 6 3.1 Plastic ... 63.1.1 Problems with plastic ... 6
3.1.2 Re-use and recycling of plastic ... 6
3.1.3 Polyethylene terephthalate (PET) ... 8
3.1.3.1 PET AS A FUEL ... 8
3.2 Pyrolysis of PET ... 9
3.3 Gasification of PET ... 10
3.3.1 Syngas ... 11
3.3.2 Biochar and bioliquid... 11
3.3.3 Potential utilization ... 12
3.3.4 Gasification Agents ... 13
3.3.5 Modelling of Gasification processes ... 13
3.4 Operational parameters of Gasification ... 14
3.4.1 Temperatures influence on gasification of PET ... 14
3.4.2 Equivalence ratio ... 15
3.4.3 Reactor Configurations ... 16
3.4.4 Residence Time ... 16
4.1 Pilot system ... 18
4.2 Selection of modelling approach and software ... 19
4.3 Assumptions ... 19
4.4 Methodologies used in Aspen Plus ... 19
4.4.1 Redlich-Kwong equation of state ... 19
4.4.2 Enthalpy of nonconvention components ... 20
4.4.3 Gibbs free energy minimization ... 21
4.5 Controlled process parameters ... 22
4.6 Scenarios ... 22
4.7 Model validation ... 23
4.8 Efficiencies of the system ... 23
4.9 Analysis of the output data... 24
RESULTS ... 25
5.1 Gasification model ... 25
5.1.1 Controlled process parameters of the model ... 27
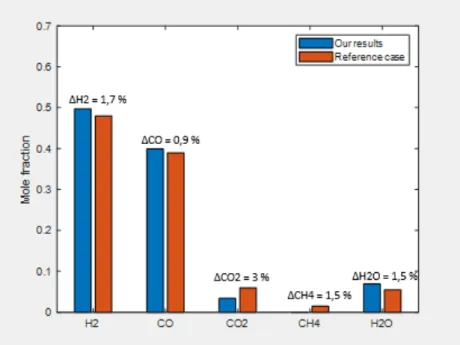
5.2 Validation of the model ... 27
5.3 Sensitivity analysis ... 28
5.3.1 Scenarios 1–4 ... 28
5.3.2 Scenario 5-8 ... 29
5.4 Cold-gas efficiency and overall efficiency ... 30
5.5 Composition ... 33
5.6 Residence time ... 34
5.7 Biochar and Bioliquid ... 34
DISCUSSION ... 35
6.1 Method discussion ... 35
6.1.1 Aspen plus ... 35
6.2 The process model ... 35
6.3 Validation of the model ... 36
6.5 Residence time ... 38
6.6 Biochar and bioliquid ... 38
CONCLUSIONS ... 40
SUGGESTIONS FOR FURTHER WORK ... 41
REFERENCES ... 42
LIST OF FIGURES
Figure 1 Illustration of the main steps of plastic gasification. ... 10
Figure 2. Weight loss of PET as a function of gasification temperature ... 15
Figure 3 Schematic representation of the pilot system inspired by Re-use. ... 18
Figure 4 Flowsheet of the developed model in Aspen Plus. ... 26
Figure 5 Model validation results... 27
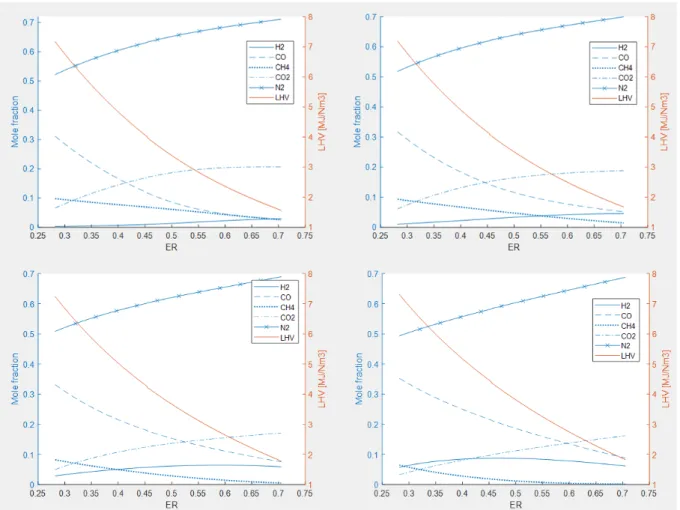
Figure 6 Product gas composition at fixed temperature with varying ER. Upper left: Temp = 723.15 K, Upper right: Temp = 773.15 K, Down left: Temp = 823.15 K, Down right: Temp = 873.15 K. ... 28
Figure 7 Product gas composition at fixed ER with varying temperature. Upper left: ER = 0.25, Upper Right: ER = 0.3, Down Left: ER = 0.35, Down Right: ER = 0.4... 29
Figure 8 Cold-gas efficiency depending on ER. ... 30
Figure 9 Cold-gas efficiency depending on temperature. ... 31
Figure 10 Net heat from the system with varying temperature. ... 31
Figure 11 Surplus of electricity from system at different ER and temperatures. ... 32
Figure 12 Overall system efficiency with varying ER. ... 32
Figure 13 Overall system efficiency with varying temperature. ... 33
LIST OF TABLES
Table 1 Proximate and ultimate analysis of fuel components ... 8Table 2 Summary from TGA experiments on PET conducted by. ... 9
Table 3 Summary of product gas components from experiments. ... 10
Table 4 Main gasification reactions ... 11
Table 5 Input parameters for simulated process scenarios. ... 22
Table 6 Description and assumptions of each respective block in Aspen Plus. ... 26
Table 7 Gasification products at different temperatures. ... 33
NOMENCLATURE
Symbol Description Unit
𝑎 Correctional constant. 𝑅2𝑇𝑐2.5 𝑝𝑐 𝑎𝑖 Correctional constant. 𝑅2𝑇𝑐2.5 𝑝𝑐 𝑏 Correctional constant. 𝑅 ∗ 𝑇𝑐 𝑝𝑐 𝑏𝑖 Correctional constant. 𝑅 ∗ 𝑇𝑐 𝑝𝑐
𝐶𝑝𝑆 Specific heat capacity of species 𝑠. 𝐽
𝑘𝑔 ∗ 𝐾
𝑓𝑖 Fugacity of substance 𝑖. 𝑃𝑎
𝑓𝑖0 Fugacity at ideal conditions. 𝑃𝑎
𝐺𝑡 Gibbs free energy. 𝐽
𝐺̅𝑖
0 Standard Gibbs free energy of
substance 𝑖. 𝐽/𝑘𝑔
𝐻𝑆 Enthalpy of species 𝑠. 𝐽/𝑘𝑔
𝛥𝐶ℎ𝑆 Heat of combustion of species 𝑠. 𝐽/𝑘𝑔
𝛥𝑓ℎ𝑆 Heat of formation of species 𝑠. 𝐽/𝑘𝑔
𝛥𝑓ℎ𝑐𝑝𝑆 Specific heat of formation of species 𝑠.
𝐽/𝑘𝑔
𝐿𝐻𝑉 Lower heating value. 𝑀𝐽/𝑘𝑔
𝑚̇ Mass flow. 𝑘𝑔 𝑠 𝑛𝑖 Mole fraction. - η Efficiency. % 𝑃 Power. 𝑘𝑊 𝑝 Pressure. 𝑃𝑎
𝑅 Universal gas constant. 𝐽
𝑚𝑜𝑙 ∗ 𝐾 𝛥𝑆𝑓,𝑖 Entropy of species 𝑖. 𝐽/𝐾 𝑇 Temperature. 𝐾 𝜇𝑖 Chemical potential. 𝐽/𝑘𝑔 𝑉𝑚 Molar volume. 𝑚3 𝑚𝑜𝑙
ABBREVIATIONS
Abbreviation Description
Atm Ambient pressure
ER Equivalence ratio
GHG Greenhouse gases
HDPE High-density polyethylene
HHV High heating value
LDPE Low-density polyethylene
LHV Low heating value
MSW Municipal solid wastes
PAH Polycyclic Aromatic Hydrocarbon
PE Polyethylene
PET Polyethylene terephthalate
PP Polypropylene
PS Polystyrene
PSW Plastic solid waste
PVC Polyvinyl chloride
TGA Thermogravimetric analysis
Wt Weight percentage
DEFINITIONS
Definition Description
Products gas The gas obtained from gasification
𝑊 Work. 𝑘𝑊
𝑥𝑖 Mass fraction of species 𝑖. -
𝑌𝑖 Mass fraction of species 𝑖. -
𝑦𝑖 Mole fraction of species 𝑖. -
Pilot system A system that was made before the present work Residue The product beside the gas that is left in the gasifier
INTRODUCTION
The United Nations has created 17 sustainable development goals for 2030, and these goals are divided into three dimensions; economic, social, and environmental (Hepp et al., 2019; Stafford-Smith et al., 2017). Goal 12 regards consumption and production to achieve a minimized impact on human health and the environment by reducing chemicals and wastes. The goal highlights that one part of the waste problem is plastic and that it is one of the primary sources of ocean pollutions. (Sustainable consumption and production, 2020). The global production of plastic has increased in the past years, from 270,000 kiloton in 2010 up to approximately 359,000 kiloton in 2018 (Global plastic production, 2020.). This increase is mainly due to plastic being a material that has turn out to be in our everyday life (Derraik, 2002; Siddique et al., 2008). Plastic is lightweight, robust, cheap and has a long life span, and these factors are behind the phenomenal growth (Derraik, 2002; Siddique et al., 2008). The material is affordable for all incomes since plastic can be produced in vast quantities at a low cost (Thunman et al., 2019). Part of the plastic is hard to replace since it is used in the production of technically advanced materials, for example, medical delivery, packing food and industrial applications (Derraik, 2002; F. Khan et al., 2019; Siddique et al., 2008; Thunman et al., 2019).
According to Nkwachukwu et al., (2013) greenhouse emissions associated with the plastic life cycle are anticipated to increase. In addition, there will also be negative consequences of littering and plastic pollution in the marine waters. The negative effect of plastic waste impacts the environment since it can last for many years, around 500-1000 years, before it totally decomposes and, it can inhibit the breakdown of biodegradable materials around. (J. R. Jambeck et al., 2015; Nkwachukwu et al., 2013). The developing countries only collect 50-80% of their waste, and the most common method is open dumping (Wilson et al., 2006). The lack of waste collection systems is the main reason for the leakage of plastic into the ecosystem. Therefore it is needed to explore opportunities to build a circular economy around the material (Thunman et al., 2019). According to I. Khan& Kabir (2020), a circular
economy is a concept that includes reducing, reusing, recycle, and recover. They describe that the first step is to reduce the waste, the second step is to reuse the product instead of
throwing it away, the recycling process in an alternative when neither reduce nor reuse can be used. The last step is to recover the material, which, for example, can be done by
transform waste to energy (I. Khan & Kabir, 2020).
1.1 Background
Current disposal methods of municipal solid wastes (MSW) are becoming an increasing concern in developing countries as the standard of living is increasing simultaneously with population growth. This growth raises the demand for sufficient recycling methods that are environmentally sustainable. (Ferronato et al., 2019, 2019; Idris et al., 2004; Imam et al., 2008; Minghua et al., 2009). Currently, the dominant method for dealing with MSW in the world is landfilling. Due to the high costs of other waste disposal alternatives landfilling is mainly employed in developing countries (Laner et al., 2012). Furthermore, landfills are
associated with groundwater contamination, a contributor to greenhouse gas emission and leachate that can lead to contamination of nearby water (Han et al., 2016; Lou & Nair, 2009; Yusof et al., 2009). Another common disposal method is incineration, which is an alternative to landfilling. However MSW contains a wide spread of materials which some, specifically plastics during incineration are known to generate carcinogenic substances as Polycyclic Aromatic Hydrocarbons (PAHs), nitro-PAHs, and dioxins, which are also highly mutagenic (H. Lee et al., 1995). Large scale Combined Heat and Power plants are applying multistage gas cleaning systems to reduce the level of these pollutants (Su et al., 2015).
In addition to incineration several studies have investigated the possibility of gasification and pyrolysis of MSW as an alternative waste-to-energy process (He, Hu, et al., 2009; Kwon et al., 2010; Tanigaki et al., 2012). Gasification is the conversion of a solid fuel to a gaseous fuel by transferring heat via a gasification medium, usually air, oxygen or steam. The gaseous fuel produced can further be applied for generation of electricity or used as chemical feedstock to produce liquid fuels (McKendry, 2002). Pyrolysis is a thermal decomposition process of organic materials at temperature between 300-700°C in the lack of oxygen. The
characteristics and yield of the products from pyrolysis and gasification are varying and depend on several process variables (Haykiri-Acma et al., 2006; Kaminsky & Zorriqueta, 2007; Shah et al., 2005; Williams & Slaney, 2007). These variables can be summarized as: fuel, type of reactor system, gas residence time, contact time, heating rate, temperature, pressure, presence of a catalyst and presence of hydrogen gas or hydrogen donor compounds. A significant part of MSW consist of plastic wastes. A study made by Onwudili et al., (2009) have shown that the most common plastics in MSW were found to be low-density
polyethylene (LDPE), high-density polyethylene (HDPE), polypropylene (PP), polystyrene (PS), polyvinyl chloride (PVC) and polyethylene terephthalate (PET). The liquid product obtained from pyrolysis and gasification of these plastics is composed of hydrocarbons, along with a solid char product. These products, similar to the product gas, have a high calorific value, and are valuable chemical raw materials, including benzene, toluene and other condensed aromatic hydrocarbons. (Demirbas, 2004; K.-H. Lee & Shin, 2007; Onwudili et al., 2009)
According to the company Re-use, Pemba Island located off the coast of Tanzania, have a large quantities of PET bottles that are consumed daily. The island has inadequate recycling of PET and rural off-grid villages where small-scale gasification is a suitable application for generation of electricity and simultaneously managing the PET waste. There is a lack of studies of a simple design of gasification systems where the subject is to utilize waste to energy processes where the primary purpose is not to convert energy. Instead, the electricity is seen as a by-product that can enhance the initiative to recycle in rural areas. The company also stated that Pemba Island have villages that lays beyond the electrical grid system, so by adding this process, it can help to both dispose plastics and supply electricity to the remote areas.
Prior to the present work, the company Re-use have developed a small-scale gasification pilot system for PET bottles that was comprised of three main components: a gasifier reactor, a gas engine connected to a generator, and a battery bank for storage of excess electricity.
Preliminary experimental tests by Re-use showed that the pilot system had several
operational problems. Therefore, further experimental work is required to develop the pilot system and overcome the difficulties encountered during the preliminary tests.
1.2 Purpose
This study aims to investigate the feasibility of a small-scale gasification system of PET-bottles using simple equipment, to be applied on Pemba Island in Tanzania and help solving the waste plastic management. Gasification parameters will be study in order to produce a syngas that can be used for electricity generation in a gas engine.
1.3 Objectives
The specific objectives of the current study are to:
• Develop a simplified model to simulate gasification of PET. • Validate the model by comparing to other studies.
• Find the most important parameters in the model for small-scale gasification to ensure a useful syngas that can be used in electricity production.
• Determine the cold-gas efficiency and the overall system’s efficiency. • Study the potential utilization of the biochar and bioliquid.
1.4 Delimitation
The present work will only look at gasification of PET bottles and will not consider any other plastic. Co-gasification with substances other than plastic will not be considered. The present work will follow the instruction form the company Re-use i.e. the gasification system should be as simple as possible.
METHOD
The upcoming part will explain the methodology for the development of the model for gasification of waste PET plastic. It will present how the selection of the method was performed, how the literature has been collected with regard to the gathering of valid
information comprising related work in the field and motivation for the modelling. As it was mention in the preface the method from the beginning were to do perform laboratorial experiments. However, given the circumstances the method used in the present work changed.
2.1 Selection of method
There are different types of process that can be used during a report. Two conventional methods are quantitative and qualitative. There are an advantage to use the two approaches together since they have different strengths. (Morgan, 2014). Quantitative research refers to either considerable sample research that relies on statistical inference or mathematical and stochastic modelling. The quantitative method approach that examine concepts in terms of amount, intensity or frequency. Qualitative research approach that considers concepts in terms of their meaning and interpretation in a specific context of inquiry. (Ketokivi & Choi, 2014).
The literature study is a combination of qualitative and quantitative method. The qualitative method is used for the data to describe the concepts of the work. While the data that describe the models to simulate gasification of PET are using a quantitative method. The data that is collected from that method will then be used in the modelling, which also using a
quantitative method.
2.2 Literature study:
A literature review with relevant scientific publications was collected to understand the subject of the present study. The literature study was collected through different databanks: Mälardalens university’s data bank, Google scholar, Scopus, and Science direct. The primary keywords used were “gasification of plastic waste/PET”, “characteristic of rest products from gasification”, “gasification in Aspen plus”, “pyrolysis of waste plastic/PET”,
“modelling in Aspen plus”. Articles that had a subject or title related to the theme were also considered. References from the studied reports that also had a connection were another way of finding more sources. To ensure the quality of the references, several sources that are about the same subject were used. To have a more reliable study, not to old reference were used, if there was information that have not changed during a long time, an older source was acceptable.
2.3 Modelling
The present work has used system modelling to simulate the gasification process and
investigate the feasibility of the system. Modelling is preferable when the output of a process is to be investigated and how the output varies with varying input parameters. There are several advantages to systems modelling, for example, it can avoid actual experiment which can saves time and money. By using system modelling instead of actual experiments, it is easier to test and change different parameters at shorter periods of time and see their effect in the process. The ability and simplicity to perform many tests are preferable according to the objectives of the present work. There are not either a large limitation on the parameters that can be tested during a time period, which it can be in an actual experiment since it takes longer time. The modelling can also easily create sensitivity analysis to evaluate the impact of certain relevant parameters in the systems efficiency and evaluate the robustness of the model.
LITERATURE STUDY
In the following part related scientific publication to the present work will be presented. Problems regarding the lifecycle and usage of plastics along with different approaches of disposal and re-use of it. Furthermore, different parameters of gasification and how they affect the process.
3.1 Plastic
Mass production of products started during the industrial revolution, and especially plastic since it was a cheap and effective raw material. The result of mass production is that plastic today is in our everyday life. (Bale, 2011). In this section, the problems regarding usage of plastics and how it can be disposed/re-used will be presented.
3.1.1 Problems with plastic
There are trillions of plastic pieces accumulating in the ocean that will remain in the environment for hundreds of years, and leading to a global pollution issue (Sebille et al., 2015). Studies have shown that the primary pathway for waste entering the ocean includes human movement and behaviour as littering and dropping. The waste that is on land can also enter the sea through the wind. The plastics has been recognized as the most noticeable pollutant affecting the ocean since it builds up seafloor and, ends up in the marine animals and sea birds (J. Jambeck et al., 2018). According to Webb et al., (2013) a problem is that the plastic ingested by the animals persists in their digestive system since they can mistake the plastic objects for food. The study has showed that it can lead to decreased feeding stimuli, gastrointestinal blockage, reduced secretion of gastric enzymes, and reduced levels of steroid hormones, leading to reproduction problems.
Plastic waste is not only serious environmental issue in developing countries but is also a major challenge in the socio-economic development that impacts the infrastructure, biodiversity, fisheries live hoods and tourism of the countries. In African countries, the densely populated residential areas provide a significant challenge to solid waste
management, especially where infrastructures are lacking. (J. Jambeck et al., 2018). Plastic waste material can degrade in the environment via four mechanisms: photodegrading, thermo oxidative degradation, hydrolytic degradation, and biodegradation by
microorganisms. However, none of these are effective mechanisms since it takes at least 50 years for the plastic to degrade. (Webb et al., 2013).
3.1.2 Re-use and recycling of plastic
Procedures to enable biological degradation of plastic are both complicated and expensive. Hence, the increase of plastics has led to a need of waste management with recycling which has become an important social issue (Park & Kim, 2014). Studies have shown that the best way to dispose plastic economically is a recycling processes (Awaja & Pavel, 2005; Yoda,
1999). However, re-using plastic is preferable to recycling as it uses less energy and fewer resources. The advantage to reuse plastics is in the conservation of fossil fuel since plastic production uses 4-8% of the global oil production (Al-Salem et al., 2009). Plastic waste can be recycled in several processes; the primary recycling method is re-extrusion which is the classical method of recycling plastic, the second method is mechanical recycling, the third process is chemical recycling, and the fourth recycling method is the energy recovery method, which involves the incineration of plastic waste (Park & Kim, 2014).
The re-extrusion and primary method involves the recycling of scrap materials to form original products, and it is often referred to as closed-loop recycling (Hopewell et al., 2009; Park & Kim, 2014). This process utilizes scrap plastics that have similar features to the original products (Al-Salem et al., 2009). A difficulty with this method is that plastic can contain various polymers and other materials such as paper and metal integrated in plastic packing material, and then it can be hard to sort the single products by them self. Although this method has advantages of simplicity and low cost, even though it is not an attractive method since it requires uncontaminated scrap with only one type of waste. (Park & Kim, 2014)
Mechanical recycling, also known as secondary recycling can be referred as downgrading (Hopewell et al., 2009). The process of recovering plastic solid waste (PSW) for the re-use in manufacturing plastic products via mechanical means. This recycling process of PSW can only be performed on single-polymers plastic, for example, PE, PP, PS, etc. This is materials that will be found in our daily life, such as grocery bags. The mechanical recycling is difficult when there is a more complex and contaminated waste. (Al-Salem et al., 2009). The
mechanical recycling process of plastic usually consists of contamination removal by sorting and washing, drying, and melt processing (Al-Salem et al., 2009; Awaja & Pavel, 2005). The processes have become an essential issue in R&D, where numerous researchers have devoted their effort. After PET have been recycled the material is then sent to produce textile and sheet products by resin melding techniques well established for PET and other plastic conversions. (Al-Salem et al., 2009).
Chemical (tertiary) recycling is applied when the polymer is depolymerized to its chemical constituents (Hopewell et al., 2009). The process which converts plastic material into smaller molecules, usually liquids or gases. Product of chemical recycling has proven to be useful as fuel. Examples of tertiary process are pyrolysis and gasification and will be presented later in the present work. (Al-Salem et al., 2009).
Incineration is classified as a quaternary recycling process that comprises energy recovery, i.e., complete or partial oxidation converts the material to thermal energy that further can be utilized to generate electricity (Al-Salem et al., 2009). The recycling process is dealing with mixed plastic waste and is a popular and adapted method. It is proven to be highly effective in terms of reducing the volume of waste; approximately 85-90% of the total amount is converted in the process. (C.-T. Li et al., 2001; McKay, 2002). Plastic incineration commonly occurs integrated as a part of MSW (M. Li et al., 2004; Tsai & Chou, 2006), where plastic is proven to be the primary source of energy due to the high calorific values of plastic materials (Murphy & McKeogh, 2004). In a review comprising recycling routes of plastic waste by
Al-Salem et al., (2009) they conclude that incineration can be employed as a method for managing plastic waste, it can be utilized to reduce the volume of plastic wastes and reduce the dependency on fossil fuels in energy conversion processes. (C.-T. Li et al., 2001).
3.1.3 Polyethylene terephthalate (PET)
Polyethylene terephthalate (PET) is the most used polymer in the world; the raw material for plastic production comes from fossil fuel which is a potential resource (Bai et al., 2020). PET is used for the production of the bottles, containers for water and other drinks (30 %), and also as a polyester in the textile industry (60%) (Anuar Sharuddin et al., 2016; Barriocanal et al., 2005; Dimitrov et al., 2013). The production of PET-bottle worldwide is increasing every year, the production in 2016, where 485 billion units, and it is expected to be 583 billion units in 2021 (Statista, 2020).
3.1.3.1 PET as a fuel
PET material possesses a very high heating value, and because of that, the plastic can make a convenient energy source. (Al-Salem et al., 2009) Bai et al., (2019) found out the PET is sensitive in the change of temperature and the fuel starts to react immediately when it is heated up. At high temperature plastic release hydrocarbons and a liquid product begins to form (Pohořelý et al., 2006). Both the gas and the liquid products are complex mixtures of hydrocarbons and other organic compounds, and the composition of these depend on the composition of the fuel.
Honus et al. (2018), stated that the two crucial parameters of a fuel that determines energy quality is its net calorific value and gross calorific value. That indicates of chemical energy accumulated in a unit of matter or volume of a given fuel. PET has a calorific value as a fuel which is 21.81 MJ/kg (European commission, 2016). In Table 1 a proximate and ultimate analysis of typical PET are presented (Pohořelý et al., 2006b).
Table 1 Proximate and ultimate analysis of PET components (Bai et al., 2020; Kannan et al., 2013; Pohořelý et al., 2006b; Tavares et al., 2018)
Components PET
Proximate analysis [wt%]
Moisture 0,13
Ash 0,08
Fixed carbon 6,4
Dry matter = Total Solids-Ash-Moisture 99,79
Volatile matter = Dry matter – Fixed Carbon 93,39
Ultimate analysis [wt%] Carbon 62,5 Oxygen 33,3 Hydrogen 4,2 Nitrogen 0 Sulphur 0
3.2 Pyrolysis of PET
Pyrolysis is a thermal degradation process in an oxygen-deficient atmosphere within a temperature range of approximately 300-700˚C. It can be applied to a variety of waste streams and subsequently produce a high calorific value gas and char (Velghe et al., 2011); hence it is classified as a tertiary recycling process. Pyrolysis provides several advantages in terms of operation advantages, environmental advantages, and finical benefits. The
operational benefits are due to the possible utilization of the char as fuel or as feedstock for petrochemical processes. The high calorific fuel is suitable for combustion and can hence be used to produce electricity and heat. Moreover, there is not sufficient understanding of the reaction pathways of pyrolysis which prevents accurate prediction of the product
distribution.(Al-Salem et al., 2009).
The thermal decomposition of polymers is commonly studied through Thermogravimetric Analysis (TGA), the principle of the method is to determine the conversion of the product during its decomposition, this is usually performed at different heating rates and residence times (Martı́n-Gullón et al., 2001; Saha et al., 2006). The total weight loss from PET
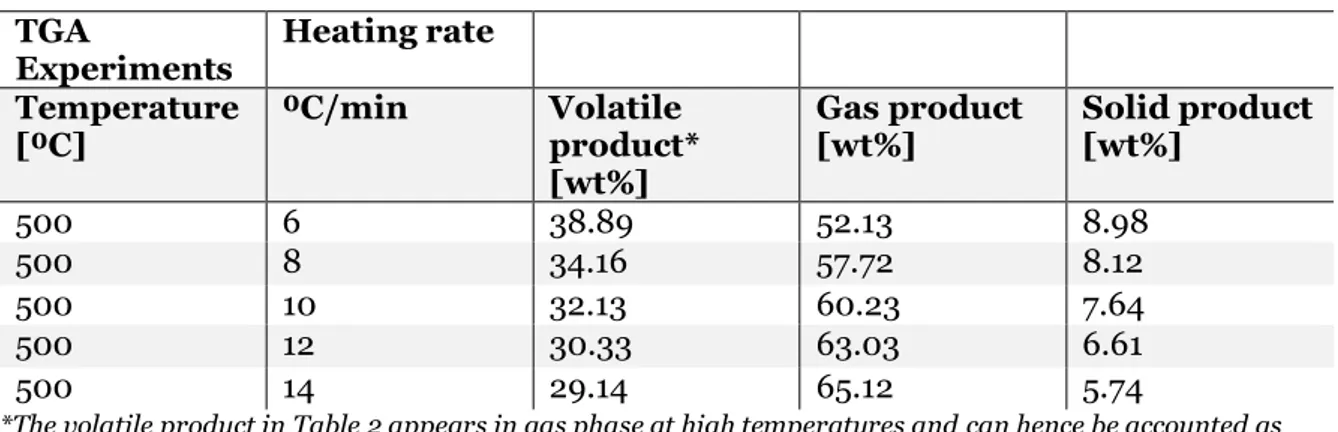
decomposition determined by FakhrHoseini & Dastanian, (2013) at different heating rates is presented in Table 2.
Table 2 Summary from TGA experiments on PET conducted by (FakhrHoseini & Dastanian, 2013). TGA
Experiments Heating rate Temperature
[⁰C] ⁰C/min Volatile product*
[wt%] Gas product [wt%] Solid product [wt%] 500 6 38.89 52.13 8.98 500 8 34.16 57.72 8.12 500 10 32.13 60.23 7.64 500 12 30.33 63.03 6.61 500 14 29.14 65.12 5.74
*The volatile product in Table 2 appears in gas phase at high temperatures and can hence be accounted as gaseous product as well.
Slower heating is correlated with longer residence times and subsequently enhancements of char formation (solid product). Similarly, the amount of the volatile product is favoured at lower heating rates and contrary to the production of gas, increases with increased heating rate. (Anuar Sharuddin et al., 2016). According to the study by Lee & Shin, (2007), the operational time for also influences the cumulative yield of volatile products i.e., longer residence times lead to higher yields. However, the study concluded that the residence time had little effect on the yield if the operation temperature was below 400⁰C for waste plastic mixtures. The composition of the main products in the gas from pyrolysis of PET, identified by Yoshioka et al., (2004a) are presented in Table 3. The data is an identification of which substances that are present after pyrolysis of PET, this is further used in the process model.
Table 3 Summary of product gas components from experiments (Yoshioka et al., 2004b). Temperature 510◦C 630◦C [wt%] [wt%] CO2 13 17 CO 23 18 Hydrogen 0.09 0.13 Methane 0.87 1.9 C2-aliphatics 1.5 0.92 C3-aliphatics 0.71 0.12 C4-aliphatics 0.39 0.29 Benzene 0.58 1.6 Benzoic acid 21 16 NaOH-soluble components 24 13
Minor and unidentified
components. 12.86 31.04
3.3 Gasification of PET
Similar to pyrolysis, gasification is a thermochemical technology, where fuel or combustible gases can be produced from waste streams (Tanigaki et al., 2012). The process generally occurs at higher temperature 550 - 900⁰C in air and up to 1600 ⁰C if pure oxygen or steam is used. (Dong et al., 2018). The process of gasification occurs in several complex steps, and it can be summarized in the following mechanisms: drying, pyrolysis, cracking and reforming reactions in the gas phase, and heterogeneous char gasification. These steps are illustrated in Figure 1. The moisture content of plastics is significantly lower than for other feedstocks commonly gasified hence the drying process plays a negligible role in the process. (Lopez et al., 2018).
Figure 1 Illustration of the main steps of plastic gasification. Figure based on (Lopez et al., 2018) The products from the pyrolysis step, mainly char and volatiles continue to react in the gasification step. After pyrolysis two types of reactions occur oxidation and reduction reactions. The oxidation reactions comprise combustion of char and volatiles, along with oxygen these set of reactions produce steam, CO2 and CO. The reactions are exothermic;
reduction reactions include char, tar and hydrocarbons that are gasified with the generated CO2 and steam to produce syngas. These reactions are mainly endothermic and consume part
of the heat generated by the oxidation reactions. (Mahinpey & Gomez, 2016). These reactions, among other common reactions of PET gasification, are listed in Table 4. Table 4 Main gasification reactions (Mahinpey & Gomez, 2016).
Gasification Reactions Heat of Reaction*[kJ mol-1] Type
C + ½ O2 CO -112 Char partial combustion
C + O2 CO2 -111 Char combustion
CO + ½ O2 CO2 -283 Volatiles
H2 + ½ O2 H2O -248 Volatiles
C + H2O CO + H2 136 Primary Water-Gas reaction
CO + H2O CO + H2 -35 Water gas-shift reaction
CH4 + H2O CO + 3H2 206 Steam Reforming Reaction
C + CO2 2CO 171 Boudouard Reaction
C + 2H2 CH4 -74.8 Methanation Reaction
3.3.1 Syngas of PET
PET plastic is producing a large amount of gases (syngas) in comparison to other polyolefin plastic (Anuar Sharuddin et al., 2016). In a study made by Çepelioğullar & Pütün, (2013) they discover that the amount of gas produced in pyrolysis of PET which is much higher than the liquid yield at 500°C. PET requires less energy to convert into other chemical structures compared to other polyolefin plastics, thus more gas is produced in the process (Anuar Sharuddin et al., 2016).
Main gaseous components from gasification of waste plastics are H2, CO, CO2, CH4 and small
quantities of low molecular hydrocarbon such as C2H4 and C2H6 (He, Xiao, et al., 2009; Lopez
et al., 2018). The gas that comes out of the process can be used for different application depending on the purpose. The gas has a lower heating value and can be used for fuel production or electricity generation (Molino et al., 2016). For PET, the lower heating value (LHV) in gasification is around 9,2 MJ/Nm3 (Kannan et al., 2013; Tavares et al., 2018). The
power generation can be produced in an engine or turbine by the syngas (Sansaniwal et al., 2017). According to Saad & Williams, (2017) and He, Xiao, et al., (2009) a useful syngas has a composition of hydrogen and carbon monoxide (H2 + CO). Higher operational temperature
lead to higher amount syngas produced (Brems et al., 2011; He, Xiao, et al., 2009). PET has a molecular structure that contains oxygen, thus it generates a high amount of CO in the gases (Honus et al., 2018). By using the syngas (gaseous fuel) instead of regular fossil fuel in an engine or turbine, some emissions can be reduced since there are no oxides of sulphur or NOx; the main content of the flue gases is CO2 (Sahoo et al., 2012).
3.3.2 Biochar and bioliquid from PET
Beside syngas, char (solid) and tar (liquid oil) are produced during gasification. To get the useful end product, it is important to take into account the critical parameters of the
gasification, which is temperature, type of reactor, pressure, heating rate and residence time. (Anuar Sharuddin et al., 2016).
The char is formed during the pyrolysis step of the process output (Castaldi, 2018). Char, which is the solid material, has a strong influence on the process since the step is slowest. According to Ponzio et al., (2006), char is formed through a heterogeneous and
homogeneous reaction that are involving the formed species and the oxidizing media, air or steam. The study also stated that apart from the enhance of polymer decomposition and gas-phase cracking, high reaction temperature, endothermic gasification reaction involving steam, CO2 and high heating rate creates a char which is more reactive in these reactions. To
maximize the production of char, a slow heating rate at very low temperatures and long residence time in the process is optimal. (Anuar Sharuddin et al., 2016). Gil et al. (2010) stated that another key parameter is to design a reactor where it is easy to have a good knowledge of the char reactivity and its variation.
Tar is the thick, black, high viscous liquid that condenses in the low-temperature zones of a gasifier. The tar consists of heavy hydrocarbon that is volatile at the operating temperature of the gasification reaction; the material emerges at temperatures as high as 400°C (Castaldi, 2018). According to You et al., (2018) the content can be classified into primary, secondary and tertiary tar depending on the reaction, temperature and composition. The primary tar decomposes into small gaseous molecules under the effect of the gasification agent, while the rest of the primary tar transformed into secondary tar (You et al., 2018). There is a different operating parameter that influence tar formation and conversion include reactor
temperature, reactor pressure, gasification medium, equivalence ratio and residence time. The ratio of fuel to gasification medium is an important parameter that influences the
product of gasification, including tar. The yield of tar in steam gasification is greater than that in steam-oxygen gasification. But from these four mediums, air gasification is the lowest tar producer. (Basu, 2013). The tar material can lead to clogging the passage and leading to system disruption. Since of this, it needs to be cleaned and that according to both Devi et al. (2003) and Arena et al. (2009) the tar removal technologies can broadly be divided into two approaches; treatment inside the gasifier (primary methods) and hot gas cleaning after the gasifier (secondary method).
3.3.2.1 Potential utilization
Both liquid oil and char have been investigated to show their possible utilization as an energy source. The liquid oils contain a large number of carbon chains with different fractions. The oil can be used as transport fuel as it contains a high percentage of aromatic hydrocarbon but requires prior upgrading and blending with conventional. By combining the liquid oil with diesel at a ratio with 20 and 40%, an engine can be run successfully. This combination is also a promising way to generate electricity. (Miandad et al., 2017)
Previous studies have shown that biochar can have an impact on soil degradation. By applicated biochar in the soil, it can increase crop yield and enhance pesticide degradation. Biochar can increase the soil pH due to the pH of the biochar itself. The change of soil pH caused by biochar application can significantly affect the activity of native microorganisms.
In addition, after biochar addition, the enhanced sorption of a pesticide can lead to a reduction in its concentration in the soil solution, thus decreasing pesticide bioavailability and biodegrading. (Ding et al., 2017; Lehmann et al., 2003)
3.4 Gasification Agents
González et al., (2008) investigated the difference of using air and steam in the gasification process, and Lv et al. (2007) have looked into gasification with air and oxygen/steam. Both studies concluded that gasification with steam resulted in a higher amount of hydrogen production compared to air gasification. On the other hand, Lv et al. (2007) state that the amount of CO increased in the oxygen/steam production, which resulted in a decrease of H2/CO ratio compared to air gasification. The study also concluded that higher ER values
promotes the oxidization reactions. These reactions will lead to more heat release, and when the temperature rises, the rate of reductions accelerate, which consume more energy (Lv et al., 2007). An advantage of using air instead of steam is that it can be more convenient for industrial applications because it is available and free (González et al., 2008).
Depending on which intermedia the gasification process has the heating value will diverge. The high heating value will be higher if oxygen is used compared to air (Kannan et al., 2013). Steam gasification also promotes a higher heating value of the product gas than air
gasification since it allows for producing an N2 free syngas (Lopez et al., 2018). The lower
heating value are also depending on the gasification agent, more air will lead to more CO which increase the LHV. On the other have the LHV decrease when the temperature increase since the amount of methane content then decrease and methane have a high depending on the LHV. (He, Xiao, et al., 2009).
3.5 Modelling of Gasification processes
Research conducted regarding modelling of gasification processes has been studied extensively. Studies conducted by Adeyemi & Janajreh, (2015); Al Amoodi et al., (2013); Kannan et al., (2013); Tavares et al., (2018) all uses the simulation software Aspen Plus. Aspen Plus is a steady state chemical process simulator, that contains built-in unit operation blocks and different physical property methods. The software comes with an extensive physical property library that is used for calculations. It calculates processes module by module and determines the properties of each outlet based the properties of the inlet streams. (Han et al., 2017).
The approach of modelling gasification by the above mentioned studies differs, Adeyemi & Janajreh, (2015) created a kinetic based model, whilst Al Amoodi et al., (2013); Kannan et al., (2013) and Tavares et al., (2018) created equilibrium based models. Kinetic based models require information regarding the major physical and chemical process that occur during the gasification process, Lopez et al., (2018) stated that these steps involved a series of complex chemical reactions hence making the kinetic approach more complex. Moreover, the
equilibrium-based approach is more simplistic, as it is assumed that all reactions occurring has reached equilibrium and only the equilibrium products are considered (Al Amoodi et al., 2013).
Tavares et al. (2018) created their equilibrium-based model in Aspen Plus in the following steps: drying of the feedstock, decomposition (pyrolysis), gasification and separation. The drying process was based on data from proximate analysis of the feedstock; the water content of the fuel was separated from the stream at this step. Further, in the decomposition step, the yield of products was calculated using an integrated calculator block in Aspen Plus. The products from the pyrolysis plus a stream of oxygen were subsequently gasified, and the products were calculated based on the principle of Gibbs free energy minimization. The model was validated using experimental results from a study conducted by Kim et al., (2011) and was proven to be sufficient. The principle of Gibbs free energy minimization is utilized by all the above-mentioned studies for equilibrium models in Aspen Plus.
3.6 Operational parameters of Gasification
Gasification can be operated in various configurations and methods, e.g. different reactors, temperatures, gasification agents and with different feedstock. The product outcome of the process is highly dependent on these variables; hence the operational parameters are chosen concerning the desired outcome. In this section, studies performed on the operational parameters related to the present work and how they affect the outcome of the gasification process are investigated.
3.6.1 Temperatures influence on gasification of PET
The product gas yield and composition that is generated from gasification is highly
dependent on the composition of the fuel, temperature, equivalence ratio, gasification-agent, residence time and presence of a catalyst (Kannan et al., 2013; Kim et al., 2011; Miandad et al., 2016; Pinto et al., 1999, p. 1). In terms of temperature and at which temperature the decomposition of PET starts, a study by Brems et al., (2011) performed thermogravimetric analysis (TGA) and found that the material began to decompose within the range of 380-470°C. Furthermore, this is confirmed in a study by Martín-Gullón et al. (2001). The conversion of fuel to gaseous products are as mentioned above, dependent on temperature. According to Emami Taba et al., (2012) temperature is the most significant variable in terms of gas composition and carbon conversion, hence the yield of CO, CO2 and CH4 in the product
gas. Simultaneously as the rate of carbon conversion increases with temperature, the yield of CO2 is the product gas decreases due to an increase of endothermic reactions, e.g. the
Boudouard Reaction which increases in rate with temperature (Emami Taba et al., 2012). With thermal degradation of PET comes emissions of toxic substances, the yield of these substances has been proven to be strongly dependent on the temperature at which
degradation occurs. In a study by Dzie¸cioł & Trzeszczyn´ski, (1998) small samples of PET was thermally degraded at different temperatures in isothermal conditions with a residence
time of 20 minutes. The study concluded that at lower temperatures 300-500°C the main degradation products are acetaldehyde, formaldehyde and carbon monoxide. Further, the yield of carbon monoxide continued to increase with temperature while the yield of
acetaldehyde and formaldehyde started to decrease at temperatures above 500°C. Between 500-700°C, a steady increase in Benzene, C1-C4 aliphatic hydrocarbons and methyl acetate
was most significant. (Çit et al., 2010; Dzie¸cioł & Trzeszczyn´ski, 1998)
The temperatures effect on the total conversion of solid fuel to a gaseous product is proven to be vital. However, a higher gasifying temperature is directly proportional to an increase in energy that needs to be supplied to the system. Whether the gain in a gaseous product is greater than the additional energy supplied determines the value of an increased
temperature. As mentioned above, an increased temperature also leads to an increase in an endothermic reaction. Thus, the sole heating of the reactor is not sufficient when determining the additional energy supply; the net energy utilized in the endothermic and exothermic reactions needs to be accounted for as well. (Lucas et al., 2004). However higher gasification temperatures are related to higher gas yields and higher calorific values along with a higher conversion of solid fuel to a gaseous product represented by Figure 2 (Dzie¸cioł &
Trzeszczyn´ski, 1998; Ponzio et al., 2006).
Figure 2. Weight loss of PET as a function of gasification temperature. (Dzie¸cioł & Trzeszczyn´ski, 1998)
3.6.2 Equivalence ratio
Equivalence ratio (ER) is defined as the ratio of the fuel to air ratio to the stoichiometric fuel to air ratio. Stoichiometric combustion occurs when all the oxygen is consumed in the
reaction, and there is no molecular oxygen in the products. The combustion is stoichiometric when ER is equal to one. In gasification the value is typically between 0,2 and 0,4. If the ER is lower than one, the combustion is rich with incomplete combustion, and if it is higher than one, the combustion is lean with excess. (James G, 2011). It is also known that lower ER values promote incomplete combustion while ER value higher than 0,7 lead to the excessive formation of combustion products. The lower ER value can lead to an incomplete combustion and more tar will be produced. (Tavares et al., 2018).
3.6.3 Reactor Configurations
The process can be operated in different reactor configurations, most commonly fluidized bed and fixed bed gasifiers (Anuar Sharuddin et al., 2016). A gasification process is a very expensive equipment to build. Fixed bed reactors used in gasification has a simple design and operation, hence also a limited investment cost. However, they face challenges in terms of scaling parameters, continuous operation and reduced heat transfer rate and limit gas-solid contact. (Lopez et al., 2018). Mondal et al. (2011) present that a fixed bed involves a bed of fuel that is maintained at a constant depth by the addition of fuel from the top of the gasifier and fixed bed gasifier has a stationary reaction zone typically supported by a grate. The fixed bed is generally fed from the top and is preheated, dried, pyrolyzed, gasifier and combusted while the fuel moves towards the bottom of the gasifier. According to the review of Anuar Sharuddin et al., (2016), a fixed bed also can be a batch reactor. That type of reactor is a closed system with no inflow or outflow of reactant or products while the reaction is being carried out. One advantage with this type of reactor is that high conversion can be achieved by leaving the reactants in the reactor for an extended time. The study stated that the disadvantaged is that it is the difficulty of large-scale production. The fixed bed requires maximum residence time and produces maximum CO2 content in the syngas, and this makes
the equipment less suitable for the production of hydrogen and chemicals (Mondal et al., 2011).
The advantage of a fixed bed gasifier it that the equipment is a simple and inexpensive process, and it has a high thermal efficiency. The disadvantages are that it has a large tar production, limited to scale up capacity and small feed size. (McKendry, 2002b). Fluidised bed reactors provide several advantages comprising operational conditions due to proper temperature distribution in the bed region and excellent mixing of gas and solids (Xiao et al., 2007). McKendry (2002) report that a fluidised bed is an advantage over fixed bed gasifiers since its distribution the temperature in the gasification zone. The consistency of the
temperature in the bed is achieved by fluidising the bed material together with air and then ensure that intimate mixing of the hotbed material, the hot combustion gas and the fuel. There are two main types of fluidised bed gasifier; circulating fluidised bed and bubbling bed (McKendry, 2002; Xiao et al., 2007). McKendy (2002a) also stated that the advantage of a fluidised bed is flexible feed rate and composition, high CH4 in production gas and easy
temperature control. The disadvantage is high product gas temperature, high tar and fines content in gas and possibility of high C content in fly ash.
3.6.4 Residence Time
According to Ling et al. (2016), the significant factor to reach a clean syngas is the residence time. The authors point out that the residence time together with a high heating value needs to be optimized together to have the optimal syngas. Residence time refer to the length of time for which an experiment was held at a particular temperature (Onwudili et al., 2009b). Mondal et al. (2011) present a different type of gasifier and normal conditions. The fixed bed in the report is similar to the present work where the syngas is leaving the gasifier with 400-500°C at a pressure 0,15-2,45MPa, and then the residence time is 15-30min. The ambition of gasification is to have a full conversion of the fuel and with an optimal residence time that
can be possible (Agu et al., 2019). Ling et al. (2016) present that a longer residence time is a central parameter for hydrodynamic characteristics of the reactor, such as length minimum fluidization velocity. By an increase of reactor length, longer residence time is required to complete conversion of char and tar. The heating rate and residence time have a significant influence on the carbon conversion efficient probably due to a considerable increase in the rate of char (Ling et al., 2016).
A clean syngas implicates a high yield of hydrogen in the gas, and when the hydrogen increases the gasification efficiency also increase (Ling et al., 2016). Singh and Rui (2016) have studied the temperature and the residence time where they stated at a lower
temperature a high residence time is obtained as slow reaction proceeds proving high
cracking time to form low molecular hydrocarbons as the primary product. The study showed that a rapid product formation does not allow more cracking inside the reactor resulting in heavy hydrocarbon and low hydrogen formation. High process temperature ensures rapid recovery of gases in less time interval as compared to a low-temperature process which ensures a high percentage of lighter hydrocarbons which increase the volume and pressure (Singh & Ruj, 2016).
CURRENT STUDY
In this chapter the methodology used in the present work is presented. It includes a
description of the pilot system (developed by Re-use), a motivation for the choice of software to perform the simulations, the assumption made and the validation of the model.
Furthermore, the equations and methodologies applied in the simulations are presented.
4.1 Pilot system
Prior to the present work, a pilot gasification system was built that comprised the following components: an electrical heater adjacent to an isolated reactor and an internal combustion (IC) gas engine that is connected to a generator. The reactor was equipped with temperature sensors that gives output to a proportional-integral-derivative (PID) controller that controls the power supplied by the heater and maintain a desired operation temperature. A schematic of the pilot system is illustrated in Figure 3. The reactor is designed for batch operation hence it is loaded with PET between each operation. Due to the simplicity of the system no air is supplied to the reactor during operation and gasification occurs with the air present in the reactor at the start of operation. The pilot system is intended to be self-sustained, utilizing batteries to store the generated electricity and to supply power to the electrical heater to start an additional batch of fuel.
4.2 Selection of modelling approach and software
From the conducted literature study on previous work regarding development of gasification models it was determined that most convenient approach for the present work is to develop an equilibrium model due to its simplicity. Aspen Plus was chosen since it is the most robust software to develop the equilibrium-based model, due to its library that consists of blocks that perform equilibrium calculations. Furthermore, Aspen Plus also includes pre-built blocks that can be used to simulate other components of the pilot system, such as the heater and the gas engine.
4.3 Assumptions
The overall assumptions made in the development of the model were:
(1) All chemical reactions were assumed to reach equilibrium in the gasification block. (2) The solid rest product, char, was assumed to be composed of carbon and ash.
(3) The products assumed to be present after the gasification block were: Hydrogen (H2),
Carbon monoxide (CO), Methane (CH4), Nitrogen (N2), Oxygen (O2), Water (H2O),
Carbon Dioxide (CO2), Ethane (C2H6), Ethylene (C2H4) and Butane (C4H10).
(4) Tars and heavy hydrocarbons components not mentioned in the above points would not be formed under equilibrium conditions.
(5) Perfect mixing of product gas and air.
(6) Efficiencies of certain components of the system are approximations.
4.4 Methodologies used in Aspen Plus
Aspen Plus provides several options regarding property calculations and modelling of chemical processes, in this section the general approach of the methodologies selected to be applied in the process model will be presented.
4.4.1 Redlich-Kwong equation of state
The method used in Aspen Plus to calculate thermo-physical properties of the components was the Redlich-Kwong equation of state. This method applies globally in the model to all the components. It was chosen based on previous work conducted by Al Amoodi et al., (2013).
𝑝 = 𝑅𝑇 𝑉𝑚− 𝑏 − 𝑎/𝑇 0.5 𝑉𝑚∗ (𝑉𝑚+ 𝑏) Equation 1
Equation 1 represents the Redlich-Kwong equation where 𝑝 is the gas pressure, 𝑅 is the gas constant, 𝑇 is the temperature and 𝑉𝑚 is the molar volume. 𝑎 ,𝑏 are correctional constants that are dependent on the critical pressure and temperature that are defined by Equation 4 and Equation 5 where 𝑇𝑐,𝑖 is the critical temperature, 𝑝𝑐,𝑖 is the critical pressure and 𝑥𝑖 is the fraction. 𝑎𝑖 = 0.42748023𝑅2𝑇𝑐,𝑖2.5 𝑝𝑐,𝑖 Equation 2 𝑏𝑖 = 0.08664035𝑅𝑇𝑐,𝑖 𝑝𝑐,𝑖 Equation 3 √𝑎 = ∑ 𝑥𝑖√𝑎𝑖 𝑖 Equation 4 𝑏 = ∑ 𝑥𝑖𝑏𝑖 𝑖 Equation 5
4.4.2 Enthalpy of nonconvention components
Moreover, the PET is defined as a nonconventional fuel in the simulation before it is decomposed. This implies that the molecular structure and thus the thermo physical properties is unknown, but the composition of the fuel is known and used as input to the model. However, the enthalpy of the nonconventional PET is still included in enthalpy balances in the model to further be able to determine energy balances of the process. Aspen calculates the enthalpy of nonconventional components from Equation 7, where the reference temperature is set to 298.15 K. For this simulation the molecular structure of the PET is unknown hence, the heat of formation 𝛥𝑓ℎ𝑆 is calculated from the heat of combustion (𝛥𝐶ℎ𝑆) since the combustion products and elemental composition of the components are known, 𝛥𝑓ℎ𝑐𝑝𝑆 is the sum of the heats of formation of the components multiplied by the mass fraction of each element respectively.
𝛥𝑓ℎ𝑆= 𝛥𝐶ℎ𝑆+ 𝛥𝑓ℎ𝑐𝑝𝑆 Equation 6 𝐻𝑆= 𝛥 𝑓ℎ𝑆+ ∫ 𝐶𝑝𝑆 𝑑𝑇 𝑇 𝑇𝑟𝑒𝑓 Equation 7
4.4.3 Gibbs free energy minimization
The methodology that is applied by Aspen Plus to determine the fractions of products from the gasification is the minimization of Gibbs free energy. This methodology implies that the chemical reactions occurring in the process does not have to be known in order to determine the solution. Instead it is based on the equilibrium state of a mixture of elements. The general expression for the Gibbs free energy is defined according to Equation 8.
𝐺𝑡= ∑ 𝑛𝑖𝜇𝑖 𝑁
𝑖=1
Equation 8
Where 𝐺𝑡 is the Gibbs free energy, 𝑛
𝑖 is the number of moles and 𝜇𝑖 is the chemical potential of species 𝑖. Further μ is defined by Equation 9.
𝜇𝑖 = 𝐺̅𝑖 0
+ 𝑅𝑇𝑙𝑛 (𝑓𝑖 𝑓𝑖0)
Equation 9
Where R and T are the universal gas constant and temperature, while 𝑓𝑖 and 𝑓𝑖0 represent the fugacity of the substance and the fugacity at ideal condition. However, if the gas is assumed to behave as an ideal gas, the fugacity and pressure are the same simplifying the expression for the chemical potential to Equation 10.
𝜇𝑖 = 𝛥𝐺̅𝑓,𝑖 0
+ 𝑅𝑇𝑙𝑛(𝑦𝑖) Equation 10
Where 𝑦𝑖 is the mole fraction of species in the substance. 𝛥𝐺̅𝑓,𝑖 0
is the standard Gibbs free energy formation of the substance 𝑖. The standard Gibbs free energy formation for a species is dependent on its temperature, enthalpy and entropy and is calculated from Equation 11. Furthermore, substituting Equation 9 into Equation 8, Equation 12 is obtained.
𝛥𝐺̅𝑓,𝑖 0 = 𝛥𝐻𝑓,𝑖− 𝑇𝛥𝑆𝑓,𝑖 Equation 11 𝐺𝑡 = ∑ 𝑛𝑖 𝑁 𝑖=1 ∗ 𝛥𝐺̅𝑓,𝑖 0 + ∑ 𝑛𝑖 𝑁 𝑖=1 ∗ 𝑅𝑇𝑙𝑛(𝑦𝑖) Equation 12
From this point, the method is to determine the values of 𝑛𝑖 which minimizes the objective, 𝐺𝑡. The fraction of each species 𝑛
species are in equilibrium, i.e. reactions between the species approach zero at constant pressure and temperature.
4.5 Controlled process parameters
The gasification parameters that have been investigated in the study are temperature, ER, reactor configurations and residence time. From the literature study it has been found that that temperature and ER are the parameters that mostly affect the outcome of the product gas. To determine how the gas composition varies depending on these variables, sensitivity analyses was done by varying the ER and temperature. The ER is calculated according to Equation 13.
𝐸𝑅 = 𝐴𝑐𝑡𝑢𝑎𝑙 𝑎𝑖𝑟 𝑓𝑢𝑒𝑙 𝑟𝑎𝑡𝑖𝑜 𝑆𝑡𝑜𝑖𝑐ℎ𝑖𝑜𝑚𝑒𝑡𝑟𝑖𝑐 𝑎𝑖𝑟 𝑓𝑢𝑒𝑙 𝑟𝑎𝑡𝑖𝑜
Equation 13
4.6 Scenarios
To analyse the controlled process parameters a number of operational scenarios was chosen to be simulated in the model for the sensitivity analyses, these scenarios are listed in Table 5 below. Scenario 1-4 corresponds to a fixed temperature but with varying ER and contrary scenario 5-8 corresponds to a fixed ER but with a varying temperature. The ER variation and interval were chosen according to the interval that the literature had. While, the interval of the temperature was used according to the company Re-use, that the equipment cannot have to high temperature. Every scenario has the same mass flow of PET, this mass flow was chosen based on the capacity of the pilot system.
Table 5 Input parameters for simulated process scenarios. Scenario number Gasification
temperature [K] ER Mass flow of PET [kg/hr]
1 723.15 0.28-0.7 5 2 773.15 0.28-0.7 5 3 823.15 0.28-0.7 5 4 873.15 0.28-0.7 5 5 723.15-1123.15 0.25 5 6 723.15-1123.15 0.30 5 7 723.15-1123.15 0.35 5 8 723.15-1123.15 0.40 5
4.7 Model validation
The results from Kannan et al., (2013) were used as reference to validate the gasification process of the model. It was chosen based on the similarities to the present work. The reference study made the following assumptions:
• All the chemical reactions reach chemical equilibrium within the gasifier. • Primary components of char are only carbon ash.
• Tars and other heavy hydrocarbon are assumed to form only under non-equilibrium. • Using Aspen Plus and the gasification step are built with two steps.
In the reference study the authors evaluated experimentally six cases with either mixed PE or PET and case six have 100% PET. The case with 100% PET was the one used to validate the gasification process. Through the validation, input from by Kannan et al., (2013) were used in the model of the present work. The input parameters regarded the flow of PET and steam along with gasification temperature.
4.8 Efficiencies of the system
To measurement the efficiency of converting PET to product gas, the cold gas efficiency (CGE) was calculated for every scenario. CGE is a measurement of how energetically dens the product gas is compared to the material that the gas was generated from, and it can be
calculated from Equation 15. (He, Xiao, et al., 2009). However, the LHV of the product gas was determined first according to Equation 14, where Y is the mass fraction of the species in the gas and 𝜌𝑛,𝑔𝑎𝑠 is the normalized density of the product gas at atmospheric pressure and 25℃. 𝐿𝐻𝑉𝑔𝑎𝑠 [ 𝑀𝐽 𝑚𝑛3 ] = (121.60 ∗ 𝑌𝐻2+ 10.10 ∗ 𝑌𝐶𝑂+ 50.57 ∗ 𝑌𝐶𝐻4) ∗ 𝜌𝑛,𝑔𝑎𝑠 Equation 14 𝐶𝑜𝑙𝑑 𝑔𝑎𝑠 𝑒𝑓𝑓𝑖𝑐𝑖𝑒𝑛𝑐𝑦 (𝜂𝐶𝐺) [%] = 𝐿𝐻𝑉𝑔𝑎𝑠 𝜌𝑛,𝑔𝑎𝑠 ∗ 𝑚̇𝑔𝑎𝑠 𝐿𝐻𝑉𝑃𝐸𝑇∗ 𝑚̇𝑃𝐸𝑇 ∗ 100 Equation 15
The conversion of PET to electricity is an important parameter regarding this system, since it was intended to utilize the generated electricity to start another batch of PET and still give a surplus of electricity. This efficiency was determined for every step of the simulation
according to Equation 16. Where the output energy is defined as the net work produced multiplied by the conversion efficiency of a generator set to 95 %, divided by the input energy to the system, which is the mass flow of PET times the LHV. Moreover, the numerator of Equation 16 indicates how much surplus of electricity that is generated from the process,
which is an indicator of how much load the system would be able to supply and still be able restart the process with another batch of fuel.
𝜂𝑐𝑜𝑛𝑣𝑒𝑟𝑠𝑖𝑜𝑛 [%] =
(𝑊𝑛𝑒𝑡∗ 𝜂𝑔𝑒𝑛𝑒𝑟𝑎𝑡𝑜𝑟) − 𝑃ℎ𝑒𝑎𝑡𝑒𝑟 𝑚̇𝑃𝐸𝑇∗ 𝐿𝐻𝑉𝑃𝐸𝑇 ∗ 100
Equation 16
The electricity surplus from the system was also evaluated for each scenario along with the surplus of heat that was generated from process. The surplus of heat is determined as the net heat from the decomposition that occurs in the pyrolysis step and the gasification. The decomposition reactions are endothermic thus it requires more heat than the sole heating of the PET to occur. However, the gasification process is exothermic giving a surplus of heat from the reactions. This net heat generated by the pyrolysis and gasification is extracted from Aspen Plus and is based on enthalpy balances over respective block.
4.9 Analysis of the output data
All of the investigated output parameters: product gas composition, LHV, CGE, electricity surplus, and heat surplus were extracted from the simulation scenarios. How the varying process parameters, ER and temperature affected the output was then analysed. Which components of the gas that favoured the highest LHV and at which temperature/ER that were the optimal conditions, and then comparing that condition to the calculated conversion efficiency, CGE, electricity and heat surplus. To determine within which temperature and ER range the system would be most viable to operate in.
RESULTS
In the following section the results from the present work are presented. The developed model along with the sensitivity analysis and how the varying variables affect the syngas composition, efficiency, heat surplus, and electricity surplus are presented.
5.1 Gasification model
The flowsheet of the develop process model in Aspen Plus is presented in Figure 4. The model was divided into three major steps, each modelled individually using separate blocks:
pyrolysis (PYRO), gasification (GASIFI), and combustion (COMBUST). The PET was heated up to the gasification temperatureprior to enter into the pyrolysis reactor to be decomposed into conventional elements: carbon, hydrogen, water, oxygen and ashes using a built in Fortan calculator block (DECOMPCALCULTOR) based on the ultimate analysis of PET (present in Table 1). As the PET ash does not participate in any chemical reactions, it was then separated from the other elements. The second block represent the gasification reactor. The RGibbs reactor was used to simulate the gasification as it utilizes the principle of
minimizing the Gibbs Free Energy and calculates the equilibrium state of the reactants and products at a specific temperature, pressure and heat duty of the present substances. It was also in this reactor step where the conventional components of the fuel reacted with the gasification agent, in this case air. Thus, air was supplied to this block along with the decomposed PET. It is assumed that the residence time in the gasification reactor is long enough for the process to reach equilibrium.
After these blocks the composition of the syngas from the gasification process was
determined. Aspen Plus does not include pre-built blocks to simulate internal combustion engines. Hence the modelling of the combustion section was divided into four steps that represents the cylinder where the combustion occurs and the crankshaft that produces mechanical work, which are represented by 1. mixer, 2. compressor, 3. combustion reactor and 4. turbine. The syngas was first mixed with ambient air to be further compressed and combusted in a piston gas engine. The combustion is modelled using a RGibbs reactor where complete combustion simulated. The mechanical work produced by the engine is then modelled using a turbine where the gases expand to ambient pressure.
![Table 3 Summary of product gas components from experiments (Yoshioka et al., 2004b). Temperature 510◦C 630◦C [wt%] [wt%] CO 2 13 17 CO 23 18 Hydrogen 0.09 0.13 Methane 0.87 1.9 C 2 -aliphatics 1.5 0.92 C 3 -aliphatics 0.71 0.12 C 4 -](https://thumb-eu.123doks.com/thumbv2/5dokorg/4846938.131337/20.892.110.871.134.442/summary-components-experiments-yoshioka-temperature-hydrogen-aliphatics-aliphatics.webp)