Traceability in a Sanitary Ware Production
System
– A Case Study at Ifö Sanitär
Authors:
Robert von Sivers Alexander Sjögren
Faculty of Engineering, Lund University
Supervisors:
Johan Bergskans
Production Supervisor, Ifö Sanitär AB Bertil I Nilsson
Department of Industrial Management & Logistics, Faculty of Engineering, Lund University
I
Preface
This Master Thesis was performed at the Faculty of Engineering at Lund University as the final part of our Master of Science in Mechanical
Engineering during the spring of 2013. It was performed in collaboration with Ifö Sanitär AB, which had identified the need for better traceability and production reporting at the factory in Bromölla.
This project has been a great experience and learning opportunity for us. In this 20 week long project we applied many of the things we have learned during our specialization in the field of production management and logistics.
First of all we would like to thank and acknowledge our supervisor Johan Bergskans at Ifö Sanitär for the invaluable support during this project. We would also like to thank the steering group at Ifö for their commitment and valuable insight to this project.
We would also like to thank our supervisor at the Division of Production Management Bertil I Nilsson for his feedback and guidance during this project.
Finally, we would like to thank all the personnel at Ifö for their valuable input, expertise, welcoming attitude and good response to this project. Lund, June 2013
II
Abstract
Title: Traceability in a Sanitary Ware Production System – A Case Study at Ifö Sanitär
Authors: Robert von Sivers and Alexander Sjögren, Mechanical Engineering -08
Supervisors: Johan Bergskans, Production Supervisor at Ifö Sanitär in Bromölla.
Bertil I Nilsson, Department of Industrial
Management & Logistics, Faculty of Engineering, Lund University
Research questions: How to implement a traceability system in an automated sanitary ware production system
Deliverables: This thesis establishes whether it is cost
beneficial to implement a traceability system for an automated sanitary ware production system where there are no legislative requirements.
Methodology: The research method that is used in this thesis is a combination of action research and
experimental methods. A literature review, observations and interviews were performed in order to identify existing traceability theories and applications as well as fully understand the production characteristics of sanitary ware manufacturing. In addition, experiments were performed in order to evaluate the most suitable traceability application for the use in an
automated sanitary ware production system.
Delimitations: This thesis covers the use of traceability and its applications in the automated production lines at Ifö’s factory in Bromölla and it only includes the internal flow of goods at Ifö.
III
Conclusions: The solution includes a direct part marking on each and every product that is produced in Bromölla, with an individual serial number. All product movements will be stored, allowing for the ability to conduct follow-ups on defects and performance of different parts of the production system. It can be concluded that the use of an automated traceability system is cost-beneficial in the automated production lines at Ifö Sanitär.
Keywords: Traceability methods, traceability system, sanitary ware production, marking on ceramics, continuous improvement, AIDC
IV
Acronyms and glossary
AGV An Automated Guided Vehicle is a self-propelled robot that follows markers or wires in the floor, or uses vision systems or laser for guidance
AIDC Automatic Identification and Data Capture Binary code Represents text or computing instructions using the
binary systems two digits 0 or 1, meaning “ON” or “OFF”
Demolding plate A tool that the piece rests on after the casting glazing
operation
Dried ware A piece that have been casted and dried
ERP An Enterprise Resource Planning system keeps track and stores all relevant business information across an organization such as financial information, purchasing, manufacturing, sales, customer information etc.
FFC Fine Fire Clay
FIFO First In First Out
FMEA Failure Mode and Effect Analysis is a tool for failure
analysis and is used for quality improvement
Glaze Glaze is a layer of vitreous substance that fuses with a ceramic object during firing. It serves to color,
strengthen or waterproof an item
Glazing plate A tool that the piece rests on after the casting and during the glazing operation
Green ware A piece that have been casted, but not dried
LEAN A manufacturing philosophy that considers expenditure of resources other than for creating value for the end customer as wasteful, and must therefore be eliminated
V
LIFO Last In First Out
OEE-system Overall Equipment Effectiveness system evaluates
how effectively a manufacturing operation is utilized
PDA A Personal Digital Assistant is a handheld computer
VC Vitreous China
WIP Work In Process are products that are currently in the
VI
Table of Contents
PREFACE ... I ABSTRACT ... II ACRONYMS AND GLOSSARY ... IV TABLE OF CONTENTS ... VI
1 INTRODUCTION ... 1
1.1 TRACEABILITY IN GENERAL ... 1
1.2 COMPANY BACKGROUND... 2
1.3 BACKGROUND OF THE FACILITY IN BROMÖLLA ... 2
1.4 PROBLEM DESCRIPTION ... 2
1.5 DELIMITATIONS ... 3
1.6 PURPOSE ... 4
1.7 PROJECT DELIVERABLES ... 4
1.8 THE STRUCTURE OF THE REPORT ... 4
2 METHODOLOGY ... 9
2.1 RESEARCH STRATEGIES ...9
2.2 RESEARCH METHODS ...12
2.3 METHODS FOR DATA GATHERING ... 13
2.4 QUALITATIVE AND QUANTITATIVE APPROACH ... 16
2.5 DATA COLLECTION ... 16
2.6 PROCEDURES FOR ANALYZING AND DRAWING CONCLUSIONS ...17
2.7 THESIS VALUE ... 19
3 FRAME OF REFERENCE ...21
3.1 LITERATURE SEARCH ...21
3.2 CONCEPTS OF TRACEABILITY ... 22
3.3 TRACEABILITY ... 22
3.3.5 BENEFITS WITH TRACEABILITY ... 26
3.4 TRACEABILITY SYSTEM ... 28 3.5 TRACEABILITY METHOD ... 31 3.6 SYSTEM DESIGN ... 43 3.7 IMPLEMENTATION ... 46 3.8 SIPOC ... 47 3.9 INVESTMENT ANALYSIS ... 48 4 EMPIRICS ... 51
4.1 REQUIREMENTS OF TRACEABILITY AT IFÖ IN BROMÖLLA ... 51
4.2 DESCRIPTION OF THE PRODUCTION SYSTEM AND THE CLAIM SITUATION... 51
5 EXPERIMENTS ... 73
VII
5.2 DIRECT PART MARKING ... 77
6 ANALYSIS ... 91
6.1 A TRACEABILITY SYSTEM’S COMPLIANCE WITH THE SANITEC PRODUCTION SYSTEM ... 91
6.2 THE DEMAND FOR TRACEABILITY BY IFÖ’S STAKEHOLDERS... 92
6.3 THE NEED OF TRACEABILITY AT IFÖ SANITÄR BROMÖLLA ... 92
6.4 THE RELATIVE IMPORTANCE OF TRACEABILITY ... 95
6.5 BENEFITS WITH A TRACEABILITY SYSTEM AT IFÖ SANITÄR BROMÖLLA ... 96
6.6 TYPE OF TRACEABILITY NEEDED AT IFÖ IN BROMÖLLA ... 102
6.7 APPROPRIATE DESIGN OF A TRACEABILITY SYSTEM AT IFÖ SANITÄR BROMÖLLA ...103
7 SPECIFICATION OF REQUIREMENTS ...107
7.1 SPECIFICATION OF REQUIREMENTS FOR THE AIDC METHOD ... 107
7.2 SPECIFICATION OF REQUIREMENTS FOR THE TRACEABILITY SYSTEM ... 108
7.3 CONCEPT FOR THE STANDARD WASHBASIN PRODUCTION LINE ... 109
8 PROPOSAL AND ALTERNATIVES ... 111
8.1 SYSTEM DESIGN ... 111
8.2 COST-BENEFIT ... 119
9 CONCLUSION ... 127
10 IMPLEMENTATION PLAN ... 129
11 ADDITIONAL WORK ... 133
11.1 POSSIBILITIES WITH A TRACEABILITY SYSTEM... 133
12 DISCUSSION ... 135
12.1 THE VALUE OF THIS THESIS... 135
12.2 HOW THE SYSTEM WILL AFFECT THE OPERATIONS ...136
13 CONTRIBUTION TO THE ACADEMIA ... 139
REFERENCES ... 141 APPENDIX 1 ... App 1:1
APPENDIX 2 ... App 2:1 APPENDIX 3 ... App 3:1
1
1
Introduction
The introduction deals with a short description of traceability, an introduction of the company and the factory where the project is carried out. A problem description for the project is also included and the delimitations. This information leads to the purpose of the project. Project deliverables and reading instructions are also included.
1.1
Traceability in general
van der Vorst (2006) has defined traceability as “The ability to document and trace a product (lot) forward and backward and its history through the whole or part, of a production chain from harvest through transport, storage, processing, distribution and sales.” In order to keep a general approach the word lot is used. The amount of distinct items is not set and can vary from one to multiple. The need of better traceability in businesses have increased in the last decades, especially in the food industry due to certain events like the outbreak of mad-cow decease in the 80’s and 90’s, and foot-and-mouth decease in the 00’s. These events led to that the general public demanded information regarding what had been produced where and when. There were also problems with the recall of infected meat, the producers could not locate to which locations the infected meat had been distributed (Kvarnström, 2010).
Traceability can be used in many applications but the most obvious one is in logistic applications, for example, in order to track and trace a certain product that has been packed at a certain point in time. It is also an important tool in order to support LEAN in businesses i.e. supporting the work of continuous improvements due to an increased ability to find root causes (Mahoney & Thor, 1994, cited by Kvarnström, 2010). If a company wants to be ISO9001-2008 certified it needs to be able to on demand show traceability either internally or to a third party (International Organization for Standardization, 2008).
The use of traceability differs a lot depending on what industry that is highlighted. The food industry and the pharmaceutical industry are known for their extensive traceability, this is however rather forced upon them due to legislation. There are also industries where the traceability is well
2
industry is an example where the LEAN principles are extensively
implemented and in conjunction with that the traceability is needed in order to minimize waste and to continuously improve. There are no legal demands on the sanitary ware industry, the demand for traceability is stated in the ISO9001-certification, and required by the customers. There are suppliers of both marking methods and IT-systems that provide solutions for extensive traceability that are specialized in the sanitary ware industry. These solutions are developed with a non-automated situation in mind, where the marking of the pieces are carried out manually (S.A.I.T. S.R.L., 2009).
1.2
Company background
Ifö Sanitär AB, from now on Ifö, is the Nordic market leader of sanitary ware and kitchen sinks. They are part of the Finnish Sanitec Corporate Group, which is the leading European multi-brand bathroom ceramics specialist. Ifö’s business concept is to provide an all-inclusive range of products for bathrooms and toilets along with kitchen and utility sinks. Except for the Nordic region Ifö also conduct business operations in Russia and in the Baltic region. Ifö currently employs approximately 560 people and the annual turnover for 2011 was 1 287 099 000 SEK. There are two production plants active in Sweden, both situated in the south. The largest one is situated in Bromölla and it handles all types of sanitary porcelain. The second plant is located in Mörrum that mainly produces bathtubs and showers, and no ceramic products.
1.3
Background of the facility in Bromölla
Since 1936 water closets have been produced in Bromölla. The raw material that was used, lime and china clay, was collected from the nearby small island, Ivön. For 65 years the operations were handled manually to a large extent, until 2003 when substantial investments were made in order to automate the production. A state-of-the-art pressure casting technology was implemented and in addition to that, an implementation of lean principles was made. These changes have given Ifö an edge against the competition and have made the factory the most efficient one in the Sanitec group.
1.4
Problem description
During the last few years there has been an increased discrepancy in the internal warehouse stock account at Ifö in Bromölla, which has triggered the need for better traceability through the production. All of the production
3
reporting is performed manually, which in some cases results in faulty inputs due to high work intensity. Therefore, Ifö desires to automate the production reporting to decrease the amount of faulty inputs.
The Ifö quality system also requires a traceability of the products, which today is deficient because there is no easy way of determining when a product has been made. This becomes more complicated with the water closets, since they are made from multiple components that can have been produced at completely different points in time. The traceability needed for dealing with customer claims is lacking, consequently the management at the factory in Bromölla believes that a lot could be gained by improving the traceability at the factory. There are no legal requirements for traceability in the industry Ifö operates in, and the need of extensive traceability is purely driven by the factory’s desire to improve their operations.
There have been discussions for a long time regarding the possibility to implement better traceability in the factory, and now the management would like to ascertain the potential for such an implementation. This would include how to implement a system as such as well as integrating it to the highly automated production system, which means that all, or as many as possible, of the activities regarding the traceability system should be handled automatically. The requirements of the production system are to be taken into consideration when implementing a new system in order to achieve an as smooth transition to the new system as possible. Since the management of the factory drives the need of improved traceability, the investment in such a system also needs to be analyzed in order to determine if it is cost-beneficial to implement it.
1.5
Delimitations
The project will only focus on the factory in Bromölla. It will cover the material flow from when the raw material enters the factory until the product is installed at the end customer. The low quantity production line with manual casting is excluded from the project. The project will not make changes in the material flows in the factory unless the steering group sanctions them.
4
1.6
Purpose
The purpose of this thesis is to investigate how to implement a product traceability system in Ifö’s factory in Bromölla, and how to integrate automated production reporting with their current ERP-system or with a standalone system. A specification of requirements is to be established both for the marking method and the traceability system as a whole. This will be carried out in order to find the most suitable marking method and to fit the traceability system in a satisfying matter in the production system. It is also required to establish whether it is cost-beneficial to implement a traceability system in a production system, where the industry that does not have certain regulations or requirements from their customers regarding extensive
traceability.
1.7
Project deliverables
The main deliverables of this thesis is to establish whether it is economically beneficial to improve the traceability by introducing a product marking system in the Bromölla factory. Furthermore, identify the most suitable automated product marking method and a system for automatic registration of approved items when they are moving to the next process. These two parts will be handled in a technical report that is meant for the academy. In
accordance with this report a separate summary will be written in the form of a popular science article and a seminar will be held. As for the company, a 30-minute presentation will be held for the senior management at the factory, and if the investment is deemed profitable with a payback time of three years, an investment demand is to be written.
1.8
The structure of the report
This subchapter will supply the reader with enough information to get a clear view of how the report is structured and to understand how the
chapters are connected to the purpose of the project. It should be noted that the structure of the report is not related to how the project have been conducted. The structure used in this report has been chosen in order to simplify the understanding of the project for the reader. A summary of how the work has been conducted can be found in subchapter 2.1.6 Research strategies in this thesis.
5 1.8.1 Introduction
The introduction includes a short presentation of the company where the project have been carried out, a presentation of what traceability is in general and some applications, a problem formulation for the project at hand, and the delimitations of the project. The information supplied in the background should be sufficient in order for the reader to understand why all the subparts of the purpose are needed for the project.
1.8.2 Methodology
This chapter is to be read in order to understand how the authors have conducted the project in order to satisfy the purpose. Different approaches are discussed and the authors’ choice of approach is also presented to the reader.
1.8.3 Frame of reference
The frame of reference should be read if the reader wants to know what research and general information regarding traceability that was available to the authors to use in the project. The information presented in this chapter is applied on the highlighted production system and is crucial in order to satisfy the purpose of the project. The chapter deals with the structure of a traceability system, the technologies associated with automatic identification and data capture (AIDC), and the design and implementation of the system. 1.8.4 Empirics
This chapter will supply the reader with sufficient information regarding the production system at Ifö in Bromölla needed to draw conclusions for a traceability system. In addition to that the flow of goods from raw material to end-customer and the claims handling of Ifö’s own brand is explained. The information supplied in this chapter is especially important in order for the authors to identify the needs of the production system, in order to develop a specification of requirements for the traceability system and the traceability method.
1.8.5 Experiments
The experiments chapter should be read as a stand-alone chapter where marking methods from subchapter 3.5.4 Marking methods are tested and evaluated. This chapter focuses on the application of different marking methods and the reliability of them after the different process steps. The reader should note that these experiments are not directly quantifiable, but
6
rather an example of what works, and how good it works, for the specific conditions at Ifö’s production lines.
1.8.6 Analysis
In the analysis the frame of reference, chapter 3, is compared against the current situation, found in the chapter 4 Empirics. In addition to this comparison, aspects discovered during the mapping of the production system are discussed. This chapter is meant to guide the reader into the following chapters 7 Specification of requirements and 8 Proposal and
alternatives, the reasoning behind the specifications and the proposal can be found in the analysis.
1.8.7 Specification of requirements
This chapter aims to give the reader a specific knowledge of the technical requirements for both the traceability system and the specific AIDC method. This chapter is based on chapter 5 Experiments and 6 Analysis and should be read as a prerequisite in order to understand why the proposal and
alternatives in chapter 8 Proposal and alternatives has been made. 1.8.8 Proposal and alternatives
In this chapter the main proposal and the alternatives are presented with a cost-benefit analysis and investment appraisal. The reader should be able to evaluate these proposals with the preceding chapters in mind.
1.8.9 Conclusion
In this chapter, the authors aim to summarize the outcome of this thesis and give the reader follow-up on the purposes of this thesis mentioned in
subchapter 1.6 Purpose. 1.8.10 Implementation plan
In this chapter a short implementation plan is presented and aspects to consider are brought to attention. This chapter is primarily directed to personnel at Ifö.
1.8.11 Additional work
This chapter describes how the traceability system can be further expanded and what possibilities of business improvements it brings.
7 1.8.12 Discussion
The aim of this chapter is to analyze the value of the thesis and to give the reader further information on the impact the traceability system will have on several parties within Ifö.
1.8.13 Contribution to the academia
In this chapter the authors establishes how this thesis can contribute to the academia by comparing the existing literature to the work in this thesis.
9
2
Methodology
In this chapter different research strategies, research methods, methods for gathering data, approaches, procedures for analyzing and drawing
conclusions, and thesis value will be discussed. Several alternatives will be presented and the methodology chosen by the authors is motivated.
2.1
Research strategies
2.1.1 Exploratory
An exploratory study aims to give an in-depth understanding how something functions or is executed (Höst, et al., 2006, p. 29). The exploratory strategy is often used when there is little to no knowledge about the subject. It is used to obtain more information and establish the relevant issues to investigate (Lekvall & Wahlbin, 2001, pp. 196-197).
2.1.2 Descriptive
The main purpose of a descriptive study is to find out and describe how something functions or is executed (Höst, et al., 2006, p. 29). It does not try to explain why something occurs but rather how it looks like (Lekvall & Wahlbin, 2001, p. 197). A descriptive study is well defined and delimited before it commences and tends to a large extent to be based on
measurements and quantitative methods. The study provides knowledge about different connections and relations. However, the study can never prove that a certain variable affects the other (DePoy & Gitlin, 1999, pp. 102-103).
2.1.3 Explanatory
An explanatory study seeks causation and explanations to how something functions or is executed (Höst, et al., 2006, p. 29). This type of study often has high demand for statistical certainty that puts high demand on the methodical and technical approach (Lekvall & Wahlbin, 2001, p. 197).
Explanatory studies are based on an accepted theoretical framework and the purpose is to support the theory. These studies are solely based on
measurements and statistical analyses of quantitative data (DePoy & Gitlin, 1999, p. 103).
10 2.1.4 Normative
The purpose of a normative study is to find a solution to a specific problem that has been identified (Höst, et al., 2006). It is used when the project group already has knowledge in the area. The goal is to provide guidance and propose actions (Björklund & Paulsson, 2003, p. 58).
2.1.5 Predictive
A predictive study results in a prediction or a forecast for a future
development. In order to understand why a system behaves in a certain way, knowledge must be acquired beforehand. The understanding is crucial in order to credibly forecast the future development (Lekvall & Wahlbin, 2001, pp. 197-198).
2.1.6 Research strategies in this thesis
The internal processes of this thesis are not widely known at the start of the project. In order to get an idea of what is needed and to obtain more
information an exploratory approach will be used for the first couple of weeks. During this phase a lot of time will be spent compiling the literature on the subject. Initial interviews with key staff members will also be carried out during this period in order to get an initial understanding of the
production system.
After a reasonable knowledge base has been built, the study goes into the descriptive phase. The production line that the study mainly was focused on will be mapped in order to get a solid base to stand on when different traceability systems and traceability marking methods were analyzed. Additional literature studies will be carried out in accordance with what is discovered during the mapping of the production line.
When a wide knowledge has been attained both of the production system and traceability in general, the thesis will go into the third phase,
explanatory. In this phase experiments with different marking methods will be carried out in order to find out if they can be adapted into the production system. During this phase the benefits with traceability will be covered and compiled in order to support an investment demand. The approach can be found in Table 1.
11 Table 1 – Research strategies in this thesis
Phase 1: Exploratory Phase 2: Descriptive Phase 3: Explanatory Activities:
Initial literature studies Interviews with personnel vital to the processes Interviews with personnel at the production stations Direct observations
Input:
General specification of requirements
General knowledge of the production system
Input:
Possible traceability methods and suppliers, chosen for tests
Considerable knowledge in the production system Activities:
Additional literature readings
Mapping of the production system through observations and validation through interviews
Customize the specification of requirements in
accordance with the production system’s needs, see chapter 7 Specification of
requirements
Activities:
Carry out experiments on possible traceability methods Identify benefits with traceability that can prompt cost savings, and quantify these through surveys, interviews, and observations
Focus:
Explore processes, traceability systems and traceability methods
Focus:
Understand processes and dig deeper into fitting traceability systems and traceability methods
Focus:
Find the most suitable system and method of traceability for the production system. Connect resolved issues with monetary values
Deliverables:
General specification of requirements for the traceability system and the traceability method
Deliverables:
Requests of information sent out to suitable companies in the AIDC industry
General “ideal” solution for a traceability system, see subchapter 7.3 Concept for
the standard washbasin production line
Deliverables:
Proposal regarding marking method and traceability system, see chapter 8
Proposal and alternatives
Cost-benefit analysis regarding the implementation of a traceability system, see subchapter 8.2 Cost-benefit
12
2.2
Research methods
2.2.1 Desk research
Desk research means that the project group ”reanalyzes” one or several data collections that have been carried out earlier in other projects. The purpose of this analysis is to raise different questions than those that were raised the last time (DePoy & Gitlin, 1999, p. 236).
2.2.2 Survey
A survey is a compilation and a description of the current status of the studied object or phenomena. Often, the purpose of the survey is to describe a broad question. The survey is performed by using quantitative data and/or qualitative data gathered by questionnaires and interviews drawn from a random sample of the population that is supposed to be studied. Therefore, once a protocol has been set up and sent out it must remain the same. No questions can be altered throughout the process. A survey is used not only to describe the current status but also to predict factors that can lead to
satisfaction. The benefit of using a survey is that a large amount of persons can be reached with a relatively small effort. However, the drawback is that depending on the way it is distributed, a survey can get a low response rate (DePoy & Gitlin, 1999, p. 149).
2.2.3 Case study
A case study is an in-depth study of one or several cases where the researcher tries to minimize his influence on the studied object. A case study often describes a specific case which is often chosen for a specific purpose. Therefore, no generalizations of the results are made for other cases. A case study can, for example, be made within an organization in order to
understand how they work. Case studies can include both quantitative and qualitative data. It can be limited to one case or include several cases as well as being exploratory, descriptive or predictive. Case studies are suitable when a phenomenon should be studied in its natural environment, if it should contribute to or develop a theory or if a case that is non-typical or different needs to be explored thoroughly (DePoy & Gitlin, 1999, pp. 192-193).
2.2.4 Experimental
A comparative analysis of multiple alternatives where the parameters are identified and one or multiple parameters are altered. This is done in order
13
to find causation with the purpose to explain why a certain phenomenon occurs. An experiment is a fix design and no changes can be made after the experiment has commenced. This means that a lot of planning is required before the experiment commences (Höst, et al., 2006, p. 36).
2.2.5 Action research
Action research is a closely monitored and documented study of an activity, with the purpose of solving a problem. The steps in action research can be described as; Observe a situation or a phenomenon in order to identify or clarify the problem that is supposed to be solved. For this, a combination of case studies and surveys can be used. The next step is to propose a solution to the problem and solve it. Once that has been made, an important but often neglected part follows; an evaluation and analysis of the solution in order to establish whether it works as predicted. The method closely
resembles how quality or process enhancements are carried out (Höst, et al., 2006, pp. 39-41).
2.2.6 Research methods used in this master thesis
The research method that will be used in this thesis is a combination of action research and experimental methods. Since the problem formulation is well defined, action research will be used to identify potential benefits with traceability and propose a solution to the implementation of a traceability system. The experimental part of this thesis will consist of multiple
experiments with different types of bar codes, the application of these, and the marking method itself. The process puts unique demands on the marking (i.e. shrinkage/deformation, extreme temperatures and glazing). Therefore, experiments on the specific process are required in order to establish that the marking method actually works as intended.
2.3
Methods for data gathering
2.3.1 Literature review
A literature review is a process in which the researcher critically reviews the literature that is either directly or indirectly related to the field of study. The information that is retrieved gives guidance to the appropriate focus and strategy of the study. By finding out what others know and how they have acquired this knowledge, is helpful in determining whether the research fits
14
into the existing body of knowledge and if it in a unique way contributes to science (DePoy & Gitlin, 1999, p. 82).
2.3.2 Interviews
Interviews are a method for gathering qualitative data, most often performed with a specific individual. The questions in an interview can have different form and structure; it can be segmented in three types of interviewing techniques according to Höst et al. (2006, pp. 34-35):
Structured interviews – An interview that is based on predefined list of questions and answers that is followed exactly. This roughly corresponds to a verbal questionnaire. The advantage of using a structured interview is that the data collected will be easy to analyze given its limited number of responses.
Semi-structured interviews – An interview that has a predefined list of question in support of the interview. Nevertheless, the question can change order and sometimes the formulation of the question can be altered considering the situation in the interview.
Unstructured interviews – Open-ended question is used which lets the interviewee control what is covered in the interview. The control of the interviewee is limited by questions that is supposed to ensure that the interview stay within the area of the study.
2.3.3 Observations
Observation is a technique where the researcher studies a series of situations by using his senses or technical aids and takes note of what happens. The observer can be a participant in the event, or act as a bystander just observing while being invisible to the participants. The advantage of the observer being a participant is that the observer can establish trust from the persons he studies, and the disadvantage is that the researcher risk losing objectivity and distance towards the study. The risk with of being an “invisible” observer is that he risk creating too great of a distance and therefore not admitted into the event properly (Höst, et al., 2006, p. 35). 2.3.4 Experiments
Experiments are carried out in order to find causation and explain why certain phenomena occur. Through experiments, technical solutions can be compared in order to find the most ideal. In an experiment, several
15
and repeat the process. An experiment is of a fix design and cannot be changed after it has commenced. This leads to that an experiment must be well prepared beforehand. The goals with the experiment need to be defined, what should be analyzed? What is the purpose? If two methods is to be compared the starting point is to formulate the null hypothesis i.e. that there is no difference between the methods. This hypothesis is then rejected for another hypothesis if there is a difference between the methods (Höst, et al., 2006, pp. 36-37).
2.3.5 Methods for data gathering in this master thesis
Literature reviews will be a large part of this project since the knowledge beforehand is limited. It will give guidance into what issues that will be focused on and support the creation of a traceability framework for the project.
Interviews will be carried out with both personnel that are vital to the process as well as with personnel that carries out the work at the stations. The interviews will be semi-structured or unstructured depending what is needed for the project from this certain person.
Observations will be carried out in order to achieve an understanding of the production system and the requirements that is put on the traceability system. In order to assure that the observations are correct, interviews with key personnel will be carried out. The production line will be closely observed in order to find out where benefits can be achieved with traceability.
The interviews and the observations is an integral part before the
experiments regarding the traceability method commences. This information will make sure that the traceability method can be integrated in the
production system. The main focus during the experiments is to make sure that the marking is readable on the material that the products are made of, through all process-steps. Therefore, the pieces will be read after each process-step with different types of reading equipment suitable for that specific marking method. The time to mark the products is also important since there will be time restrictions in the production process. The
experiments will be conducted on either samples or products in a laboratory environment. The experiments that are successful will also be conducted in
16
the regular production facilities. This is done to ensure the validity of the experiments.
2.4
Qualitative and quantitative approach
2.4.1 Qualitative
A qualitative method is primary used in order to understand a phenomenon. With different types of collection of data a deeper understanding can be gained. The project group should always be close to the place of data collection (Holme & Solvang, 1997, p. 14). In a qualitative survey the researcher gathers data that is not possible to quantify, i.e. to express it in numbers, and analyzes it with non-numerical analysis methods. The qualitative approach often uses interviews in order to find underlying behaviors (Lekvall & Wahlbin, 2001, p. 210).
2.4.2 Quantitative
In a quantitative study, the collected data can be expressed in a numerical format and analyzed by mathematical and statistical methods (Lekvall & Wahlbin, 2001, p. 210). As opposed to qualitative methods, the quantitative are formalized and structured. The project group controls to a large extent the data collection and it is not necessary for the group to be close to where it is extracted (Holme & Solvang, 1997, p. 14).
2.4.3 Approach used in this master thesis
In order to fully understand the process, a combination of qualitative data and quantitative data will be gathered. With the purpose of understanding the process and to find potential benefits of a traceability system, a
qualitative approach will be used. However, in order to validate the qualitative data, a quantitative approach will be used to find cost-benefits with a traceability system.
2.5
Data collection
2.5.1 Primary
Primary data is data that have been collected specifically for the intended study. Usually it is collected through interviews or observations (Björklund & Paulsson, 2003, p. 68). Primary data is collected when conducting field research or laboratory tests (Lekvall & Wahlbin, 2001, p. 212).
17 2.5.2 Secondary
Secondary data is data that have been collected for another purpose than the one of the project. These data are usually collected through literature studies (Björklund & Paulsson, 2003, p. 67). Secondary data is used when desk research is conducted (Lekvall & Wahlbin, 2001, p. 212).
2.5.3 Data collection in this master thesis
Both primary and secondary data will be used to analyze the problem. Secondary data in this project will consist of data from the ERP system and literature studies. The primary data will consist of data from interviews, time studies and experiments.
2.6
Procedures for analyzing and drawing conclusions
2.6.1 Induction
Induction means that the researcher tries to draw general and theoretical conclusions based on the empirical data that has been collected (Wallén, 1996, p. 47). Researchers who are applying a qualitative approach are mostly using inductive reasoning, i.e. that generalized rules evolves from one specific case or observations of phenomena (DePoy & Gitlin, 1999, p. 17). Inductive reasoning have with the increase of computing power become more useful. With new programming software that searches for correlations in the data, build decision procedures and successively revise its conclusions as the conclusion is compared with new data, theoretical conclusions can be made (In comparison with traditional software that is based on a pre-defined set of rules and procedures) (Wallén, 1996, p. 47).
2.6.2 Deduction
The deductive reasoning assumes accepted, general principles or concepts and then tries to apply these general principles to explain a specific event or phenomenon (DePoy & Gitlin, 1999, p. 17). It can be seen as a top-down approach where the researcher starts with the theory and bases his
hypothesis on the theory, which influences on the data collection. Based on whether the hypothesis can be validated or not, the theory is further
solidified or might require rephrasing (Bryman, 2002, p. 21). 2.6.3 Abduction
Abduction is a way of drawing conclusion about the cause of an event, by using logical reasoning to figure out what the most common factors are
18
without having the possibility to manipulate them. Abduction reasoning can for instance be used to set a diagnosis of a patient by establishing probable causes, draw conclusions by elimination of different factors, and
complement with tests to solidify or discard the diagnosis (Wallén, 1996, p. 48).
2.6.4 Triangulation
With triangulation more than one type of method or data source is used. Triangulation is closely associated with a quantitative research strategy since the reasoning behind it is to use several methods in order to get a greater reliability. However, it can also be qualitative. Interviews can for example assure the project group that they have not misunderstood their
observations. Triangulation is generally used to double-check the results in order to make sure that they are reliable. This applies both for qualitative and quantitative data (Bryman, 2002, p. 260).
2.6.5 Grounded theory
In the grounded theory there is a close connection between data collection, analysis and the resulting theory. The aim of the method is to achieve a theory based on the data. The analysis and the data collection should be carried out simultaneously. It is the most frequently used approach to analyze quantitative data (Bryman, 2002, p. 375).
2.6.6 Procedures for analyzing and drawing conclusions in this thesis The approach to this project will be both deductive and inductive, although carried out in different phases. The deductive approach will be used in order to determine how well the theory coincides with what is identified on site at the factory. The theory will probably not be sufficient for all parts of the project and for the later stages an inductive approach will be used in order to complement the deductive. Theory regarding the specific industry will probably be very limited regarding traceability and thus the inductive approach will be needed.
During the project triangulation will also be used in order to double-check the observations. The system will probably be very complex and interviews with key personnel will make sure no incorrect conclusions are made.
19
2.7
Thesis value
2.7.1 Validity
The validity of a study is determined by how well the measuring method actually measures what is intended. It is a very hard to determine whether the measuring method is valid or not. In order to validate the method, it would require a different method that gives the correct results (Lekvall & Wahlbin, 2001, p. 304).
2.7.2 Reliability
A high reliability of a measurement is determined by whether it is possible to achieve the same results from multiple measurements, given that the
variables are the same every time. If the results vary greatly from
measurement to measurement, the reliability is considered to be low (Lekvall & Wahlbin, 2001, p. 306). In order to achieve a high reliability, it is important to be thorough in the data collection and analysis. By documenting every step, it is possible to let other researchers examine the work in order to find weaknesses in the method. For qualitative studies based on interviews, it is important to present the data to the interviewee to confirm that the
researcher has interpreted the answers correctly. For quantitative studies, the use of statistical methods, and the correct interpretation of these, is crucial to achieve a high reliability (Höst, et al., 2006, p. 42).
2.7.3 Objectivity
Objectivity is a measure that determines to what extent the author is one of relative neutrality and has reasonable freedom from biases - at the minimum, the author should be explicit about the bias (Miles & Huberman, 1994, p.278 cited by Denscombe, 2007 p.273).
2.7.4 Credibility
Credibility mainly relates to the issue of causality. If there is causality between two phenomena, one of them is called the cause and the other the effect (Bryman & Bell, 2003, p. 34). If the relationship is valid it is credible. Credibility is the strength of qualitative research. Credibility entails ensuring that research is carried out in accordance with good practice (Bryman & Bell, 2003, pp. 288-289).
20 2.7.5 Transferability
Qualitative research is often of the type of an intensive study on a small group or of individuals that shares certain characteristics. The transferability refers to the degree these findings can be generalized across social settings (Bryman & Bell, 2003, p. 288).
2.7.6 The value of this thesis
The value of this thesis will be evaluated in subchapter 12.1 The value of this thesis.
21
3
Frame of Reference
In this chapter research and general information that was available to the authors during the project will be compiled. Traceability will be explained, as well as the design of a traceability system, and available traceability methods. In addition to this the system design of an AIDC-system will be compiled, as well as the implementation of a system, and relevant methods used in the thesis.
3.1
Literature search
A literature search was made to explore the existing scientific literature regarding traceability and the traceability methods. In this thesis, several databases and search terms has been used for the frame of references. Below is a list of databases and search terms.
Databases
Engineering village (Compendex, Inspec), Scopus, ScienceDirect, and Emerald. LUB search provided by Lund University was also used, which includes several of the aforementioned databases and many more.
Search terms
‘Traceability’, ‘Implementation of traceability’, ‘Traceability system’,
‘Production control’, ‘Bar codes’, ‘AIDC’, ‘Direct part marking’, ‘Ink jet’, ‘Laser marking’, ‘Dot peen’, ‘Sanitary ware’, ‘DPM ceramics’, ‘Ceramic ink’
22
3.2
Concepts of traceability
Kvarnström (2006, p. 21) defined the three concepts of traceability and the relation between them. The part of the frame of reference that is focusing on traceability will be divided into these concepts, see Figure 1.
Figure 1 - The three concepts of traceability, adapted from (Kvarnström, 2010)
The traceability system and the traceability methods interact with each other in order to achieve traceability.
3.3
Traceability
3.3.1 Definitions
There are many definitions of traceability and they can be very specific to the highlighted industry. A general definition from the food industry will be used for the project since the research regarding traceability in the ceramics industry is limited. Van der Vorst (2006) defined traceability as “The ability to document and trace a product (lot) forward and backward and its history through the whole or part, of a production chain from harvest through transport, storage, processing, distribution and sales.” In order to keep a general approach the word lot is used. The amount of distinct items is not set and can vary from one to multiple.
Since the project carried out in this thesis is closely involved with the quality of the product, another definition highlighting requirements traceability is
23
also added. Robertson & Robertson (2006, p. 353) defined requirements traceability as “A requirement is traceable if it can identify all parts of the product that exist because of the requirement and, for any part of the product you can identify the requirement or requirements that caused it.” The fulfillment of requirements is crucial in order to deliver a quality product. The definition of quality used in this project is retrieved from Bergman and Klefsjö (2007, p. 26) as “The quality of a product is its ability to satisfy and preferably exceed, the customers’ requirements and
expectations.”
The international standard ISO 9001:2008 mentions traceability and the requirements of it in clause 7.5.3. It states that where appropriate the organization shall identify the product by suitable means throughout
product realization. It also states that where traceability is a requirement, the organization shall control the unique identification of the product and maintain records (International Organization for Standardization, 2008). 3.3.2 The use of traceability in different industries
There are two industries that are known for the use of extensive traceability, the food industry and the pharmaceutical industry. Both industries are bound by legislative requirements to be able to trace their products to a certain extent (Kvarnström, 2010).
Swedish food producers are for example required to follow article 18 in EG 178/2002. The producers needs to know from whom they have received and/or to whom they have supplied food and food producing animals, and be able to inform the authorities about this. The purpose of traceability is to be able to conduct very specific product recalls. The precision of the traceability is not declared in the article, which leaves it up to the producer to decide the extent in order to reach the purpose (The European Parliament and the Council of the European Union, 2002).
The Swedish Medical Products Agency, i.e. Läkemedelsverket, have stated what needs to be documented by pharmaceutical producers in Sweden in the code of statute 2009:11. The documentation must contain information
regarding arrival time and delivery time, number of packages, size of packages, type of pharmaceutical and pharmaceutical form and intensity of the pharmaceutical or an unambiguous product identifier. Alongside this
24
information the supplier and the customer’s name and address needs to be stated and it should be clear that the pharmaceutical have been approved, and its batch number. In order to be able to supply this information there needs to be extensive traceability during the whole supply chain of
pharmaceuticals, and thus the need of traceability is rather forced by the authorities, in the same way as in the food industry (Läkemedelsverket, 2009).
There are industries that are known to have well-developed traceability systems but where the need of traceability not is directly forced by
legislation. One example is the automotive industry, where the vehicles need to be certified for different aspects. The information that needs to be
supplied in order to apply for a registration of a vehicle is stated by the Swedish Road Administration i.e. Vägverket, in the code of statute 2007:492. The application must include the type of vehicle, brand and type, model year, chassis number or frame number or equivalent, and the odometer reading. In order for the customer to supply the chassis number the manufacturer needs to equip the vehicle with a marking. These types of certifications are however not the reason why traceability is well developed in this industry, it is the rather the extensive implementation of LEAN production. In order to eliminate waste and continuously improve the operations in accordance with the LEAN principles, traceability is an important tool in order to for example find root causes (Bergman & Klefsjö, 2007).
The marking of products, and thus traceability, are carried out in the ceramics industry as well. If the industry of sanitary ware is highlighted, there are industry-specific labels with bar codes, which are manually applied (Strico AG, 2013). This is the only type of marking that the authors have encountered that is developed with the sanitary ware industry in mind. The markings are readable through the whole production process, and it is possible to attain extensive traceability with this method. There are suppliers that have developed industry-specific IT-systems that take the different processes in consideration. The IT-systems identified by the authors have all been developed with a non-automated production system in mind, which means labor-intensive reading of the products and labor-intensive marking of the products (S.A.I.T. S.R.L., 2009).
25 3.3.3 The need for traceability
The need for traceability is brought to light when thought to be identical items display differences in characteristics. Töyrylä (1999, p 17-18) identified six factors that can result in differences in otherwise identical items and that eventually highlight the need of traceability.
1. Age between different items can be a factor. Depending on when the item is produced there could, for example, be design differences for the same product, alterations in the value-adding processes could also have been made during the products lifetime.
2. Origin is also a factor that can cause differences in the items. If there are different sources of the raw material that the items consist of, otherwise identical items can bare different characteristics. 3. The destination the item is meant for is another factor that can
influence the need for traceability. If there are several locations or markets that the item is meant for traceability is needed in order to, for example, issue a mass recall.
4. Customization of items for a special customer order i.e. intentional diversity also results in differences in thought to be, identical items and therefore, highlights the need for traceability.
5. Errors and variations within the manufacturing and distribution of the items i.e. unintentional diversity, for the same reasons as for intentional diversity.
6. The risk for illegal activities is the last factor and depends on the value of the product. Traceability can be used in order to ensure who were responsible when something was stolen. This factor also
includes issues concerning counterfeit products and the identification of these.
3.3.4 The relative importance of traceability
In addition to these factors Töyrylä (1999, pp. 18-20) also compiled five factors for determining the relative importance of traceability. The factors are used in order to determine the appropriate level of traceability.
1. The value of the item is a main factor in order to determine the appropriate level of traceability. For example, a high valued item can be entitled to a serial number, and a low valued item to a date code.
26
2. The criticality of the item is another important factor. If the item is critical in relation to the quality or functionality of the item or to the system it is part of, it has an increased need for traceability.
3. The length of the item’s life also contributes to determining the appropriate level of traceability. The longer item life the higher the amount of items in circulation and thus higher need for detailed traceability.
4. The complexity of the system also influences the level of
traceability. Examples are, if a replacement of an item is expensive either in monetary values or time, if the item is not protected by a patent or trademark, if a failure in the item affects the system it is related to.
5. The external environment can contain a lot of factors. These can, for example be, increased customer concerns with a product and where the raw material is collected. Customers’ need of
customization of items also affects the appropriate level of traceability as seen subchapter 3.3.3 The need for traceability. 3.3.5 Benefits with traceability
A well performing traceability system has different areas of benefits. Some of these areas were compiled by Töyrylä (1999, pp. 10-17).
Product recall
Product-liability-prevention
Quality- and process improvement
Proof of quality and origin
Logistics
Security
After-sales
Accounting
Product recalls can be issued for a certain product or product batch when considerable errors or variations are identified. There are many costs related to a product recall, such as damage of the reputation for the responsible company, increases in insurance premiums etc. In order to reduce these costs to a minimum a traceability system could be of help in, for example, locating the defect products fast (Töyrylä, 1999, pp. 10-11).
27
In cases where the product-liability is highlighted, a traceability system can provide information regarding if the company is liable for a defective item or not (Töyrylä, 1999, p. 11). The traceability system can, for example, help to prove that a certain defect of a product was made after it left the
responsibility of the manufacturer.
A traceability system will also provide an opportunity for product designers, process developers etc. to gather more information about how the product responds to different changes (Töyrylä, 1999, p. 12).
Proof of quality or origin can be required by end-customers, for example, because of environmental reasons. It may also be required by customers in order to prove that contractual requirements have been met. With a traceability system both can be provided to the customer (Töyrylä, 1999, p. 13).
The opportunities of traceability in logistic applications are obvious. The ability to track a certain product and efficiently plan a distribution route as well as making sure that products are not mixed up during transportation and if they are, simplify the localization of them. Internal logistic aspects also need to be taken into consideration. With a traceability system, changeover times and lead times are clearly visible (Töyrylä, 1999, p. 15).
Security applications can refer to identifying where losses in manufacturing occurred and who were responsible at the time. Other applications can be to identify counterfeit and illegal products (Töyrylä, 1999, p. 16).
The after-sales are also an issue where traceability can be an important aid. Product serial numbers can clearly identify when a certain product was made and therefore verify a warranty claim (Töyrylä, 1999, p. 16). Information on known issues on specific products available for service divisions is another aspect that should not be neglected.
Data from the traceability system can also be used by accounting in order to support them in cost accounting. With traceability, costs can be assigned to where they incur. Another obvious application is to calculate the correct amount of work-in-process and inventory levels. (Töyrylä, 1999, p. 17)
28 3.3.6 Types of traceability
One must distinguish between different types of traceability, depending on what the traceability is meant for. Jansen-Vullers et al. (2003, pp. 402-404) distinguished between these types.
Tracking is a method of following an object through the supply
chain and registering any data considered of any historic or monitoring relevance.
Forward traceability depicts the exploration of where-used
relations between objects. These relations depict all end products having consumed a particular raw material of interest.
Backward traceability refers to the exploration of the where-from
relations between objects. These relations depict the raw material lots consumed by manufacturing operations for the production of the one particular product and further backward.
Active traceability is a method that considers traceability as a tool
to manage quality information through the entire chain and, within a specific link of a chain, for the purpose of process optimization and control.
Passive traceability is a method that provides the visibility to where
items are at all times and their disposition.
3.4
Traceability system
According to Moe (1998), a traceability system consists of two different parts, namely the routes of the product and the extent of traceability wanted i.e. what the scope of traceability is. This means that the system should contain all the paths the product can take and where they can be identified, from manufacturing to end-consumer.
3.4.1 Design of a traceability system
Golan et al. (2004) compiled how to design a traceability system considering the scope of traceability.
The breadth, which is related to the amount of information that
needs to be recorded by the traceability system.
The depth, which is related to how far back or forward in the chain
29
The precision, which is related to how precise the system is in
pinpointing the products movement or characteristics.
Steele (1995, pp. 53-59) acknowledged four elements that according to him together defined the full scope of lot traceability.
Physical lot integrity
Data collection
Lot-process linking
Reporting
The physical lot integrity describes how large a lot should be and the integrity of it. The integrity determines the precision of the traceability system. According to Steele (1995) there are three situations that can lead to loss of lot integrity.
Lot mismatching, which means that a lot is transformed into a new lot, but the new lot does not exactly match the source lot. Lot-end mixing, which means that there has been a failure to
keep adjacent lots separated from each other which can result in mixing at the end of one lot and the beginning of the other lot. Lot-sequence mixing, which means that there has been a failure
in maintaining the prioritization principle in the production system when the traceability systems follow that principle. There are two types of data that needs to be collected by the traceability system. Lot-tracing data that records a lot’s movement through different process steps and storage, as well as merging with other lots or
transformation into other lots. The second type of data is process data, which records process information that is vital to, for example, quality assurance. Lot-process linking deals with the linking of the information and the physical lot. The data can either be linked directly with the physical lots identification number or by the date, time and process records. Steele (1995) argues that if the link is made with an identification number it is “tight and accurate”. If the second method is used, the lot and process data can be collected independently and linked only when needed. The problem with this method is that retrieval of data can be very time-consuming.
30
The last element deals with how the data is retrieved from the system. The element is of course dependent on how the information is stored. In addition to this aspects like frequency of access, permitted retrieval time and storage place limitations needs to be addressed.
Golan’s and Steele’s frameworks do not take the impact of traceability tools in consideration. In order to tighten this gap Reggatieri’s product
traceability framework (2007, pp. 350-351) is also explained. Product traceability is divided into four elements.
Lot identification
Data to trace
Product routing
Traceability tools
First of all, lot identification needs to be secured in the traceability system. Relevant physical and mechanical characteristics, as well as, bill of materials etc. need to be available in system. The traceability system also needs to handle data that is collected during the different processes. This element can also include possible confidentiality levels. The data that is handled can also be used to set off alarms when they are not satisfactory. In addition to the lot data and process data the lot routing through the whole supply chain needs to be included in the system in order to trace, for example, which machines or operations the lot have gone through. In order to choose the correct traceability tool different aspects like compatibility with product and processes, degree of automation, data accuracy, reliability, and of course cost.
3.4.2 Integration with an automated production system
The integration of automated traceability in a production system can be carried out by developing a new IT-system, with the purpose of integrating traceability in currently used systems. It is important to investigate if the system that is to be used is capable of handling and routing parts through the various processes. The requirements can be divided into hardware and software requirements. The hardware relates to physical requirements, like what kind of equipment is feasible to use with a certain product as well as how often the products should be read etc. The software requirements take control algorithms, coding techniques, and systems integration into
31
3.5
Traceability method
Traceability relies on that data can be read and provide information
regarding the product. There are many such technologies, but in essence all they do is to facilitate the transferring of information. For example, the transfer of information can be done in plain text or alphanumerical code, optically and electronically readable format and with a variety of other methods. This chapter will focus on technologies that facilitate the transferring of computer readable information, also known as automatic identification and data capture (AIDC), by a variety of technologies. Furthermore, any type of encoding information on some medium has some conflicting requirements according to Pavlidis, et al. (1990):
We want the code to have a high density of information.
We want to be able to read the code reliably.
We want to minimize the cost of printing (In the case of RFID, the cost of the tag).
We want to minimize the cost of the reading equipment. 3.5.1 Automatic Identification and Data Capture (AIDC)
3.5.1.1 Bar codes
Bar codes was introduced in the 1970’s and have spread from supermarkets to department stores, the factory floor, the military, the health industry and much more (Pavlidis, et al., 1990). One dimensional (1D) bar codes which consist of a black and white stripes, has been the carrier of data to track the movement of items through manufacture and the supply chain, so that businesses may calculate production output, control inventory, forecast revenue and analyze other information. But with the increased demand for more product data, as well as the need to use direct part marking
identification (DPMI), for which 1D bar code is inadequate, the
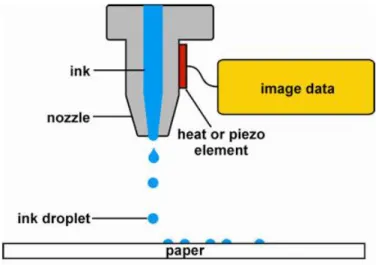
two-dimensional matrix code or 2D bar code is the solution (Rooks, 2005). There are variety of techniques for marking the item with the bar codes, normally the symbol is printed into an adhesive label by thermal transfer, inkjet or laser and then attached to the item (GS1, 2010). But in order to create a permanent marking that will last the entire lifetime of a product, direct part marking (DPM) has become more popular in industrial applications. DPM means that the symbol is printed, embossed or engraved directly different
32
materials including metals, plastics, glass and ceramics. The four most commonly used techniques are inkjet, laser etch, dot-peening and electro-chemical etching (Rooks, 2005).
1D Bar codes
One-dimensional, linear type bar codes encode information along one dimension with intervals of alternating colors, usually black and white. The intervals are actually rectangles whose vertical height carries no information but facilitates the scanning process. The bars must have a darker color than the spaces because the scanner sensor relies on the different amount of reflected light from the bars and spaces (Pavlidis, et al., 1990).
Figure 2 - Structure of a Generic Bar code Symbol (Muller, 2003)
The entire pattern is called the symbol. Each bar and space is called an element, see Figure 2. The bar code consists of several “areas”. From left to right: the quiet zone, start character, data characters, stop character and another quiet zone. The quiet zones on each sides gives the scanner a starting position from which to starts its measurements. In order for the code the be read from either direction or top to bottom or bottom to top in vertically oriented symbol, start and stop characters tells the scanner where the message begins. The data characters are the actual message or
information within the code. These can either be letters, numbers, symbols (+,%,$ etc.), or combination of all three (Muller, 2003). The X dimension is the nominal width dimension of the narrow bars and spaces (Palmer, 2007). For a detailed description of 1D bar code symbologies and how they work, see Appendix 2.
33
2D Bar codes
2D bar codes consist of black and white modules that are alternatively
arranged in the vertical and horizontal direction according to certain rules. It includes a finder pattern, used to identify position, scale, and orientation, see Figure 3 (Qiang, et al., 2012).
Figure 3 - A four segment Data Matrix code symbol (Qiang, et al., 2012)
There are many types of 2D bar codes, but they all allow for a much greater data density than traditional 1D bar codes. For example, the Data Matrix can hold up to 3116 digits or 2335 alphanumerical characters (Rooks, 2005). Conventional 1D bar codes usually functions as keys to a database, where the code is connected to a database where more information can be stored. The 2D codes, can however store all the relevant information in the matrix which enables off-line access to all the relevant information, such as price, product name, manufacturer, weight, inventory data, and expiration date. This is particularly important at distribution centers that receives from and ships to remote warehouses or overseas depots, in which access to the database is limited (Pavlidis, et al., 1992). Another advantage with the 2D bar codes is that it allows for error correction through a redundancy of information, so that it may be successfully decoded when even as much as 60 per cent of the code is damaged. Since the 2D codes consists of pixels, or dots, and offers error correction, it is suitable for direct part marking (DPM) (Rooks, 2005). Other types of 2D bar codes are PDF 417, QR code and Aztec code. The PDF 417, though classified as a 2D bar code, is in fact a multirow, variable length