SKI Report 2005:16
Research
Assessment of Core Failure Limits
for Light Water Reactor Fuel under
Reactivity Initiated Accidents
Lars Olof Jernkvist
Ali R. Massih
December 2004
ISSN 1104–1374 ISRN SKI-R-05/16-SE
Background and purpose of the project
Over the last 10 years the behaviour of nuclear fuel during reactivity initiated accidents has been studied to investigate the failure threshold as a function of burnup. Experimental programmes performed in the CABRI test reactor (France) and in the Nuclear Safety Research Reactor (Japan) have indicated that cladding failure and fuel dispersion of high burnup fuel may occur at enthalpy values lower than previously estimated.
At the beginning of 1995 SKI issued fuel and cladding failure limits based on available test data. It was envisaged at that time that the failure limits should be re-evaluated when more information was available. Since then SKI has joined the OECD-IRSN CABRI water loop project at the end of 2000. The purpose was to gain information on the failure threshold for nuclear fuel cladding as a function of burnup, especially for modern cladding materials and during prototypical conditions.
In 2003 SKI initiated a study, in cooperation with the Swedish nuclear utilities, to recommend more relevant fuel and cladding failure limits for reactivity initiated accidents.
The work presented in this report is the fourth part of the study. In the report core failure thresholds are calculated for high burnup light water reactor fuel by use of best-estimate computational
methods.
In the first part a strain-based failure criterion was formulated based on mechanical tests and
compared with experimental tests and other failure criterion. This is reported in SKI report 2004:32. The second part, which consists of fuel failure thresholds calculated by use of best-estimate
computational methods, is reported in SKI report 2004:33. The third part is a sensitivity study which is reported in SKI report 2004:34.
Results
This project has contributed to the research goal of giving a basis for SKIs supervision by means of evaluating and modelling the nuclear fuel cladding failure threshold during a design base accident. The project has also contributed to the research goal to develop the competence about licensing of fuel at high burnup, which is an important safety issue.
Projekt information
SKI Project Manager: Jan in de Betou Project Identification Number: 200306004
SKI Report 2005:16
Research
Assessment of Core Failure Limits
for Light Water Reactor Fuel under
Reactivity Initiated Accidents
Lars Olof Jernkvist
Ali R. Massih
Quantum Technologies AB
Uppsala Science Park
SE-751 83 Uppsala
Sweden
December 2004
SKI Project Number XXXXX
This report concerns a study which has been conducted for the Swedish Nuclear Power Inspectorate (SKI). The conclusions and viewpoints presented in the report are those of the author/authors and do not necessarily coincide with those of the SKI.
List of contents
Summary... III Sammanfattning... IV
1 Introduction ... 1
2 Background to core failure limits for RIA... 3
2.1 Early pulse reactor tests on fresh and low-burnup fuel ... 3
2.2 Recent pulse reactor tests on high-burnup fuel ... 4
2.3 Mechanisms for dispersal of high-burnup fuel... 4
2.4 Fuel-coolant interaction... 5
3 Analyses ... 9
3.1 Scope of analyses ... 9
3.2 Computational models and methods ... 9
3.2.1 Computer codes ... 9
3.2.2 Computational procedure ... 10
3.2.3 Specific models introduced for the present analyses... 11
3.2.3.1 Fuel pellet high-burnup rim properties... 11
3.2.3.2 Clad-to-coolant heat transfer ... 11
3.2.3.3 Fuel pellet thermal conductivity... 12
3.3 Input... 12
3.3.1 Fuel rod design ... 12
3.3.2 Steady-state base irradiation... 13
3.3.3 Postulated reactivity initiated accidents ... 14
4 Results ... 17
4.1 Calculated fuel rod conditions prior to RIA ... 17
4.1.1 Clad corrosion ... 17
4.1.2 Pellet-clad mechanical interaction... 18
4.1.3 Pellet-clad heat transfer ... 18
4.2 Calculated fuel rod conditions under RIA... 20
4.2.1 Core failure limits... 20
4.2.2 Fuel temperatures at incipient melting ... 21
5 Discussion... 25
5.1 Applicability of calculated core failure limits ... 25
5.2 Evaluation of calculated core failure limits... 27
5.2.1 Comparison with current core failure limit ... 27
5.2.2 Comparison with study done by EPRI/ANATECH ... 28
5.3 Dispersal of high-burnup fuel... 29
6 Conclusions ... 33
List of appendices
Appendix A:Current core failure limit for RIA in Sweden... 40
Appendix B: Failed fuel rods in pulse reactor tests ... 41
B.1 Failed BWR fuel rods... 41
B.2 Failed PWR fuel rods ... 44
B.3 Failed JMTR fuel rods... 46
B.4 Summary of rod failures in pulse reactor tests ... 47
Appendix C: Correlation for fuel solidus temperature... 51
Appendix D: Correlation for fuel thermal conductivity... 53
Appendix E: Power histories and axial power distributions applied in simulations of base irradiation ... 55
Appendix F: Summary of calculated results... 56
Summary
Core failure limits for high-burnup light water reactor UO2 fuel rods, subjected to
postulated reactivity initiated accidents (RIAs), are here assessed by use of best-estimate computational methods. The considered RIAs are the hot zero power rod ejection accident (HZP REA) in pressurized water reactors and the cold zero power control rod drop accident (CZP CRDA) in boiling water reactors. Burnup dependent core failure limits for these events are established by calculating the fuel radial average enthalpy connected with incipient fuel pellet melting for fuel burnups in the range of 30 to 70 MWd(kgU)-1. The postulated HZP REA and CZP CRDA result in lower enthalpies for pellet melting than RIAs that take place at rated power. Consequently, the enthalpy thresholds presented here are lower bounds to RIAs at rated power.
The calculations are performed with best-estimate models, which are applied in the FRAPCON-3.2 and SCANAIR-3.2 computer codes. Based on the results of three-dimensional core kinetics analyses, the considered power transients are simulated by a Gaussian pulse shape, with a fixed width of either 25 ms (REA) or 45 ms (CRDA). Notwithstanding the differences in postulated accident scenarios between the REA and the CRDA, the calculated core failure limits for these two events are similar. The calculated enthalpy thresholds for fuel pellet melting decrease gradually with fuel burnup, from approximately 960 J(gUO2)-1 at 30 MWd(kgU)-1 to 810 J(gUO2)-1 at 70
MWd(kgU)-1. The decline is due to depression of the UO2 melting temperature with
increasing burnup, in combination with burnup related changes to the radial power distribution within the fuel pellets.
The presented fuel enthalpy thresholds for incipient UO2 melting provide best-estimate
core failure limits for low- and intermediate-burnup fuel. However, pulse reactor tests on high-burnup fuel rods indicate that the accumulation of gaseous fission products within the pellets may lead to fuel dispersal into the coolant at significantly lower enthalpies than those required for melting, when the fuel burnup exceeds approximately 40 MWd(kgU)-1. This issue is investigated by reviewing all high-burnup UO2 fuel rods
that have failed in RIA simulation tests in the Japanese Nuclear Safety Research Reactor and the French CABRI pulse reactor to date. Data from thirteen failed rods, with burnups between 44 and 64 MWd(kgU)-1, indicate that clad tube failure does not necessarily lead to fuel pellet dispersal. In fact, the data suggest that a peak fuel radial average enthalpy of at least 500 J(gUO2)-1 is required to expel a significant part (>10 %)
of the fuel inventory into the coolant. However, this empirical enthalpy threshold for fuel dispersal from high-burnup fuel rods cannot be directly applied to light water reactors, since the power pulses and/or the cooling conditions used in the pulse tests differ notably from those expected in LWRs under RIA.
Sammanfattning
I denna rapport används realistiska beräkningsmodeller för att fastställa härdskade-gränser gällande högutbrända urandioxidbränslestavar under postulerade reaktivitets-initierade olyckor (RIA) i lättvattenreaktorer. Två skilda reaktivitetsolyckor beaktas: styrstavsutskjutning vid nolleffekt och varm härd (HZP REA) i tryckvattenreaktorer, samt fallande styrstav vid nolleffekt och kall härd (CZP CRDA) i kokvattenreaktorer. För dessa två fall bestäms utbränningsberoende härdskadegränser genom att beräkna den bränsleentalpi som ger upphov till begynnande smältning av bränslekutsarna. Detta görs för utbränningar från 30 till 70 MWd(kgU)-1. De postulerade reaktivitets-olyckorna vid nolleffekt resulterar i lägre entalpigränser för smältning av bränsle-kutsarna än motsvarande olyckor vid högre reaktoreffekt, vilket medför att de entalpi-gränser som presenteras här utgör undre entalpi-gränser för RIA vid hög reaktoreffekt.
För beräkningarna används “best-estimate”-modeller i beräkningsprogrammen FRAPCON-3.2 och SCANAIR-3.2. Baserat på resultat av tredimensionella härdkinetik-analyser ansätts en Gaussformad effektpuls med en pulsvidd om antingen 25 ms (REA) eller 45 ms (CRDA) för att simulera reaktivitetsolyckan. Trots skillnaderna i postu-lerade förlopp för de två beaktade olyckorna, så är de beräknade härdskadegränserna likartade för de två fallen. De beräknade tröskelentalpierna för bränslesmältning faller gradvis med ökande utbränning, från omkring 960 J(gUO2)-1 vid 30 MWd(kgU)-1 till
810 J(gUO2)-1 vid 70 MWd(kgU)-1. Denna minskning beror på att urandioxidens
smält-punkt sjunker med ökande utbränning, samtidigt som den radiella effektfördelningen i kutsen förändras.
De presenterade entalpigränserna för begynnande smältning av urandioxiden utgör realistiska härdskadegränser för bränsle med måttlig utbränning. Dock visar pulsreaktor-försök utförda på högutbrända bränslestavar att ansamlingen av gasformiga fissions-produkter i bränslekutsarna kan leda till utslungande av bränsle i kylvattnet vid betydligt lägre entalpinivåer, då utbränningen överstiger ungefär 40 MWd(kgU)-1. Detta fenomen undersöks genom att utvärdera samtliga högutbrända bränslestavar med urandioxidkutsar, som till dags dato har havererat under simulerade RIA i puls-reaktorerna NSRR, Japan, och CABRI, Frankrike. Data från tretton havererade stavar, med utbränningar mellan 44 och 64 MWd(kgU)-1, visar att kapslingsskador ej nöd-vändigtvis leder till spridning av bränsle i kylvattnet. Pulsreaktorproven antyder att en bränsleentalpi (radiellt medelvärde för kutsen) överstigande 500 J(gUO2)-1 krävs för
utspridning av en betydande andel (>10 %) av bränsleinventariet i kylvattnet. Denna empiriska entalpigräns för bränsleutspridning från högutbrända bränslestavar kan emellertid ej direkt överföras till lättvattenreaktorer, då de effektpulser och kyl-förhållanden som används vid pulsreaktorproven skiljer sig avsevärt från förväntade förhållanden under reaktivitetsolyckor i lättvattenreaktorer.
1 Introduction
Reactivity initiated accidents (RIAs) are important design basis events in light water reactors (LWRs), which involve inadvertent removal of a control element from the reactor core. In pressurized water reactors (PWRs), the accident scenario of primary concern is the control rod ejection accident (REA). The REA is caused by mechanical failure of a control rod mechanism housing, such that the coolant pressure ejects a control rod assembly completely out of the core (Glasstone & Sesonske, 1991). In boiling water reactors (BWRs), the most severe scenario for RIA is the control rod drop accident (CRDA). The initiating event for the CRDA is the separation of a control rod blade from its drive mechanism. The separation takes place when the blade is inserted in the core, and the detached blade remains stuck in this position until it suddenly becomes loose and drops out of the core in a free fall.
Both the PWR REA and the BWR CRDA result in a rapid power excursion in fuel assemblies close to the failed control element. If the reactivity worth of the ejected control element is high, the rapid energy deposition in adjacent fuel assemblies may be sufficient to cause fuel failure. In order to assure long-term core coolability and to prevent mechanical damage to the reactor pressure vessel from pressure pulses in the coolant during RIA, licensing limits for the fuel pellet enthalpy are prescribed. These limits are intended to ensure core coolability and pressure vessel integrity by precluding fragmentation of the fuel and generation of destructive pressure pulses through violent fuel-coolant interaction. The current core failure limit applied in Sweden for reactivity initiated accidents is presented in appendix A. This limit is based on the results of RIA simulation test, performed in pulse reactors. The power pulses and cooling conditions in these experiment reactors are unfortunately not typical for those expected in commercial light water reactors under an RIA, which makes it difficult to establish failure limits by direct rendition of test data.
The work presented in this report is aimed at establishing core failure limits for high-burnup light water reactor fuel rods under RIA by use of best-estimate computer analyses. Core failure limits are calculated for two hypothetical reactivity initiated accidents in light water reactors: the hot zero power (HZP) rod ejection accident in pressurized water reactors, and the cold zero power (CZP) control rod drop accident in boiling water reactors. The failure limits are established by calculating the fuel enthalpy connected with incipient fuel pellet melting for fuel burnups in the range of 30 to 70 MWd(kgU)-1. The calculations are performed with best-estimate computational models, but penalizing assumptions are made in input to the analyses, in order to account for uncertainties associated with high-burnup fuel behaviour under fast power transients. The organization of the report is as follows:
The background to the existing core failure limit for RIA is presented in section 2, where also a brief introduction to the physical phenomena related to fragmentation and dispersal of nuclear fuel under RIA is given.
The computational models and methods applied in analyses are described in section 3, together with the assumptions made about fuel rod design, steady-state base irradiation conditions and the postulated reactivity initiated accidents.
Section 4 contains the results of the performed analyses. Calculated burnup dependent fuel rod conditions prior to RIA, such as clad corrosion and pellet-clad gap conditions, are first presented in section 4.1. These calculated conditions serve as input to the analyses of the actual RIA, the results of which are compiled in section 4.2. Here, the calculated core failure limits are presented, together with data on the fuel temperature distribution at the time of incipient melting.
The calculated core failure limits are discussed and evaluated in section 5 of the report, where comparisons are made with the current core failure limit for RIA in Sweden. A comparison is also made with a recent study by the Electric Power Research Institute in the USA, in which a core failure limit for high-burnup pressurized water reactor fuel has been calculated with methods similar to those used in our study. Finally, we also summarize the experience gained from pulse reactor tests, concerning dispersal of solid fuel particles from failed high-burnup fuel rods.
2 Background to core failure limits for RIA
2.1 Early pulse reactor tests on fresh and low-burnup fuel
In the late seventies, the United States Nuclear Regulatory Commission (US NRC) established two acceptance criteria for reactivity initiated accidents, based on results from RIA simulation tests performed on fresh and low-burnup fuel rods in pulse reactors (MacDonald, et al., 1980). These criteria, the details of which are given in (RG-1.77, 1974) and (NUREG-0800, 1981), have been used worldwide in their original or slightly modified forms:
Firstly, a fuel rod failure threshold was defined, stating that clad failure should be assumed in fuel rods that experience radially averaged fuel enthalpies above 170 cal(gUO2)-1 (712 J(gUO2)-1) at any axial location. This failure threshold is used in
evaluations of radiological consequences of escaped fission products from failed rods, and it is not a definite operating limit. Hence, fuel enthalpies above this threshold are allowed in some of the fuel rods during an RIA. The failure threshold is applicable to RIA events initiated from zero or low power, i.e. in practice to BWR RIA at CZP conditions. For RIAs taking place at rated power conditions, fuel rods that experience dry-out (BWR) or departure from nucleate boiling (PWR) should be assumed to fail. Secondly, a core failure limit was defined, stating that the radial average fuel enthalpy may not exceed 280 cal(gUO2)-1 (1172 J(gUO2)-1) at any axial location in any fuel rod.
Fuel enthalpies above this limit were experimentally found to cause UO2 fuel melting,
fragmentation of the cladding and violent expulsion of the molten fuel into the coolant water. This failure process is primarily caused by volumetric expansion of UO2, when
the material changes from solid to liquid phase. The expulsion of molten fuel led to energetic fuel-coolant interaction, involving fragmentation of the fuel pellets into fine particles and generation of pressure pulses in the coolant. Consequently, the core failure limit was set to 280 cal(gUO2)-1 in order to ensure core coolability and reactor pressure
vessel integrity by precluding the expulsion of molten fuel particles into the coolant. Unfortunately, this core failure limit was actually set in error: As noted by MacDonald et al. (1980), the US NRC mistakenly expressed the limit in terms of radial average peak fuel enthalpy, whereas the supporting experimental data were reported in terms of radial average total energy deposition. The radial average peak fuel enthalpy is less than the associated radial average total energy deposition, due to fuel-to-coolant heat transfer under the power transient, and also since a large fraction of the total energy is due to delayed fission. If this mistake is corrected, the core failure limit is reduced to 230 cal(gUO2)-1 (963 J(gUO2)-1). This is the value currently applied in Sweden as core
failure limit for low- and intermediate-burnup fuel under reactivity initiated accidents; see appendix A. For high-burnup fuel, the current core failure limit applied in Sweden is significantly reduced from this value, based on observations made in more recent pulse reactor tests. This is further discussed in the sequel.
2.2 Recent pulse reactor tests on high-burnup fuel
RIA simulation tests carried out on high-burnup fuel rods in the French CABRI test reactor and the Japanese Nuclear Safety Research Reactor (NSRR) during the last decade have shown that a potential exists for dispersal of non-molten fuel fragments at fuel radial average enthalpies well below 800 J(gUO2)-1 (Sugiyama & Fuketa, 2000).
More precisely, dispersal of non-molten fuel has to date been observed in nine pulse reactor tests on light water reactor fuel rods, ranging in burnup from 44 to 64 MWd(kgU)-1. These rods were subjected to power pulses with peak radial average fuel enthalpies between 306 and 657 J(gUO2)-1 in the CABRI reactor and the NSRR.
A compilation of data on all pre-irradiated fuel rods that have failed in RIA simulation tests up to December 2004 is given in appendix B.
In summary, the tests reviewed in appendix B indicate that mechanisms other than fuel melting may lead to dispersal of fragmented fuel into the coolant, when the fuel burnup exceeds approximately 40 MWd(kgU)-1. This finding raises concerns about the core coolability, since the dispersal of non-molten fuel particles may lead to loss of coolable fuel geometry, generation of detrimental pressure pulses in the coolant, and possibly also to flow blockage in some fuel assemblies. These potential consequences are related to the amount, thermal energy and particle size of the fuel material dispersed into the coolant.
2.3 Mechanisms for dispersal of high-burnup fuel
In ceramographic examinations of UO2 fuel that has undergone RIA simulation tests in
pulse reactors, it is usually found that the outer part of the fuel pellet is severely fragmented (Lespiaux et al., 1997) and (Fuketa et al., 2000). Typically, a large number of radial cracks are seen at the pellet surface, and these cracks extend a few millimetres towards the pellet centre. These fairly long cracks are probably caused by tensile hoop stresses during cool-down of the pellet periphery, i.e. the cracks nucleate fairly late in the transient. In some cases, circumferential macroscopic cracks are also found at the boundary between the re-structured rim zone (see below) and the subjacent part of the pellet. These cracks are most likely caused by tensile radial stresses during the early heat-up phase.
The radial and circumferential cracks described above create fairly large fuel fragments, which are not so easily expelled through cladding cracks in a failed fuel rod. However, in high-burnup fuel, much finer fragments are usually observed along the periphery of the pellet. These fragments are believed to result from grain decohesion, caused by overpressurization of gas-filled pores and intergranular gas bubbles under rapid rise in temperature (Lemoine, 1997). The resulting fragments are very small, typically about 50 µm, and can therefore be more easily expelled through cladding cracks in a failed fuel rod (Lespiaux et al., 1997) and (Fuketa et al., 1997). Hence, post-failure fuel dispersal is promoted by this fragmentation mechanism, which is typical of high-burnup fuel.
Of particular importance to the grain boundary decohesion is the formation of a typical high-burnup microstructure (rim zone) at the pellet periphery.
As a consequence of accumulated fission products, enhanced local burnup and fission rate in combination with low temperature, a restructuring of the fuel material takes place at the pellet peripheral rim in high-burnup fuel. Formation of this rim zone microstructure is characterized by a simultaneous reduction in grain size, increase in porosity and depletion of fission gas from the UO2 matrix (Jernkvist & Massih, 2002).
The rim zone microstructure, with its high density of grain boundaries and gas-filled pores, is therefore sensitive to fragmentation by grain boundary decohesion under RIA. The rim zone formation starts at a local burnup1 of 60-70 MWd(kgU)-1 by subdivision of grains at the fuel pellet outer surface, and at pores and bubbles close to the surface. The progression of the restructuring process, and the inward propagation of the rim zone towards the pellet centre, is controlled by the radial distributions of both fissile material and temperature. In commercial LWR fuel, the radial width of the rim zone is usually less than 200 µm, which means that the rim zone constitutes less than 10 % of the total fuel volume.
The current core failure limit for reactivity initiated accidents in Sweden is set with consideration of the increased potential for dispersal of non-molten fuel fragments from failed high-burnup fuel rods. As shown in appendix A, the core failure limit is reduced to 100 cal(gUO2)-1 at a fuel burnup of 45.4 MWd(kgU)-1, and beyond this burnup, the
core failure limit coincides with the fuel rod failure threshold (SKI, 1995). Hence, beyond 45.4 MWd(kgU)-1, the current core failure limit is based on the assumption that a significant part of the fuel inventory of the rod is dispersed into the coolant following clad tube failure.
2.4 Fuel-coolant interaction
As mentioned in section 2.1, the core failure limit is intended to ensure long-term core coolability and to preclude damage to the reactor pressure vessel and internal core structures. Scenarios for loss of long-term core coolability after an RIA involve loss of coolable fuel geometry, for instance by melting, fragmentation or ballooning of the fuel rods. A coolable fuel geometry may also be lost if large amounts of fuel pellet fragments are dispersed into the coolant under RIA. Firstly, the dispersed fuel particles themselves may block flow channels and impair long-term cooling, or simply pile up at the bottom of the core in a configuration not amenable to cooling. Secondly, the dispersed fuel particles interact thermally with the coolant. The fuel-coolant interaction (FCI) could generate pressure waves in the coolant, which may damage nearby fuel assemblies and possibly also other core structures and the reactor pressure vessel (Berthoud, 2000).
To the author’s knowledge, attempts to study the process of multi-rod failure by generation of coolant pressure waves have been made in only one RIA simulation test. This test, known as RIA 1-4, was carried out on a 3×3 array of PWR fuel rods in the Power Burst Facility (PBF) at the Idaho National Laboratory in the late seventies (Cook & Martinson, 1984).
The test rods were pre-irradiated to a burnup of 4-6 MWd(kgU)−1, after which they were subjected to a 11 ms wide power pulse in the PBF, resulting in peak radial average fuel enthalpies in the range of 980 to 1160 J(gUO2)−1. All the rods failed by axial cracks,
induced by pellet-clad mechanical interaction, and one of the rods also experienced partial melting of the clad tube. However, no fuel material was dispersed into the coolant and detrimental pressure waves were therefore not generated. Consequently, the test failed to demonstrate the propagation of fuel rod damage from a failed rod to its neighbours by fuel dispersal and pressure wave generation. Further tests are therefore warranted to elucidate this hypothetical damage mechanism.
By convention, the degree of fuel-coolant interaction is quantified with the energy con-version ratio, which is the ratio of the kinetic energy generated in the coolant to the thermal energy in the dispersed fuel. This ratio can be determined in pulse reactor tests, where the mechanical energy generated in the coolant is estimated by measuring the motion of the water column in the test rig, as it is raised by rapid expansion of steam bubbles around dispersed fuel fragments.
Energetic FCI, known as vapour explosions, may take place when molten fuel is dispersed into water. In vapour explosions, the timescale for heat transfer from the molten fuel to the coolant is shorter than the timescale for pressure relief. Therefore, the local surge in coolant pressure forms a shock wave, which propagates with a velocity greater than the characteristic speed of sound in the coolant ahead of the shock front (Berthoud, 2000). The key feature of a vapour explosion is that the shock wave propagation through the coolant drives the rapid fuel fragmentation and associated heat transfer to the coolant, on the analogy of shock heating in a chemical detonation. In practise, fuel-coolant interaction does not generally exhibit these shock wave characteristics. The fragmentation of dispersed fuel particles is not necessarily linked to shock wave propagation, and the rapid boiling phenomenon propagates slower than the speed of sound. Although the character of the FCI is not explosive in this case, a large amount of vapour may be produced and detrimental pressure transients generated.
An upper limit for the energy conversion ratio under FCI can be calculated from thermodynamics, by assuming ideal mixing and isentropic expansion of the fuel-coolant mixture (Corradini et al., 1988). The energy conversion ratio depends on the ratio between fuel and coolant volumes involved in the process, but for molten UO2 fuel
dispersed into water at typical PWR conditions, the ideal conversion ratio is greater than 10 % for a wide range of fuel-to-coolant volume ratios. Much lower values are generally obtained in experiments (Berthoud, 2000). In particular, early RIA simulation tests on fresh fuel have shown that energy conversion ratios may reach up to about 1 %, when molten fuel is dispersed into water (Tsuruta et al., 1985). More recent tests in the NSRR have shown that about the same energy conversion ratios are reached, when solid high-burnup fuel is dispersed into water (Sugiyama & Fuketa, 2000). This is a somewhat controversial result, since the energy transfer to the water is generally believed to be more efficient for molten than for solid fuel particles. This follows from the fact that molten fuel particles are more easily fragmented than solid particles, when dispersed into water. The conversion ratio is higher for fine particles, since the specific surface (surface to volume ratio) is larger.
However, the results of the recent NSRR tests can be understood from the fact that conversion ratios for both molten and solid fuel depend on the initial size of the dispersed particles. As discussed in the previous section, the solid fuel particles that are expelled from high-burnup fuel rods are typically about 50 µm in size (Nakamura et al., 2002a). This should be compared with molten low-burnup fuel particles, which are at least about an order of magnitude larger (Tsuruta et al., 1985). Considering these differences in dispersed particle size between molten low-burnup and solid high-burnup fuel, the energy conversion ratio for the dispersed particles seems to be comparable for low- and high-burnup fuel. Consequently, it seems possible to correlate the mechanical energy generated in the coolant solely to the amount and enthalpy of the dispersed fuel, without discriminating between low-burnup molten fuel and high-burnup solid material. The energy conversion ratios discussed above have been measured in water at room temperature and atmospheric pressure. The results are thus applicable to RIA at cold zero power conditions in a BWR, but not necessarily to hot zero power conditions in a PWR. As further discussed in section 5.3, the interaction between dispersed fuel and water is affected by the coolant temperature and pressure.
Finally, it should be remarked that pressure waves can in fact be generated without fuel dispersal, by release of the plenum gas inventory from failed fuel rods. However, experiments have shown that mechanical energy deposition from leaking gas is moderate in comparison with that from thermal interaction between dispersed fuel and the coolant (Sugiyama & Fuketa, 2000).
3 Analyses
The computational procedures and input data applied in this work are almost identical to those used in a companion assessment of fuel rod failure thresholds for RIA by Jernkvist and Massih (2004). The major difference between the two studies is in the applied failure criteria.
3.1 Scope of analyses
The hypothetical reactivity initiated accidents considered in this report are the hot zero power rod ejection accident in pressurized water reactors and the cold zero power control rod drop accident in boiling water reactors. In both these scenarios, mechanical failure of a control rod drive mechanism leads to a prompt power excursion, which initiates from near zero power conditions and terminates by negative feedback from the fuel temperature rise (Doppler effect). The power pulse widths considered in analyses are 25 ms for the PWR HZP REA and 45 ms for the BWR CZP CRDA; see section 3.3.3 for further details on the assumptions made about the reactivity initiated accidents. The thermo-mechanical response of typical PWR and BWR fuel rods to these transients is analysed, using best-estimate computational models. Best-estimate core failure limits for PWR HZP REA and BWR CZP CRDA, in terms of peak radial average fuel enthalpy that can be sustained under RIA without fuel pellet melting, are calculated for fuel burnups in the range of 30 to 70 MWd(kgU)-1. The upper end of this interval corresponds to the highest burnups, for which the computer codes and models applied in analyses have been verified with experimental data (Lanning et al., 1997). The computational models and methods are described in section 3.2 below, and key input is defined in section 3.3. The applicability of the calculated failure limits is discussed in section 5.1, where also the limitations of the performed analyses are defined.
3.2 Computational models and methods
3.2.1 Computer codes
The fuel rod thermo-mechanical behaviour under RIA is analysed by use of the SCANAIR-3.2 computer code (Federici et al., 2000). Since SCANAIR lacks models for simulation of long-term steady-state irradiation, the SKI-version of the FRAPCON-3.2 steady-state fuel performance code is used to establish burnup dependent initial conditions to the transient analyses (Berna et al., 1997). This version of FRAPCON-3.2 is equipped with an interface to SCANAIR-3.2 (Jernkvist, 2002). Both SCANAIR and FRAPCON are best-estimate computational tools, and throughout the performed analyses, the computer codes are used with their default best-estimate models. For the purpose of our analyses, however, the model for UO2 thermal conductivity in
SCANAIR is slightly modified, and some specific models are also added to the codes. These modifications and extensions are described in section 3.2.3 below.
3.2.2 Computational procedure
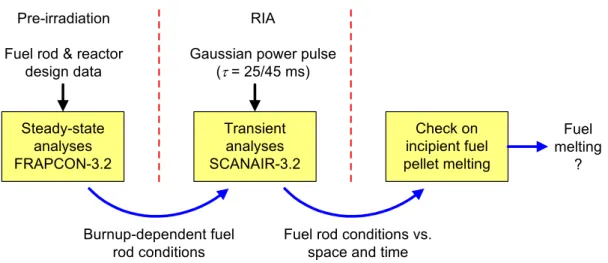
The computer codes described above are used for determining burnup dependent core failure limits in terms of enthalpy thresholds for incipient fuel pellet melting under PWR HZP REA and BWR CZP CRDA. Both limits are determined by the same procedure, as illustrated in figure 3.1. First, a generic base irradiation history is simulated by FRAPCON-3.2 up to a desired fuel burnup, in order to generate burnup dependent fuel rod initial conditions needed for transient analysis with SCANAIR-3.2. With these initial conditions, SCANAIR is then used to analyse the fuel rod response to the reactivity initiated event, which is represented by a Gaussian power pulse with a fixed width of either 25 ms (PWR) or 45 ms (BWR). These pulse widths are selected based on the results of three-dimensional core kinetics analyses of RIA, as described in section 3.3.3. The pulse amplitude is taken as a free parameter, and SCANAIR is run in an iterative loop in order to determine the pulse amplitude at which incipient fuel pellet melting is predicted. Once this critical pulse amplitude is found, iterations are terminated and the corresponding threshold fuel enthalpy is recorded in a diagram with respect to fuel burnup. By repeating this FRAPCON-SCANAIR analysis procedure for about 10 burnup levels in the range of 30 to 70 MWd(kgU)-1, a burnup dependent enthalpy limit for incipient fuel melting is determined. The failure limit is reported in terms of peak radial average enthalpy under the pulse, as a function of pellet radial average burnup at the axial position of the rod where melting is imminent.
The full-length fuel rod is modelled in all analyses with FRAPCON and SCANAIR. The same axial discretization, consisting of 10 equal-length axial segments, is used for both computer codes. In analyses with SCANAIR, the pellet melt criterion is applied to each of the 10 axial segments of the discretized fuel rod. However, pellet melting is predicted always to occur at the axial position of peak power, which is the 9th and 6th axial segment from the bottom of the rod for the PWR and BWR fuel rod, respectively.
Steady-state analyses FRAPCON-3.2 Transient analyses SCANAIR-3.2 Check on incipient fuel pellet melting Pre-irradiation
Fuel rod & reactor design data
RIA
Gaussian power pulse (τ = 25/45 ms) Fuel melting ? Burnup-dependent fuel rod conditions
Fuel rod conditions vs. space and time
3.2.3 Specific models introduced for the present analyses
3.2.3.1 Fuel pellet high-burnup rim properties
The models for fission gas release and pellet gas-induced deformations applied in the SCANAIR-3.2 computer code require detailed information about the burnup dependent variation in material microstructure along the fuel pellet radius. Of particular interest is the formation of a characteristic high-burnup microstructure at the pellet periphery, as discussed in section 2.3. The formation of a high-burnup rim zone is not modelled in FRAPCON-3.2, and the microstructural data required for the rim zone by SCANAIR are therefore estimated from experimental studies reported in literature as follows: The width of the rim zone, wRim [µm], is in all analyses with SCANAIR correlated to the pellet radial average burnup, Eav [MWd(kgU)-1], through
(
)
⎩ ⎨ ⎧ < < − ⋅ ≤ = − . E E . , E w av . av av Rim 427 10 35 35 70 35 0 41 2 2 (3.1)Equation (3.1) is a fit to optical microscopy data from post-irradiation examinations of commercial PWR fuel rods, presented by Manzel and Walker (2000; 2002). The material within the rim zone is assumed to have a uniform microstructure, the properties of which are defined in table 3.1. These properties are compiled from several studies on rim zone formation, which have been reviewed by Jernkvist and Massih (2002).
Fuel material property Rim zone Low-burnup
Density [ kgm-3 ] 9670 10250 Porosity (volume fraction) [ - ] 0.10 0.04 Grain size [ µm ] 0.3 10 Intergranular bubble size [ nm ] 2.0 20
Table 3.1: Rim zone microstructural properties applied in analyses with SCANAIR-3.2. Typical properties of low-burnup UO2 fuel are also given for reference.
3.2.3.2 Clad-to-coolant heat transfer
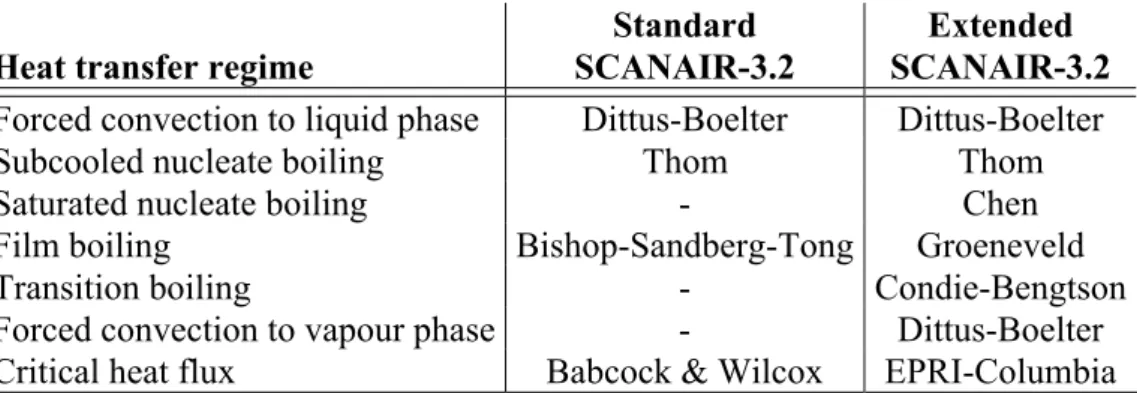
Models in the SCANAIR-3.2 computer code cater for heat transfer from the clad tube to the surrounding coolant, consisting of either liquid sodium or liquid water (Federici et al., 2000). For the purpose of our analyses, we have equipped SCANAIR-3.2 with an extended coolant channel model, allowing for two-phase flow and thus for simulations of BWR operating conditions. In the extended model, which is fashioned after the coolant channel model in the FRAPTRAN computer code (Cunningham et al., 2001), the two-phase water coolant is treated as a homogeneous mixture of liquid and steam in thermodynamic equilibrium. The model has an extended set of clad-to-water heat transfer correlations, which is applicable to both PWR and BWR conditions. In table 3.2, the new set of correlations is compared with the standard models for clad-to-water heat transfer in SCANAIR-3.2. Most of the correlations in table 3.2 are described in a review of heat transfer correlations for light water reactor application, which has recently been published by the IAEA (2001).
Heat transfer regime
Standard SCANAIR-3.2
Extended SCANAIR-3.2
Forced convection to liquid phase Dittus-Boelter Dittus-Boelter Subcooled nucleate boiling Thom Thom Saturated nucleate boiling - Chen Film boiling Bishop-Sandberg-Tong Groeneveld Transition boiling - Condie-Bengtson Forced convection to vapour phase - Dittus-Boelter Critical heat flux Babcock & Wilcox EPRI-Columbia
Table 3.2: Clad-to-water heat transfer correlations used in SCANAIR-3.2. For a description of these correlations, see (IAEA, 2001).
3.2.3.3 Fuel pellet thermal conductivity
Two thermo-physical properties of the fuel pellets are of particular importance, when assessing enthalpy limits for fuel pellet melting under RIA: the solidus (melting) temperature and the thermal conductivity. The model for UO2 solidus temperature in
SCANAIR-3.2 is described and shortly reviewed in appendix C. In the present analyses, the model is used without modifications.
The model for UO2 thermal conductivity in SCANAIR-3.2, however, was slightly
modified for the purpose of our analyses. As described in appendix D, the modification was made since the model was found to overestimate recent experimental data on thermal conductivity of un-irradiated UO2 by Ronchi et al. (1999).
3.3 Input
The input data to our thermo-mechanical analyses of postulated RIAs are partly based on core kinetics analyses, which were performed with the three-dimensional time-dependent neutronics code SIMULATE-3K by Vattenfall and OKG in an earlier part of this project, and we therefore apply much the same input as was used in these analyses. Hence, for the postulated rod ejection accident in PWRs, we assume the same fuel design and core conditions as applied by Gabrielson (2004) in analyses of HZP REA in Ringhals 3, a 3-loop PWR of Westinghouse design. For the postulated control rod drop accident in BWRs, we assume the same fuel design and core conditions as applied by Wiksell (2003) in analyses of CZP CRDA in Oskarshamn 3, an internal pump BWR of ASEA-ATOM design. It should be noticed, that the input used in the present analyses is identical to that applied in our companion assessment of fuel rod failure thresholds for RIA (Jernkvist & Massih, 2004).
3.3.1 Fuel rod design
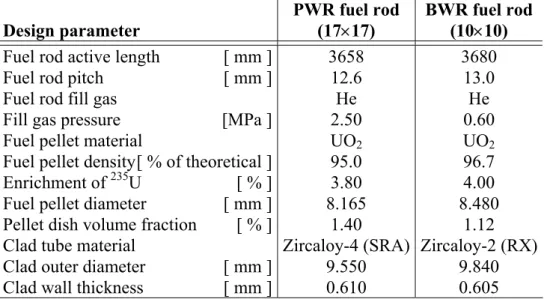
The fuel considered in analyses of PWR HZP REA is a standard 17×17 design (Gabrielson, 2004). In analyses of BWR CZP CRDA, the fuel design is 10×10 (Wiksell, 2003). Key properties of these fuel designs are summarized in table 3.3.
Design parameter PWR fuel rod (17×17) BWR fuel rod (10×10)
Fuel rod active length [ mm ] 3658 3680 Fuel rod pitch [ mm ] 12.6 13.0 Fuel rod fill gas He He Fill gas pressure [MPa ] 2.50 0.60 Fuel pellet material UO2 UO2
Fuel pellet density [ % of theoretical ] 95.0 96.7 Enrichment of 235U [ % ] 3.80 4.00 Fuel pellet diameter [ mm ] 8.165 8.480 Pellet dish volume fraction [ % ] 1.40 1.12 Clad tube material Zircaloy-4 (SRA) Zircaloy-2 (RX) Clad outer diameter [ mm ] 9.550 9.840 Clad wall thickness [ mm ] 0.610 0.605
Table 3.3: Fuel rod designs considered in analyses. SRA: Stress relieved annealed. RX: Recrystallized. 3.3.2 Steady-state base irradiation
The steady-state base irradiation is simulated by use of FRAPCON-3.2. Core cooling conditions corresponding to nominal conditions in the Ringhals 3 PWR and the Oskars-hamn 3 BWR are assumed in these simulations; see table 3.4. The postulated steady-state power histories and axial power distributions are given in appendix E. The axial power distributions are assumed not to change during the irradiation history.
For the PWR fuel rod, a rod average linear heat generation rate (LHGR) of 23 kWm-1 is assumed for the first 290 effective full power days of operation, followed by a linear decrease in power with time, ending at 8.73 kWm-1 after 2000 days of reactor operation. A similar base irradiation is assumed for the BWR fuel rod: following 250 effective full power days at a constant rod average LHGR of 25 kWm-1, the power decreases linearly with time, ending at 8.17 kWm-1 after 1800 days.
Parameter PWR BWR
Nominal thermal power [ MW ] 2775 3020 Average linear heat generation rate [ kWm-1] 18.3 12.7 Coolant pressure [ MPa ] 15.5 7.0 Coolant inlet temperature [ K ] 557 550 Subchannel mass flow [ gs-1 ] 327.5 174.6 Subchannel mass flux [ kg(m2s)-1 ] 3759 1878
Table 3.4: Core conditions applied in simulations of fuel rod base irradiation. These are nominal conditions of the Ringhals 3 and Oskarshamn 3 power plants,
3.3.3 Postulated reactivity initiated accidents
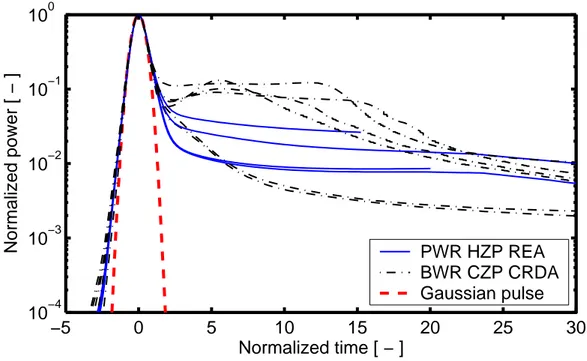
The assumptions made about the reactivity initiated accidents in our analyses with SCANAIR-3.2 are based on the results of three-dimensional core kinetics analyses reported by Gabrielson (2004) and Wiksell (2003). Their analyses of postulated RIAs with SIMULATE-3K provided a spectrum of power pulses, with large variations in shape. This is illustrated in figures 3.2 and 3.3, which show calculated pulse widths and normalized pulse shapes from the performed analyses of HZP REA and CZP CRDA (In de Betou et al., 2004).
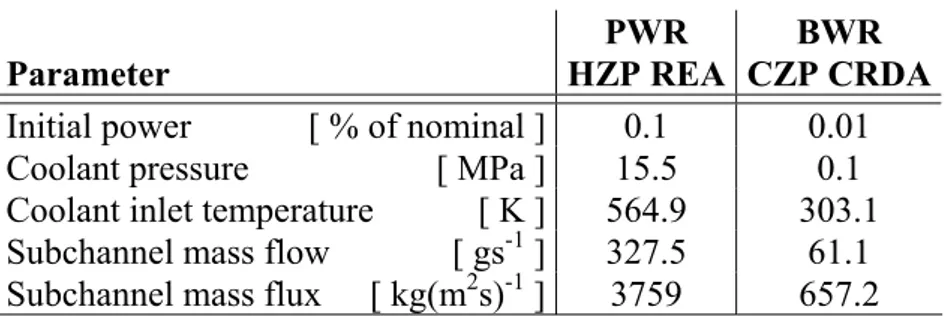
To avoid the use of multiple pulse shapes in analyses of the thermo-mechanical fuel rod behaviour under RIA, a Gaussian power pulse is used in all analyses with SCANAIR. As shown in figure 3.3, the Gaussian pulse constitutes an envelop to the calculated pulse shapes. Moreover, the full width at half maximum of the applied Gaussian power pulse is set to 25 ms in analyses of HZP REA and to 45 ms in analyses of CZP CRDA. These pulse widths are taken from the lower end of the results presented in figure 3.2. The core conditions applied under RIA are defined in table 3.5. They are identical to the conditions used in the core kinetics analyses by Gabrielson (2004) and Wiksell (2003). It should be noticed that the very low initial rod power leads to fuel and clad tube temperatures, prior to RIA, that are very close to the coolant inlet temperature. Moreover, the coolant outlet temperature does not differ notably from the inlet temperature.
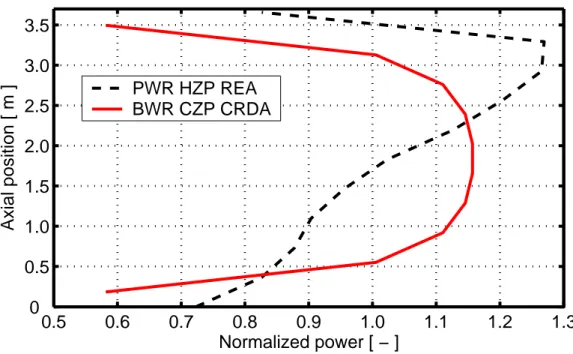
The distributions of generated power along the fuel rod under the considered RIAs are prescribed in a penalizing manner, and do not reflect the true power distribution. The axial power distributions postulated for the PWR HZP REA and the BWR CZP CRDA in our analyses are shown in figure 3.4. The power distributions, which are assumed not to change during the transient, closely follow the calculated axial variations in clad oxide layer thickness along the fuel rods. Accordingly, the peak power under RIA is concentrated at the axial position of peak clad corrosion. As a consequence of these postulated axial power distributions, fuel pellet melting is predicted always to occur at the axial position of peak clad corrosion. This results in conservative estimates of the core failure limit, since the calculated enthalpy for fuel pellet melting decreases slightly with increasing oxide thickness. This is further discussed in section 5.1. Parameter PWR HZP REA BWR CZP CRDA
Initial power [ % of nominal ] 0.1 0.01 Coolant pressure [ MPa ] 15.5 0.1 Coolant inlet temperature [ K ] 564.9 303.1 Subchannel mass flow [ gs-1 ] 327.5 61.1 Subchannel mass flux [ kg(m2s)-1 ] 3759 657.2
Table 3.5: Core conditions applied in simulations of reactivity initiated accidents. The coolant subchannel pertains to a single fuel rod.
0 200 400 600 800 1000 0 10 20 30 40 50 60 70 80
Prompt reactivity insertion, ∆ρ − β [ 10−5 ]
Calculated pulse width [ ms ]
PWR HZP REA BWR CZP CRDA
Figure 3.2: Calculated pulse widths. Here,
∆ρ
is the inserted reactivity, andβ
is the delayed neutron fraction (In de Betou et al., 2004).−5 0 5 10 15 20 25 30 10−4 10−3 10−2 10−1 100 Normalized time [ − ]
Normalized power [ − ] PWR HZP REA
BWR CZP CRDA Gaussian pulse
Figure 3.3: Calculated power pulses from three-dimensional core kinetics analyses in comparison with Gaussian pulse. The pulses are normalized (In de Betou et al., 2004).
0.5 0.6 0.7 0.8 0.9 1.0 1.1 1.2 1.3 0 0.5 1.0 1.5 2.0 2.5 3.0 3.5 Normalized power [ − ] Axial position [ m ] PWR HZP REA BWR CZP CRDA
Figure 3.4: Fuel rod axial power distributions assumed under postulated RIAs. The power distributions are postulated in a penalizing manner, such that peak
4 Results
Calculated burnup dependent fuel rod conditions prior to RIA are given in section 4.1. These calculated conditions serve as input to the transient analyses of the actual RIA, the results of which are compiled in section 4.2.
4.1 Calculated fuel rod conditions prior to RIA
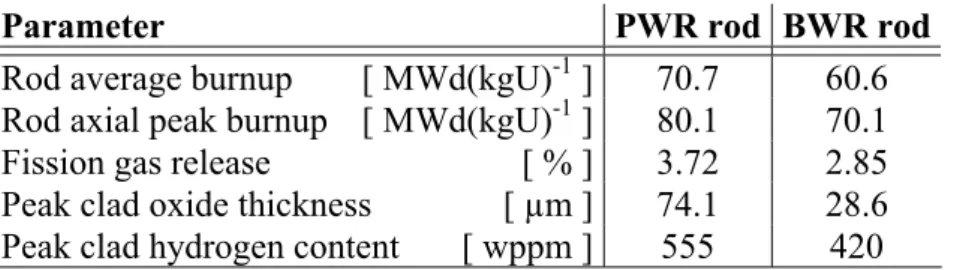
Key results from the simulated base irradiation of the PWR and BWR fuel rods are summarized in table 4.1. The simulations were performed with the FRAPCON-3.2 computer code, using best-estimate models.
Parameter PWR rod BWR rod
Rod average burnup [ MWd(kgU)-1 ] 70.7 60.6 Rod axial peak burnup [ MWd(kgU)-1 ] 80.1 70.1 Fission gas release [ % ] 3.72 2.85 Peak clad oxide thickness [ µm ] 74.1 28.6 Peak clad hydrogen content [ wppm ] 555 420
Table 4.1: Calculated fuel rod properties at end of base irradiation.
The calculated evolution of clad corrosion and pellet-clad gap conditions are presented in the sequel. These data pertain to the rod axial segment at which fuel pellet melting is predicted to occur, i.e. to the axial position of peak power and peak clad corrosion; confer section 3.3.3. For the PWR fuel rod, this is the 9th axial segment out of 10, corresponding to an axial elevation of 2.9-3.3 m from bottom of the rod. For the BWR fuel rod, fuel pellet melting is predicted to occur in the 6th axial segment of the rod, corresponding to an axial elevation of 1.8-2.2 m.
4.1.1 Clad corrosion
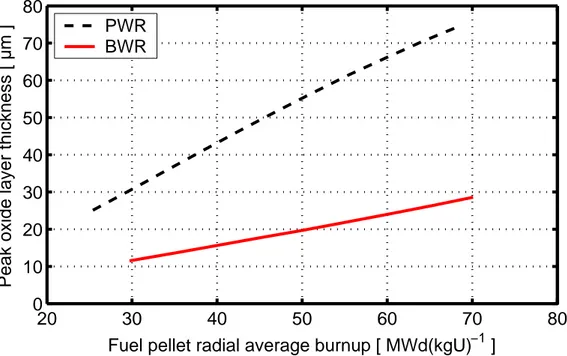
Figure 4.1 shows the calculated local clad oxide thickness with respect to local burnup in the peak oxide axial segment of the PWR and BWR fuel rods. The corrosion is calculated by use of best-estimate models for standard Zircaloy-2 and Zircaloy-4 cladding in FRAPCON-3.2 (Berna et al., 1997).
20 30 40 50 60 70 80 0 10 20 30 40 50 60 70 80
Fuel pellet radial average burnup [ MWd(kgU)−1 ]
Peak oxide layer thickness [ µm ]
PWR BWR
Figure 4.1: Local clad oxide layer thickness with respect to local burnup in the peak oxide axial segment, calculated with best-estimate models in FRAPCON-3.2. 4.1.2 Pellet-clad mechanical interaction
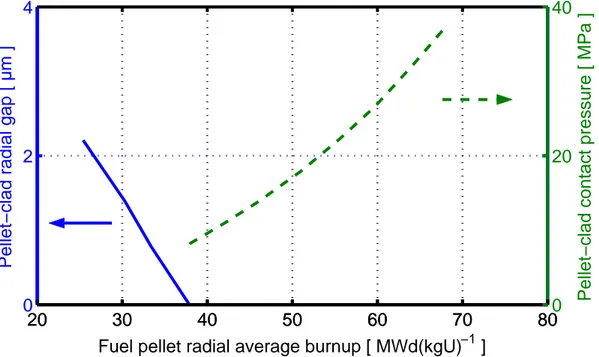
Figures 4.2 and 4.3 show the calculated radial pellet-clad gap size and contact pressure prior to RIA with respect to local burnup in the peak oxide axial segment of the PWR and BWR fuel rod, respectively. Hence, the presented gap conditions are calculated at hot zero power for the PWR rod, and at cold zero power for the BWR rod. Obviously, the pellet-clad gap closes at a burnup of 38 MWd(kgU)-1 in the PWR fuel rod, whereas it remains open up to 60 MWd(kgU)-1 in the BWR rod. This is partly due to the difference in clad creep down between PWR and BWR fuel rods, but also the difference in pre-transient coolant pressure (15.5 and 0.1 MPa, respectively) contributes to the disparity in initial pellet-clad gap size.
4.1.3 Pellet-clad heat transfer
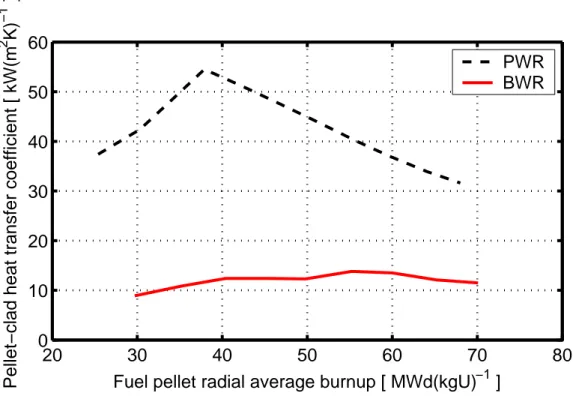
Figure 4.4 shows the calculated pellet-clad heat transfer coefficient prior to RIA with respect to local burnup in the peak oxide axial segment of the PWR and BWR fuel rods. The heat transfer coefficient is significantly higher for the PWR fuel rod, which is due mainly to the difference in initial temperature of the gap gas between the PWR and BWR fuel rod. As shown in table 3.5, both the initial coolant temperature and fuel rod power is higher for the PWR fuel rod, which results in higher temperature and improved thermal conductivity for the gas within the pellet-clad gap.
20 30 40 50 60 70 80 0
2 4
Fuel pellet radial average burnup [ MWd(kgU)−1 ]
Pellet−clad radial gap [ µm ]
20 30 40 50 60 70 800
20 40
Pellet−clad contact pressure [ MPa ]
Figure 4.2: Calculated pre-transient pellet-clad radial gap size and contact pressure with respect to local burnup in the peak oxide axial segment of the PWR fuel rod. The gap is calculated at hot zero power, as defined in table 3.5: i.e. for near zero
power, coolant pressure of 15.5 MPa and coolant temperature 565 K.
20 30 40 50 60 70 80 0
5 10 15
Fuel pellet radial average burnup [ MWd(kgU)−1 ]
Pellet−clad radial gap [ µm ]
20 30 40 50 60 70 800
10 20 30
Pellet−clad contact pressure [ MPa ]
Figure 4.3: Calculated pre-transient pellet-clad radial gap size and contact pressure with respect to local burnup in the peak oxide axial segment of the BWR fuel rod. The gap is calculated at cold zero power conditions, as defined in table 3.5: i.e. for near
20 30 40 50 60 70 80 0 10 20 30 40 50 60
Fuel pellet radial average burnup [ MWd(kgU)−1 ]
Pellet−clad heat transfer coefficient [ kW(m
2 K)
−1
]
PWR BWR
Figure 4.4: Calculated pellet-clad heat transfer coefficient prior to RIA with respect to local burnup in the peak oxide axial segment. The difference between the PWR and
BWR rod is caused mainly by differences in gap gas temperature prior to RIA.
4.2 Calculated fuel rod conditions under RIA
Key results from the performed analyses of RIA with SCANAIR-3.2 are presented graphically in the sequel. The same data are given in tabular form in appendix F. This appendix also contains some complementary data, which are not presented in the graphs below. It should once again be pointed out, that all data pertain to the rod axial segment in which fuel pellet melting is predicted to occur, i.e. to the axial position of peak power, peak fuel enthalpy and peak clad corrosion; confer section 3.3.3. For the PWR fuel rod, this is the 9th axial segment out of 10, corresponding to an axial elevation of 2.9-3.3 m from bottom of the rod. For the BWR fuel rod, pellet melting is predicted to occur in the 6th axial segment of the rod, at an axial elevation of 1.8-2.2 m.
4.2.1 Core failure limits
Figure 4.5 shows the calculated enthalpy thresholds for fuel pellet melting in terms of peak radial average fuel enthalpy under the power pulse, plotted with respect to fuel pellet burnup in the rod axial segment at which melting is predicted. Hence, the enthalpy shown in figure 4.5 is not necessarily the fuel enthalpy at time of melting, but the peak value obtained under a power pulse with sufficient amplitude to just reach the fuel solidus temperature at a single point in the discretized fuel rod.
In the PWR fuel rod, fuel pellet melting is predicted to occur 0-5 ms before the peak fuel enthalpy is reached, depending on burnup, whereas for the BWR fuel rod, pellet melting occurs 0-14 ms before the peak fuel enthalpy is attained. Further information on this issue is given in appendix F.
All enthalpies are calculated with respect to a reference temperature of 273 K. The calculated initial fuel enthalpy, prior to the postulated RIA, is 72.9 J(gUO2)-1 for the
PWR fuel rod and 2.6 J(gUO2)-1 for the BWR rod. The peak fuel enthalpy is reached
approximately 25 ms after peak power in the PWR rod, and the corresponding time lag is about 50 ms for the BWR rod.
Figure 4.5: Calculated core failure limits for HZP REA and CZP CRDA. The fuel enthalpy is the threshold for incipient fuel pellet melting,
in terms of peak radial average value during the power pulse.
4.2.2 Fuel temperatures at incipient melting
The calculated local fuel temperatures at incipient melting are shown in figure 4.6. These temperatures are peak values with respect to both time and space, and they are tabulated in appendix F. As already mentioned, the peak fuel temperatures and enthalpies are always reached in the 9th axial segment of the PWR rod, and in the 6th segment of the BWR rod.
From figure 4.6, it is evident that the local temperatures at incipient fuel pellet melting differ by less than 2 K between the PWR and BWR fuel rods, when plotted with respect to fuel pellet radial average burnup. The difference is due to the fact that the radial distribution of burnup is slightly more peaked in the PWR than in the BWR fuel rod, for the fuel designs considered in our analyses.
For a certain fuel pellet radial average burnup, the radial peak burnup is therefore higher in the PWR rod, and the local fuel temperature at incipient melting somewhat lower. The calculated peak fuel temperature is found about 0.25 mm beneath the fuel pellet surface. However, the peak temperature position moves slightly outward with increasing burnup, as a result of the change in radial power distribution. This burnup dependent change in radial temperature profile is illustrated in figures 4.7 and 4.8, which show the calculated variation in fuel temperature across the pellet radius at time of incipient fuel melting in low- and high-burnup fuel. The temperature profiles at high burnup are strongly peaked to the region just beneath the pellet surface.
Figure 4.6: Calculated local fuel temperatures at incipient fuel pellet melting for PWR HZP REA and BWR CZP CRDA. These fuel temperatures are peak values
0 0.5 1.0 1.5 2.0 2.5 3.0 3.5 4.0 4.5 1600 1800 2000 2200 2400 2600 2800 3000 3200 Radial position [ mm ] Fuel temperature [ K ]
Pellet average burnup 25.4 MWd(kgU)−1 Pellet average burnup 68.0 MWd(kgU)−1
Figure 4.7: Calculated variation in fuel temperature across the pellet radius at time of incipient fuel melting under the PWR HZP REA. The temperature profile is shown for low- and high-burnup fuel, and pertains to the peak power axial segment of the fuel rod.
0 0.5 1.0 1.5 2.0 2.5 3.0 3.5 4.0 4.5 1600 1800 2000 2200 2400 2600 2800 3000 3200 Radial position [ mm ] Fuel temperature [ K ]
Pellet average burnup 29.7 MWd(kgU)−1 Pellet average burnup 70.1 MWd(kgU)−1
Figure 4.8: Calculated variation in fuel temperature across the pellet radius at time of incipient fuel melting under the BWR CZP CRDA. The temperature profile is shown for low- and high-burnup fuel, and pertains to the peak power axial segment of the fuel rod.
5 Discussion
The calculated core failure limits presented in section 4.2.1 should not be viewed as definite operational limits for the reactor core, but merely as best-estimate assessments of the influence of fuel rod burnup on the enthalpy to fuel melting under RIA. The applicability of the calculated failure limits is discussed in section 5.1, where also the limitations of the performed analyses are defined. The calculated core failure limits are further evaluated in section 5.2, where comparisons are made with the current core failure limit for RIA in Sweden. A comparison is also made with a calculated core failure limit for high-burnup fuel rods under RIA, which has recently been presented by the Electric Power Research Institute (EPRI) in the USA. Finally, in order to define operational limits with respect to core failure under RIA, one must consider not only fuel melting, but also the potential for dispersal of large amounts of non-molten fuel fragments from failed high-burnup fuel rods. This is further discussed in section 5.3.
5.1 Applicability of calculated core failure limits
Firstly, it should be noticed that the calculated core failure limits in this report are defined with respect to the radial average fuel burnup in the rod axial segment at which incipient fuel melting is predicted, and not with respect to the rod average burnup. By using local rather than average fuel burnup, comparisons of the calculated failure limits with pulse reactor tests on short-length rodlets are made easier. The local burnup in the axial segment at which pellet melting occurs, Eloc, is in the performed analyses
related to the rod average burnup, Erod, through
rod
loc CE
E = , (5.1)
where the local-to-average burnup factor C is 0.961 for the PWR rod, and 1.157 for the BWR rod, respectively. Hence, due to the upper-peaked power profile imposed on the PWR fuel rod under REA, fuel pellet incipient melting is predicted in the upper part of the rod, where the local burnup is slightly lower than the rod average value; see figure 3.4 and figure E.2 in appendix E.
The postulated HZP REA and CZP CRDA considered in our calculations result in lower enthalpies for pellet melting than RIAs that take place at rated power. Consequently, scenarios for RIA at rated power are conservatively bounded by the calculated enthalpy limits. As a rule, any effect or phenomenon that makes the fuel radial temperature profile more peaked to the pellet periphery will lower the calculated enthalpy limits, since a certain peak temperature is reached at a lower radial average fuel enthalpy. For this reason, our calculations were performed with low fuel enrichments, near-zero initial power, narrow pulse widths and thick clad oxide layers. These conditions make the fuel temperature profile strongly peaked to the pellet periphery, and the calculated radial average fuel enthalpies for pellet melting are therefore low.
The failure limits in section 4.2.1 are calculated for typical LWR fuel designs, as defined in table 3.3.
It should be emphasised, that the failure limits are calculated for fuel rods with UO2 fuel
pellets, and that they are not applicable to (U,Pu)O2 mixed oxide (MOX) fuel rods.
The MOX fuel material has lower thermal conductivity and melting temperature than UO2 fuel, and the radial power distribution within the MOX fuel pellets is different
from that in UO2 fuel. This difference is important for the prediction of incipient fuel
melting, since it affects the temperature distribution across the fuel pellet radius.
The calculated core failure limits are for the same reasons not applicable to burnable absorber (BA) fuel, which usually contains 3-8 wt% Gd2O3. Enthalpy thresholds for
incipient fuel pellet melting in MOX and BA fuel rods may be calculated essentially in the same fashion as for UO2 fuel rods, but additional models for radial distribution of
power, thermal conductivity and melting temperature must first be introduced into the computer codes for these kinds of fuel.
The calculated core failure limits in section 4.2.1 depend on the applied UO2 melting
temperature, and in particular on how the burnup dependent depression of the melting point is modelled. The model used in our analyses is the default correlation for UO2
solidus temperature in SCANAIR-3.2, which predicts a fairly moderate depression of melting temperature with increasing burnup. As discussed in appendix C, there are experimental data from the sixties that would suggest a more substantial depression, but there seems to be a consensus that these early data are misleading, due to inadequate experimental techniques; see e.g. the reviews by Fink (1996), Popov et al. (2000) and Carbajo et al. (2001). We have not been able to compare the model for UO2 melting
temperature in SCANAIR-3.2 with contemporary data on irradiated fuel, since, to our knowledge, such data are unavailable in open literature. However, the model agrees quite well with a correlation proposed by Komatsu et al. (1988), and it has therefore been applied without modifications in our analyses; see appendix C.
The calculations in our study are made with best-estimate computer models and methods, but it should be noticed that penalizing assumptions are made concerning the postulated power transients under RIA. Firstly, a Gaussian pulse shape is used in our analyses, which leads to faster energy depositions than if realistic pulse shapes, obtained from the core kinetics analyses by Gabrielson (2004) and Wiksell (2003), are used. Secondly, the applied pulse widths, 25 and 45 ms for PWR and BWR, respectively, correspond to lower-end results from the above mentioned core kinetics analyses; see figure 3.2. These narrow pulses result in fast energy deposition in the fuel, which lowers the calculated enthalpy thresholds for pellet incipient melting. Thirdly, the axial power distributions are postulated in a penalizing manner, such that the peak power under RIA is concentrated at the axial position of peak clad corrosion. These penalizing assumptions are made in order to account for the uncertainties associated with the power generation in high-burnup fuel under RIA.
5.2 Evaluation of calculated core failure limits
5.2.1 Comparison with current core failure limit
The calculated core failure limits for PWR HZP REA and BWR CZP CRDA from section 4.2.1 are in figure 5.1 compared with the current core failure limit for RIA in Sweden (SKI, 1995). Obviously, the calculated threshold enthalpies for incipient fuel melting agree very well with the current failure limit for low- and intermediate burnup, i.e. below the breakpoint for the current failure limit at 37.4 MWd(kgU)-1. For higher burnup, the current core failure limit is set with attention to dispersion of non-molten fuel fragments from failed rods, rather than fuel melting, and it is therefore not comparable to our calculated enthalpy limits. This is further discussed in section 5.3.
Figure 5.1: Calculated core failure limits, in comparison with the current core failure limit for RIA in Sweden; see appendix A.
The calculated core failure limits drop moderately with increasing fuel burnup, and notwithstanding the differences in fuel rod designs and postulated accident scenarios between the PWR HZP REA and the BWR CZP CRDA considered in our analyses, the calculated failure limits for these two events are similar. The failure limit for the BWR CZP CRDA is slightly higher, mainly as a result of the wider power pulse. As revealed by figures 4.7 and 4.8, the wider power pulse in the BWR event in comparison with the PWR REA leads to a somewhat more uniform temperature profile across the fuel pellet radius. Consequently, for the same radial peak temperature, the pellet radial average fuel enthalpy will be higher in the BWR than in the PWR fuel rod.
The calculated enthalpy limits decrease gradually with fuel burnup, from approximately 960 J(gUO2)-1 at 30 MWd(kgU)-1 to 810 J(gUO2)-1 at 70 MWd(kgU)-1. The decrease is
partly due to depression of the fuel melting temperature with burnup, as illustrated by figure 4.6 and further discussed in appendix C. However, the burnup dependent change in radial distribution of power and temperature within the pellet also contributes to the drop in calculated enthalpy to fuel melting. As shown in figures 4.7 and 4.8, the radial temperature profile is strongly peaked to the pellet periphery at high burnup, which means that a certain peak temperature is reached at a lower radial average fuel enthalpy at high burnup than at low burnup.
5.2.2 Comparison with study done by EPRI/ANATECH
It is interesting to compare our calculated core failure limits with the results of a similar study, which has recently been done for PWR rod ejection accidents at hot zero power conditions by ANATECH Corporation, under the auspices of EPRI (Yang et al., 2003). All fuel rod analyses in this study were performed with the FALCON computer code, which in contrast to FRAPCON-3.2 is applicable to both steady-state and transient fuel rod analyses. The assumed power transient under the REA was a 20 ms wide Gaussian power pulse, and a core failure limit was calculated, using fuel pellet incipient melting as failure criterion. Hence, the analyses made by ANATECH were very similar to those in the present report. Except for the slightly narrower power pulse, 20 instead of 25 ms, the differences to our analyses are confined to the applied models and computer codes. The calculated core failure limit from the study by EPRI/ANATECH is compared with the results of our analyses of PWR HZP REA in figure 5.2. As can be seen from the figure, these calculated core failure limits are in close agreement, and they follow the same trend with respect to fuel burnup.
The calculated enthalpies to fuel pellet melting are about 30 J(gUO2)-1 lower in our
analyses than in the study by EPRI/ANATECH. This difference is by no means remarkable, and may be explained by differences in the applied models and computer codes. In fact, the discrepancy of 30 J(gUO2)-1 is probably a good estimate of
model-induced uncertainties in the performed analyses.
It should be pointed out, that the core failure limit calculated by EPRI/ANATECH is said to be applicable to both BWR and PWR fuel rods, which are subjected to reactivity initiated accidents that initiate from hot reactor conditions. The limit was recently intro-duced in Switzerland as a regulatory acceptance criterion for RIA under PWR and BWR hot reactor conditions by the Swiss Federal Nuclear Safety Inspectorate (Maeder & Wand, 2004).
5.3 Dispersal of high-burnup fuel
The core failure limits presented in this report are calculated peak radial average fuel pellet enthalpies connected with incipient UO2 melting under RIA. By precluding fuel
melting, pulse reactor tests on fresh fuel have shown that fuel dispersal into the coolant is avoided, and that core coolability and reactor pressure vessel integrity can be ensured. However, as discussed in section 2.2, tests on high-burnup fuel rods indicate that the accumulation of gaseous fission products within the pellets may lead to additional fuel dispersal mechanisms for burnups exceeding approximately 40 MWd(kgU)-1. With the computational tools at hand, we are unable to model these mechanisms, and a fuel dispersal limit for high-burnup fuel can therefore not be calculated. Moreover, it is difficult to establish such a limit also from pulse reactor tests, since the database of failed high-burnup test rods is meagre; see appendix B. To make matters worse, the power pulses and cooling conditions in the tests differ from those expected in commercial light water reactors under RIA, and fuel dispersal limits determined in pulse reactor tests are therefore not directly applicable to LWRs. The importance of prototypical test conditions is in fact underlined by the distinct differences in failure behaviour observed between pulse tests performed in CABRI and the NSRR, as discussed in section B.4.
However, with these reservations kept in mind, the results from pulse reactor tests on SPERT and NSRR-JMTR rods, ranging in burnup from 21 to 38 MWd(kgU)-1, show that the potential for dispersion of non-molten fuel fragments from failed fuel rods is low at low and intermediate burnup. As shown by figure B.3 in appendix B, no or marginal fuel loss was observed for peak fuel enthalpies below 850 J(gUO2)-1 for these
rods. The results are possibly biased by high 235U enrichment in the rods (7, 10, 20 %) and atypical pre-irradiation conditions, but they still confirm that dispersal of non-molten fuel is primarily a high-burnup issue.
Concerning the pulse reactor tests on high-burnup fuel, i.e. in the range of 44 to 64 MWd(kgU)-1, we first note that all these tests were carried out on samples, which were re-fabricated from commercial LWR fuel rods after 4-5 cycles of operation in power reactors. The results of the tests are therefore not biased by odd fuel designs or atypical pre-irradiation conditions. Although the failure behaviour differs considerably between rods tested in the NSRR and the CABRI reactor, the tests show that dispersion of non-molten fuel particles into the coolant cannot be precluded in this burnup interval.