Research
Updated radiological risk
assessment for the “Radon”
type surface disposal facility
in Chisinau, Moldova
SSM perspective
Background
Bilateral cooperation between Sweden and the Republic of Moldova in nuclear and radiological safety and security has been ongoing since 2010, focusing on activities aimed at strengthening the institutional capacity of the National Agency for Regulation of Nuclear and Radio-logical Activities in Moldova (NARNRA) as well as infrastructure devel-opment in radioactive waste management, handling and treatment at the Radioactive Waste Management Company`s Special Facilities 5101 and 5102.
In 2019, SSM funded development of a geoscientifc and radiological measurement program at the National Radioactive Waste Management site outside Chişinău and provided assistance in carrying out an envi-ronmental and radiological risk assessment of a near-surface Radon-type facility of historical radioactive waste at the site (Radiological risk assessment for the “Radon” type surface disposal facility in Chişinău, Moldova, SSM Report 2019:12). The objective of the risk assessment was to support future governmental decisions on the possible retrieval and treatment of this legacy waste. The assessment addressed potential future radiological consequences of the disposal facility, i.e. the conse-quences of migration of various radionuclides for staf, population and the environment, for the case where the disposal facility will remain as before (the zero alternative scenario).
Results
This report is an update of the previous environmental and radiological risk assessment and is funded by the Swedish International Develop-ment Agency (SIDA) as part of a project on design and construction of a storage facility for radioactive waste at the National Radioactive Waste Management in Moldova. The updated assessment comprises a dynamic biosphere model based on the site specifc data that is compared to the simplifed model used in the previous report. In addition, the efect of neglecting interception in the irrigation is evaluated and a set of fully probabilistic simulations and sensitivity analysis are conducted. The updated report confrms the results of the previous assessment of poten-tial radiological impacts of the disposal facility, but also identifes areas that may be considered for further model development.
Relevance
This study is relevant for other countries in the former Soviet Republic with similar legacy radioactive waste disposal sites and so has a wider signifcance. The combination of the ISAM and updated BIOMASS meth-odologies and the use of GIS techniques to provide detailed site-specifc data from the digital elevation model for the local topography illustrates how practical limits for the well dilution can be estimated from topo-graphic maps of the kind that are often available from national geo-graphic surveys. The used methods here – based on a straightforward
as a frst approximation to site-specifc conditions. Model results can therefore be used as part of a screening process to determine if more detailed site investigation might be needed. This demonstrates a signif-cant improvement compared to earlier approaches before the advent of GIS (geographic information systems) methods. As a relatively simple and inexpensive approach it has much to recommend it for preliminary studies of potential radiological impact.
Need for further research
Environmental and radiological risk assessment for legacy radioactive waste disposal facilities are essential for decision-making on remedia-tion and retrieval activities. This study demonstrate the use of a simpli-fed approach to guide decision-making on retrieval and remediation. Depending on factors such as the inventory, properties of the disposal facility and its setting and potential radiological consequences, further research may be warranted to justify simplifed approaches. There remain signifcant uncertainties in the representation of the near-sur-face hydrology that could be addressed by further research.
Project information
Contact person SSM: Viviana Sandberg Reference: SSM2019-12
Authors: Shulan Xu 1), Ryk Kłos 2)
1) Xu Environmental Consulting AB, Sweden 2) Aleksandria Sciences Ltd, United Kingdom
2021:03
Updated radiological risk assessment
for the “Radon” type surface disposal
facility in Chisinau, Moldova
This report concerns a study which has been conducted for the Swedish Radiation Safety Authority, SSM. The conclusions and view-points presented in the report are those of the author/authors and do not necessarily coincide with those of the SSM.
Content
1. Introduction ... 2
2. Assessment context ... 5
2.1 Purpose of the assessment ... 5
2.2 International guidance ... 5
2.3 Assessment philosophy ... 6
2.4 Timeframes ... 6
3. System description and site characteristics ... 8
3.1 Description of the waste disposal facility ... 8
3.2 Site characteristics ... 10
3.2.1. Hydrogeological and Geotechnical conditions of studied site .. 10
3.2.2. Meteorological data ... 13
3.2.3. Land use ... 14
4. Preparation of the risk assessment ... 16
4.1 Selection of scenario ... 16
4.1.1. Design scenario ... 17
4.1.2. Alternative scenarios ... 19
4.1.3. Human intrusion scenarios ... 20
4.2 Conceptual and Mathematical models ... 21
4.2.1. Modelling of design scenario ... 21
4.2.2. Modelling of human intrusion scenario ... 27
4.2.3. Modelling of alternative scenarios ... 32
4.3 Biosphere objects and mathematical models ... 32
4.3.1. Identification of biosphere objects ... 32
4.3.2. Formulation of mathematical models for the biosphere object 35 4.4 Data compilation ... 43
4.4.1. Data used in evaluation of design scenario ... 43
4.4.2. Data used in evaluation of human intrusion scenarios ... 44
5. Results of the analyses ... 47
5.1 Results from the design scenario ... 47
5.1.1. Comparison of the simple expression and the dynamic model 47 5.1.2. Deterministic calculation results ... 47
5.1.3. Probabilistic calculations and sensitivity analysis ... 49
5.1.4. Results of the “What if” case ... 52
5.2 Results from the human intrusion scenarios ... 53
5.2.1. The bathtubbing scenario ... 53
5.2.2. The on-site residence scenario ... 53
5.2.3. The road construction scenario ... 55
5.3 Results from the alternative scenarios ... 55
5.4 Results of the assessment for non-human biota ... 56
6. Discussions and conclusions ... 58
References ... 61
1. Introduction
This report is an update of the previous report (Xu and Kłos, 2019) and includes improved model descriptions and simulations in respective of the following:
• A dynamic biosphere model based on site specific data compared with the simpler approximation used in the previous report
• The effect of neglecting interception in the irrigation
• A set of fully probabilistic simulations and sensitivity analysis.
The RADON-type Central Radioactive Waste Disposal Facility (CRWDF) was established by a special decree, issued by the Government of the USSR on 15 October, 1960. The architecture of the facility is similar to those which were established also in other Republics of the former Soviet Union. The disposal of radioactive waste in Moldova began in 1961.
The long-term conditions and potential radiological consequences of the legacy radioactive waste stored in the RADON-type disposal facility outside Chişinău (Special Facilities 5101, 5102) is of concern for the central government authorities of the Republic of Moldova. Radiological investigations performed by the
National Center of Preventive Medicine in 1998 showed increased contamination of radionuclides Sr-90 and Ra-226 of soil and groundwater in the vicinity of the disposal facility.
Swedish Radiation Safety Authority (SSM) supported a collaborative project dur-ing 2017-2018 with the aim of developdur-ing a site descriptive model for the near-surface disposal facility and its surroundings that could serve as a basis for devel-oping a radiological safety assessment. Site characterisation and compilation of an inventory have been completed and documented in three reports, “Geomorpholog-ical and infrastructure assessment of the radiolog“Geomorpholog-ical object”, “Relevant data about the near-surface disposal facility “RADON” and the site RWMC in
Chişinău” as well as “Hydrogeological and geotechnical conditions of radioactive waste deposit from Uzinelor 210 str. mum. Chişinău , objects 5101 and 5102”. Hereafter, they are mentioned as “Radiological Object Report”, “Site Report” and “Hydrogeological Report”.
Xu Environmental Consulting AB is requested by SSM to perform a radiological risk assessment of the “zero alternative scenario” for the RADON-type of near-surface disposal facility, to determine the implications of carrying out no remedial actions at the site. The objective of this risk assessment is to assess the long-term safety conditions of the facility and its potential radiological impact on humans and the environment as well as to provide a basis for decision making regarding the decommissioning of the legacy radioactive waste.
In this assignment we adopted ISAM and BIOMASS methodologies to perform the risk assessment for the RADON-type of near-surface disposal facility. In 1997, IAEA launched a Co-ordinated Research Project on Improvement of Safety
Assessment Methodologies for Near Surface Disposal Facilities (ISAM). The particular objectives of the project were to:
• provide a critical evaluation of the approaches and tools used in post-closure safety assessment for proposed and existing near-surface radioactive waste disposal facilities;
• enhance the approaches and tools used;
• build confidence in the approaches and tools used.
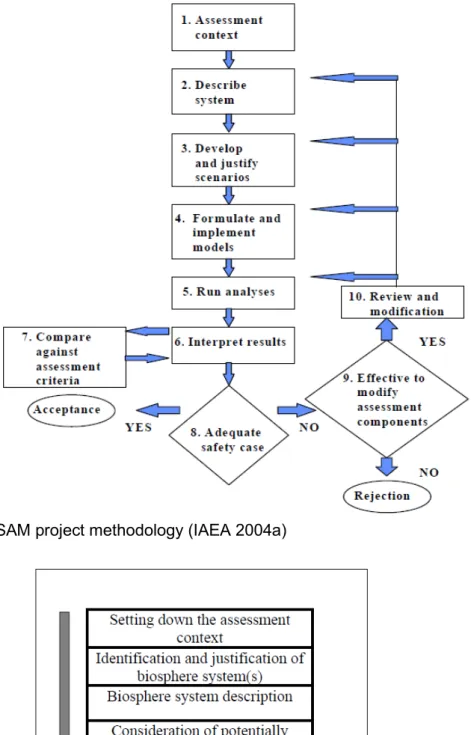
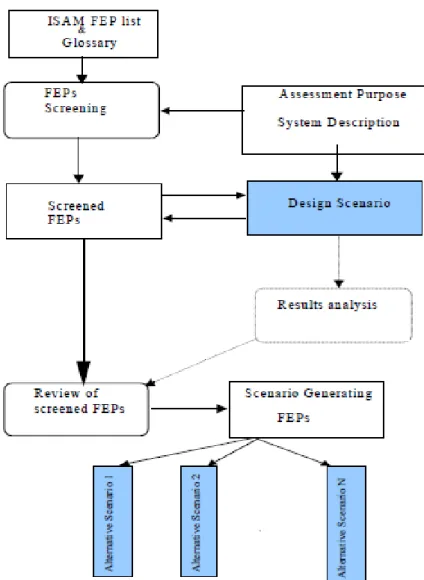
The project ran until 2000 and resulted in the development of a harmonised assessment methodology – the ISAM project methodology (IAEA 2004a,b) shown in Fig. 1, which was applied to a number of test cases. The ISAM project primarily focused on developing a consensus on the methodological aspects of safety assessment, especially i) specification of the assessment context, ii) description of the waste disposal system, iii) development and justification of scenarios, iv) formulation and implementation of models and v) analysis of results and building confidence. However, given the resource constraints in the ISAM project, illustration of the application of the methodology is limited to an
interpretation of the Test Cases, for example, the resulting models are not site-spe-cific in that they are not descriptive of a single site but are more generically appli-cable to sites with arid climates.
The IAEA Programme on BIOsphere Modelling and ASSessment (BIOMASS) was launched in 1996 (IAEA 2003a). The programme was concerned with developing and improving capabilities to predict the transfer of radionuclides in the environment. The objective was to develop the concept of a standard or reference biosphere for application to the assessment of the long-term safety of repositories for radioactive waste (see Fig. 2). Subsequent development of the methodology is being being published (IAEA, 2020) and key features of the revised methodology are also applied in this project.
Fig. 1 The ISAM project methodology (IAEA 2004a)
2. Assessment context
This chapter describes the performance of the first step, Assessment Context according to the ISAM methodology (see Fig. 1).
2.1 Purpose of the assessment
The long-term conditions and potential radiological consequences of the legacy radioactive waste stored in the RADON-type disposal facility outside Chişinău (Special Facilities 5101, 5102) is of concern for the central government authorities of the Republic of Moldova. Radiological investigations performed by the
National Center of Preventive Medicine in 1998 showed increased contamination of radionuclides Sr-90 and Ra-226 of soil and groundwater in the vicinity of the disposal facility.
The objective of this risk assessment is to assess the long-term safety conditions of the facility and its potential radiological impact on humans and the
environment as well as to provide a basis for decision making regarding the decommissioning of the legacy radioactive waste.
2.2 International guidance
Currently the legal framework in the field of radioactive waste management in Moldova is under development. For the time being, there are no legal require-ments for undertaking risk assessrequire-ments for near-surface disposal facilities. There-fore, this risk assessment is based on the international standards and best prac-tices.
The specific criteria of the near-surface disposal set in IAEA SSR-5 (IAEA 2011) are:
• A disposal facility (considered as a single source) is so designed that the calculated dose or risk to the representative person who might be exposed in the future as a result of possible natural processes affecting the disposal facility does not exceed a dose constraint of 0.3 mSv in a year or a risk constraint of the order of 10-5 per year.
• In relation to the effects of inadvertent human intrusion after closure, if such intrusion is expected to lead to an annual dose of less than 1 mSv to those living around the site, then efforts to reduce the probability of intrusion or to limit its consequences are not warranted.
• If human intrusion were expected to lead to a possible annual dose of more than 20 mSv (see ICRP 2007, Table 8) to those living around the site, then
alternative options for waste disposal are to be considered, for example, disposal of the waste below the surface, or separation of the radionuclide content giving rise to the higher dose.
• If annual doses in the range 1–20 mSv (see ICRP 2007, Table 8) are indicated, then reasonable efforts are warranted at the stage of
development of the facility to reduce the probability of intrusion or to limit its consequences by means of optimization of the facility’s design.
The key components of the methodology for the radiological impact assessment after closure set in International Atomic Energy Agency SSG-29 (IAEA 2014) are:
• A systematic description of the disposal system;
• Identification of the various features, events and processes that may affect how the facility will perform and evolve;
• Identification of scenarios for evolution of the site;
• Conceptual, numerical and computer models of relevant parts of the disposal system (e.g. the waste in the near field, the engineered barriers, the host rock and the surface environment of the facility).
2.3 Assessment philosophy
In order to provide a basis for decision making regarding the decommissioning of the legacy radioactive waste this assessment is supposed to use as much site specific data as possible. SSM suported a site investigation project during 2017-2018 that aims to develop a site descriptive model for the near-surface disposal facility and its
surroundings. The site investigation was documented in three reports as mentioned previously. Furthermore, instead of using a stylised biosphere object as recommended in the ISAM approach a realistic biosphere object based on site specific topographic information was identified (details are given in section 4.3).
The main endpoints of the assessment are calculated annual effective doses to humans and environmental concentrations. The calculated annual effective doses are compared with the specific criteria given in section 2.2 and environmental concentrations are compared with Environmental Media Concentration Limits (Brown et al., 2014).
2.4 Timeframes
In this assessment, as with most of safety assessments (IAEA 2004a), a 300 year institutional control period is assumed. Fig. 3 illustrates the radioactivity as a function of time. As can be seen in the figure, Cs-137 dominates radioactivity at the beginning but decays to an insignificant level after 100 years. After that
Pu-239 dominates. It has been shown in the figure that 4% of the total activity re-mains after 100 000 years.
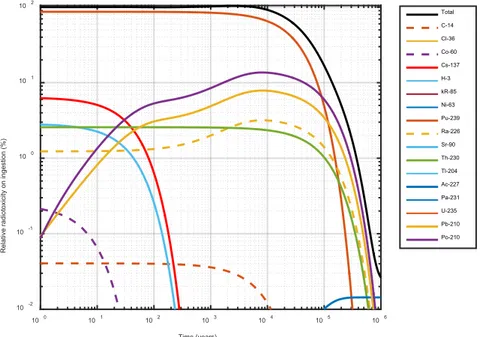
Fig. 4 shows the radiotoxicity as a function of time. One way to describe the radi-otoxicity is by calculating the committed effective dose from ingestion of radionu-clides directly. The radiotoxicity of the nuclear waste can be considered as a basis for the risk assessment timescale. The radiotoxicity in the waste disposed in the disposal facility is dominated by long-lived radionuclide Pu-239. Fig. 4 shows that about 10% of radiotoxicity remains after 100 000 years.
2 10 Total C-14 Cl-36 Co-60 Cs-137 1 10 H-3 kR-85 Ni-63 Pu-239 Ra-226 Sr-90 Relative activity (%) 0 10 Th-230 Tl-204 Ac-227 Pa-231 U-235 -1 10 Pb-210 Po-210 -2 10 0 10 10 1 10 2 10 3 10 4 10 5 10 6 Time (years)
Fig. 3 Percentage contribution to the total activity as a function of time.
2 10 Total C-14 Cl-36 Co-60 Cs-137 1 H-3 kR-85 Ni-63 Pu-239 Ra-226 10
Relative radiotoxicity on ingestion (%)
0 10 -1 10 Sr-90 Th-230 Tl-204 Ac-227 Pa-231 U-235 Pb-210 Po-210 -2 10 0 10 10 1 10 2 10 3 10 4 10 5 10 6 Time (years)
3. System description and site
characteristics
This chapter describes the whole system that includes descriptions of the disposal facility and the site characteristics according to the ISAM methodology (see Fig. 1).
3.1 Description of the waste disposal facility
In the Site Report the radioactive waste disposal facility is described. The facility essen-tially consists of four reinforced concrete vaults for solid waste disposal and covers an area of 75 m2 (15 m × 5 m). As the depth of the Vaults is 3 m, the total disposal capacity
reaches 225 m3 (see Fig. 5).
The vaults, numbered I to IV, are covered by prefabricated reinforced concrete panels (width about 80 cm, height about 24 cm). The panels were placed on the concrete crown of the vaults (about 8 cm height). Gaps of around 10 cm width between two panels were sealed with cement mortar (concrete). In the middle of the top of the Vaults there are opening lids to load the waste. The size of the lid is about 900 × 1400 mm, the size of the opening covered by the lid is about 700 ×1200 mm (see Fig. 6). With the assumption of the 35 cm wall thickness around the Vaults and between the compartments, the inner side lengths of the Vaults would be respectively 360, 380, 310, 360 cm, and the width is 430 cm. Based on the pictures taken on the inner content of Vault IV, the depth of the Vault would be about 2.75 m, so the capacity of the four Vaults can be estimated to be 42, 45, 36 and 42 m3. The total capacity estimated is
about 165 m3.
Regarding the shape and position of the loading hole, the Vault cannot be filled completely, since wastes were only thrown in through the opening without special placement measures, hence Vault I, II and IV could be filled by around 30 m3 of
waste each, while Vault III could be filled up by about 20 m3 waste. Taking into
account that Vault III is filled up only by 70 % of its capacity, and Vault IV con-tains only 1 m3 waste, the total volume occupied by the disposed waste is around
75 m3.
Four vaults do not provide satisfactorily isolation (see Fig. 7). According to the operator’s description an elevated groundwater table was observed inside the vault IV during the late ’90s (Site Report, p. 95). As noted above, radionuclides Sr-90 and Ra-226 in soil and groundwater in the vicinity of the disposal facility were detected by the National Center of Preventive Medicine in 1998.
Fig. 5 Vault layout and cross section.
Fig. 6 Schematics of waste position in the vault.
The activities of the isotopes are summarised for each vault and each waste form. The waste packages are mainly categorised in three categories:
• Unstable waste form, • Stable waste form,
• Disused Sealed Radiation Source (DSRS).
All vaults and waste type specific data are presented in the Table 1.
3.2 Site characteristics
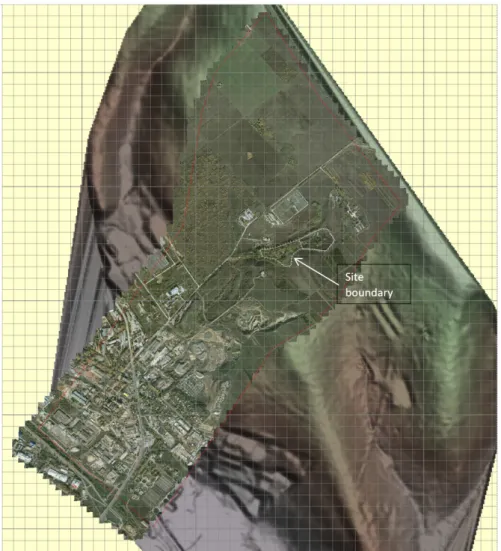
The near-surface disposal facility is located in the Chişinău municipality, and the terrain adjacent to the facility falls within the limits of the city, Chişinău within an area of 454.83 ha. The location of the disposal facility is shown bordered by the white boundary and the studied site by the red boundary (see Fig. 8).
3.2.1. Hydrogeological and Geotechnical conditions of studied site
The Hydrogeological Report describes hydrogeological and geotechnical condi-tions at the site. The surface is characterised by the different inclination (see Fig. 9) from middle (between 3 and 6 grade) to intensive slope inclination (more 6 de-grees). The neighbouring terrain is characterised mostly by high inclination (more 6 degrees). The elevation in the internal terrain of the site varies from 81 to 118 m. The outside neighbouring terrain is characterised by the altitude from 81 to 130 m. The greatest slopes are found towards the south and east part of the study area.
Fig. 8 Map of the site. The location of the disposal facility is shown bordered by
the white boundary.
The upper part of geological section is characterised by small thickness of Quater-nary loam and Neogene sandy-clay formation. These rocks are covered by agri-culture (layer 1) and artificial (layer 2) soils. Quaternary loam (layer 3) has no subsidence properties. The Neogene formation comprises sandy loam (layers 4, 7) layered with clay and clay layered with sands (layers 5, 6). The upper parts of the clays, which are located at slopes with high inclination, are intensively fractured. The location of geological layers is presented in the geological section (Fig. 10). This clay is dense, dry, semi dry, fractured, with fine sand layers and carbonate in-clusions. The groundwater can seasonally form at shallow depth (under flooding) due to the presence of clays at shallow depth (3-4 m).
The hydraulic conductivity (filtration coefficient) varies from 0.1 to 1.0 m/day for sandy loam in the aeration zone and from 0.5 – 1.5 m/day in water saturated zone. The clay with sand layers has different values in horizontal and vertical directions. The effective porosity is about 0.4. The filtration coefficient of horizontal oriented fine sand layers ranges from 0.2 to 0.5 m/day. The filtration coefficient for clay layers is changed from below of 0.001 m/day for dense clay layers to 0.4 /day for
fractured clay layers. The filtration characteristic of the aeration zone varies over a large interval and depends on the degree of the fracturing and stratification.
Groundwater is situated at different levels: from 1.5 to 11.0 m (elevation 81.0 – 88.6 m above the sea level, WGS84). Rising groundwater is indicated by its ap-pearance at the 1.3 – 1.8 m level and this is seen to occur during the wet season, with an unfavourable influence on slope stability. The principal water bearing rocks are sandy loam, which show a fluid consistency (a liquid state according to Atterberg limits) in saturated zone. The groundwater is aggressive to concrete ac-cording to water quality analysis: sulphates 955 mg/L, hydrocarbonate 8.11 mg-eq/L.
Rocks were separated into four geotechnical elements (GE): • GE I – quaternary loam (layer 3)
• GE II – fractured neogene clay (layer 5) • GE III – sandy loam (layer 4)
• GE IV – neogene dense clay (layer 6).
Fig. 10 Geological section by line I-I’ (shown in Fig. 9)
3.2.2. Meteorological data
In the Republic of Moldova, the systemic observations on climate indices started in 1886 and have continued via the hydro-meteorological monitoring network of the State Hydrometeorological Service (Site Report).
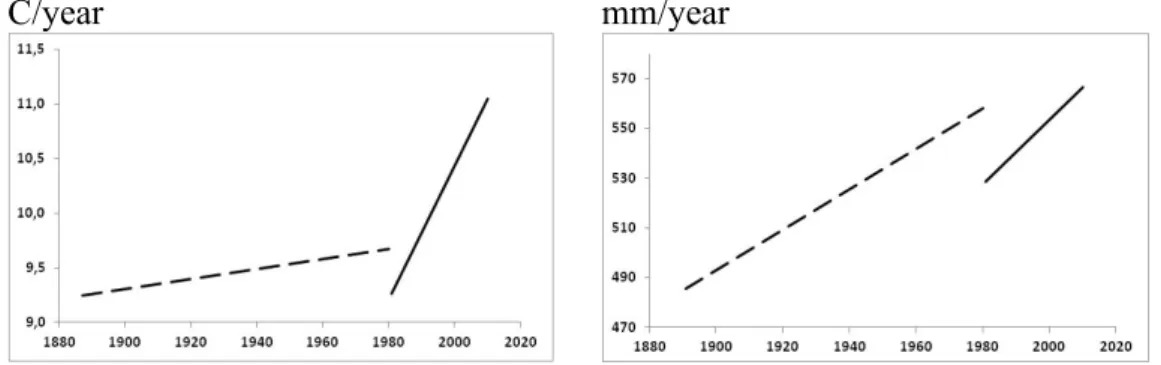
The nature of observed climate changes in the Republic of Moldova has been identified through the trends and variability of basic climatic indices (The Third National Communication of the Republic of Moldova under the United Nations Framework Convention on Climate Change. Ministry of Environment of the Re-public of Moldova/ UNDP Environment. - Ch.: "Imprint" Plus Ltd.2013 - 413 p). Observations of air temperature and precipitation show a spatial distribution of monthly, seasonal and annual average values. Fig. 11 shows linear trends in the evolution of mean air temperature (C/year - left side), and precipitation (mm/year - right side) for two instrumental observation time spans at Chişinău Meteorologi-cal Station (Site Report).
The climate of the Republic of Moldova is moderate-continental and is character-ised by mild and short winter, with little snow and long-lasting summer, with a low amount of precipitation. The average annual air temperature is 8-10° C, the highest temperature is +41.5 °C and the lowest temperature is −35.5 °C.
According to the available information on the meteorological conditions at the disposal site, an average precipitation of 573 mm/y, maximum precipitation of 744 mm/y and minimum precipitation of 425 mm/y. For the vegetated area around
the repository a value of 80% has been selected to represent normal evolution evapotranspiration conditions.
Projections of future climate scenarios for the Republic of Moldova suggest that what are currently considered to be extreme rare events for absolute maximum temperatures of 34-35°C for the baseline period of 1961-1990 will possibly be-come mean maximum summer temperatures. Projections for Europe more gener-ally indicate that the risk of floods increases in Northern, Central and Eastern Eu-rope and that today’s 100-year droughts will return every 50 years especially in Southern and South-Eastern Europe, including in the Republic of Moldova (Lehner et al., 2006).
C/year mm/year
Fig. 11 Linear trends in the evolution of mean air temperature (C/year - left side),
and precipitation (mm/year - right side) for two instrumental observation time spans at Chişinău Meteorological Station (dashed line: 1887-1980 and continuous line: 1981-2010)
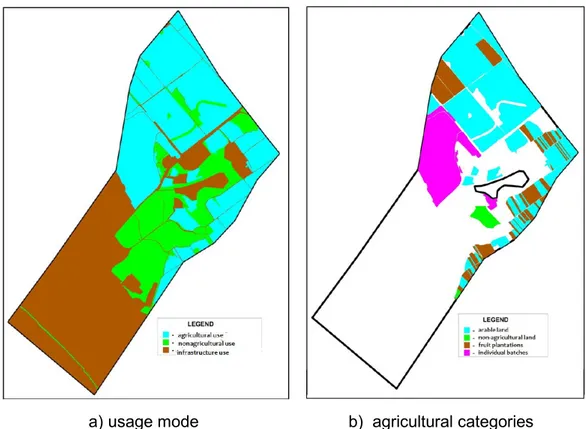
3.2.3. Land use
The general characterisation of land use around the site is shown in Table 2. The data show the dominance of infrastructure land (built-up areas), which represents 42.8% of the total area. Agricultural land is the second largest, with 38.1% and the non-agricultural ones with a share of 19.1% (Table 2). Spatial spread by mode of use is shown in Fig. 12a.
The land for agricultural use within the site includes 108 objects with a total area of 219,163 ha (Table 3). Five categories of land are found in the site: arable, pas-ture, fruit plantations and individual lots. The arable land category has the largest spread, constituting 59.2% of the agricultural land (see Fig. 12b and Table 3). In-dividual (back-up) lots account for 21.7%, 16.6% of the agricultural land was planted with fruit trees. Grassland occupies only 2.5% of agricultural land.
Table 2 General characterisation of non-agricultural use
Use objects No. of Surface, Ha % of total objectsurface
Agricultural 108 219.163 38.1
Non-agricultural 100 109.912 19.1
Infrastructure 123 245.973 42.8
TOTAL 331 575.05 100
Table 3 General characterisation of agricultural use
Category of use No. of objects Surface, Ha
% of total agricultural sur-face Arable 49 129.643 59,2 pastures 3 2.58 2,5 Fruit trees 48 36.43 16,6 Individual lots 8 47.52 21,7 TOTAL 108 219.163 100
a) usage mode b) agricultural categories
4. Preparation of the risk
assess-ment
This chapter describes the performance of Steps 3 and 4 according to the ISAM methodology (Fig. 1) as well as identification of biosphere system according to BIOMASS methodology (Fig. 2).
4.1 Selection of scenario
SSG-23 (IAEA, 2012) states that “scenarios are used to describe possible evolu-tions of the disposal system and its environment. The potential migration of radio-active substances from the disposal facility, their movement in the environment and resulting radiation risks are quantitatively analysed by means of conceptual and mathematical models.”
The ISAM project developed a systematic assessment framework to provide a for-mal basis for both performance assessment and external review of the logic of the underlying assumptions adopted in a safety case. This approach helps to provide assurance that the assessment has effectively addressed all potentially relevant Features, Events and Processes (FEPs) and takes account of the ways in which combinations of these FEPs might produce qualitatively different outcomes. The systematic approach also provides the setting for demonstrating how uncertainties associated with the future evolution of the disposal system have been addressed and assimilated into the safety case.
A list of FEPs relevant to the assessment of long term safety of near surface dis-posal facilities developed in the ISAM project can be found in the Appendix C of IAEA (2004a). Scenario generation approaches were defined and applied in three ISAM Test Cases, namely for safety assessment of RADON, vault and borehole test cases.
The basis of the approach adopted by the RADON Test Case to generate scenarios might be summarised as the following (see also Fig. 13):
• Screen the ISAM FEP list on the basis of the assessment context and sys-tem description
• Develop and agree a simplified Design Scenario as the main case of the safety assessment
• Identify a limited number of representative Alternative Scenarios rather than comprehensively identify every possible alternative scenario by revis-iting the screened ISAM FEP list, with particular attention on external FEPs.
• Identify a limited number of scenarios due to inadvertent intrusion of dis-posal facilities after the institutional control
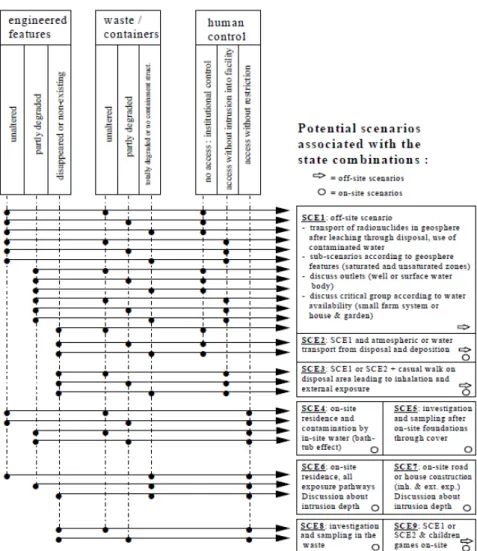
Different terms are used to categorise scenarios in international safety standards, national regulations and international projects. In the ISAM approach scenarios are divided into three groups, Design Scenario, Alternative Scenario and Human Intrusion Scenarios. The Design Scenario is defined such that geosphere and bio-sphere conditions remain as they are at present, with a normal evolution of the en-gineering barriers and near field. Alternative Scenarios are defined as naturally disturbed performance (erosion, flooding, earthquake, earth creep, frost heave, plant and animal intrusion). The Human Intrusion Scenario is defined as human intrusion including road construction, house building and agriculture on site. Based on FEPs screening, general scenarios for RADON test case may be divided into three groups: undisturbed performance, naturally disturbed performance and inadvertent intrusion. All these cases should in general be considered for both on-site and off-on-site human residence. Combining these scenarios with required FEPs, produces a list of general scenarios, illustrated in Fig. 14. This greatly simplifies the procedure of generation of scenarios in this assessment, i.e., combing site spe-cific conditions we are able to select scenarios for the assessment. Calculation cases included in the scenario are defined to assess uncertainties. Descriptions of selection of scenarios and calculation cases are given below.
4.1.1. Design scenario
The design scenario is based on the probable evolution or also called reference evolution of external conditions, and realistic, or, where justified, pessimistic as-sumptions with respect to the internal conditions. From the map of slope gradients (Fig. 8) one can see that the disposal facility is located on a relatively high alti-tude. This means that the disposal facility could be a recharge area. The design scenario, SCE1 with the initial state that the engineered barrier is partly degraded is selected where a small farm system is located adjacent to the disposal facility. Identification of the farm system as a biosphere object is given in section 4.3.1. This design scenario or also called leaching scenario is a relevant type of normal evolution scenario. The use of a farm system is a means to ensure that a compre-hensive range of exposure pathways is assessed. Two options of water source for the farm system in SCE1 are given in Fig. 14 for discussion, namely well water or surface water. As set out in section 4.3.2 well water is the most likely source of drinking and irrigation for the farm system. Based on this site specific information the calculation case can be defined as a well exposure pathway. A variant case to the well exposure pathway is a further pessimistic assumption case, i.e., there is no engineered barrier (concrete wall is completely degraded at the initial state). This kind of case is often called “What if” scenario in the recent published IAEA safety standards (e.g. IAEA 2012, 2014) to illustrate the robustness of various nat-ural and engineered barriers. However, in order to be consistent with the ISAM classification of scenarios we define this “What if” scenario here as a variant case of the design scenario.
Fig. 14 Generation of a Set of Scenarios (SCE) According to Various States of
the Disposal and Human Behaviour Components (IAEA 2004a)
4.1.2. Alternative scenarios
Scenarios that may deviate the reference evolution for the long-term safety of the disposal facility are selected as alternative scenarios. Since the main safety func-tion for the existing facility is the concrete walls of the vault, possible routes to vi-olation of the safety function are used to identify the alternative scenarios. Ac-cording to the Site Report “there is a danger of land flooding in torrential rainfall or snow melting during the winter/spring season” and “Projections for Europe more generally indicate that the risk of floods increases in Northern, Central and Eastern Europe and that today’s 100-year droughts will return every 50 years es-pecially in Southern and South-Eastern Europe, including in the Republic of Mol-dova.”. Precipitation data has been recorded in the Republic of Moldova in the pe-riod 1891-2010. The data shows that the mean value of annual precipitation is 540 mm. The most significant value of annual precipitation, 915 mm, was recorded in 1912 and 531 mm for summer season in 1948. Another external event mentioned
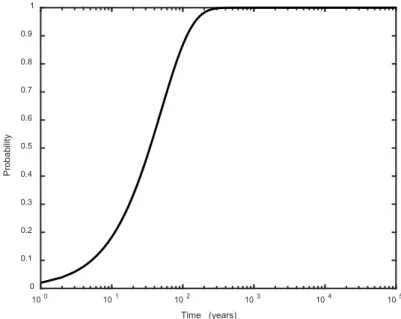
in the Hydrogeological Report is that “Thus we can conclude that groundwater formation at high inclination slope will provoke landslide events on studied site.” Flooding and landslides cases are selected as the alternative scenarios. Since flooding will be happen once every 50 years the cumulative frequency of this rare event, P can be written as:
𝑃𝑃 = 1 − 0.98𝑡𝑡 Eq. (1)
in which t is the time.
The frequency that the flooding will occur for the time scale of the performance is shown in Fig. 15. For the landslides scenario no frequency is assigned.
1 0.9 0.8 0.7 0.6 0.5 0.4 0.3 0.2 0.1 0 Probability 100 101 102 103 104 105 Time (years)
Fig. 15 Cumulative distribution function for the frequency that the flooding will
oc-cur as a function of time.
4.1.3. Human intrusion scenarios
Three human intrusion scenarios are selected according to Fig. 14 to assess the disturbed evolution of the disposal facility i.e., i) on-site residence and contamina-tion by leachate (bathtub effect, SCE4); ii) on-site residence scenario (SCE6); iii) the road construction scenario (SCE7) in order to illustrate the damage to humans intruding into the disposal facility after institutional control.
4.2 Conceptual and Mathematical models
Once the scenarios are generated the next step is to develop conceptual and math-ematical models for the scenario and finally implement mathmath-ematical models us-ing computer tools. The test case for RADON type disposal facility demonstrated in the ISAM report (IAEA 2004b) simplifies our assessment considerably in that we do not need to screen the ISAM FEP list to develop conceptual and mathemat-ical models. Instead we can adopt the conceptual and mathematmathemat-ical models from the test case with minor modifications based on the site specific information in our assessment.
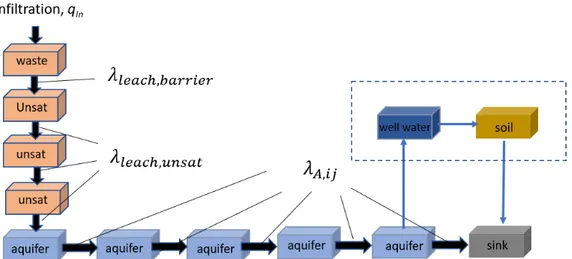
4.2.1. Modelling of design scenario
The conceptual model for the design scenario is shown in Fig. 16. A time period for concrete degradation is assumed as 500 years (IAEA 2004b). In this assess-ment it is considered that the concrete wall has been partly degraded at the initial state since it is mentioned in Chapter 1 that leakage of radionuclides in the vicin-ity of the disposal facilvicin-ity was detected in 1998. In the simulation 10% of infiltra-tion as the initial value is assumed and the infiltrainfiltra-tion increases linearly to 100% at 500 years. Here, we assume that there is no retardation of radionuclides in the waste material itself. This means that no account is taken of sorption of radionu-clides on the waste.
The calculation case for the well exposure pathway assumed that water infiltrating the waste percolates through the unsaturated zone to the water table (aquifer), ca. 1 m below and then migrates along with the local groundwater flow into the vicin-ity of a well, located beyond the site boundary. Release mechanisms, transport media and exposure mechanisms for the calculation case are identified in Table 4. For the purposes of long-term assessments of radioactive waste disposal, concen-trations of radionuclides in certain biosphere media (for example the atmosphere, crops and animals) can often be assumed to be in equilibrium with their donor me-dia. The concentration in a crop grown in the soil can be assumed to be in equilib-rium with the concentration in the soil and any irrigation water applied. It is be-lieved that this approach is valid because the processes affecting the concentra-tions in such media are rapid compared with those affecting concentraconcentra-tions in the donor media, particularly because of the long-term nature of the release (IAEA 2004b). Therefore, a simple approximation expression is used to estimate concen-tration of soil in the previous report (Xu and Kłos, 2019). A complete dynamic model for the biosphere object is developed in this report (see section 4.3.2). A comparison of the results obtained from the simple approximation and the dy-namic model is given in section 5.1.1.
A compartment model structure is used to describe the transport processes for the disposal system. A compartment model is an approximation since it is a discreti-sation of continuous transport process and radionuclide concentrations. Generally
speaking increasing the number of compartments increases the accuracy of the re-sults, but at the cost of modelling time and model complexity. Further guidance on discretisation of compartment models is available elsewhere (e.g. Kirchner, 1998; Xu et al., 2007). Fig. 17 shows the constructed compartment models for the well case. Compartments within the dashed line shown in Fig. 17 are virtual com-partments, i.e., they are expressed by analytical equations (see Eq. (9) and Eq. (12)). All the transfer rates between compartments are described below.
The ordinary differential equation (OED) for each model compartment (N) may include inflows from outside the system (source), outflows from the system (sink) and transfer of radionuclides between connected compartments, decay and
in-growth of the radionuclide. For the ith compartment, the ODE of a compartment
(k) has the following general form:
Fig. 17 Constructed compartmental model of radionuclide transport for the c alcu-lation case of well exposure pathway of SCE1.
Table 4 Release mechanisms, transport media and exposure mechanisms for the well on case of design scenario, SCE1
Scenario (calcula-tion cases)
Transport Media Contaminant Transport
Mechanisms Human Exposure
Mechanisms SCE1: Leaching (well expo-sure path-way) Waste Geosphere
Well (irrigation and drinking) Soil Crops Cows Atmosphere (dust) Advection Dispersion Water abstraction
for irrigation and drinking water Root uptake
Adsorption Ingestion of
water, pasture and soil by cows Leaching Ingestion of water, crops, and animal pro-duce Inhalation of dust External irradiation from soil
Eq. (2) 𝑑𝑑𝑑𝑑𝑖𝑖 = �� 𝜆𝜆 𝑗𝑗𝑖𝑖𝑑𝑑𝑗𝑗 + 𝜆𝜆𝑁𝑁𝑀𝑀𝑖𝑖 + 𝑆𝑆𝑖𝑖(𝑑𝑑)� − �� 𝜆𝜆𝑖𝑖𝑗𝑗𝑑𝑑𝑖𝑖 + 𝜆𝜆𝑁𝑁𝑑𝑑𝑖𝑖� 𝑑𝑑𝑑𝑑 𝑗𝑗≠𝑖𝑖 𝑗𝑗≠𝑖𝑖
where i, j indicate compartments; N, M are the amounts [Bq] of radionuclides N and M in a compartment (M is the precursor of N in a decay chain); S(t) is a time dependent external source of radionuclide N, [Bq/y]; λ., λN is the decay constant for radionuclide N (in 1/y); and λji , λij are transfer coefficients [1/y] representing the gain and loss of radionuclide N from compartments i and j.
For the calculation case of well exposure pathway, the transfer coefficient λleach,barrier is expressed as:
𝑞𝑞𝑖𝑖𝑖𝑖 Eq. (3)
= 𝜆𝜆𝑙𝑙𝑙𝑙𝑙𝑙𝑙𝑙ℎ,𝑏𝑏𝑙𝑙𝑏𝑏𝑏𝑏𝑖𝑖𝑙𝑙𝑏𝑏 𝜃𝜃
𝑤𝑤𝐷𝐷𝐷𝐷
where qin is the infiltration [m/y]; θw is water filled the porosity of the concrete wall of the vault [-]; D is depth of the wall through which the radionuclide is transported and R is the retardation factor (-) and given as:
𝜌𝜌𝐾𝐾 𝑑𝑑 Eq. (4)
𝐷𝐷 = 1 + 𝜃𝜃𝑤𝑤
where ρ is the density of the concrete wall [kg/m3]; K
d is the sorption coefficient of the concrete [m3/kg].
The transfer coefficient λleach,unsat is expressed as:
𝑞𝑞𝑖𝑖𝑖𝑖 Eq. (5)
=
𝜆𝜆𝑙𝑙𝑙𝑙𝑙𝑙𝑙𝑙ℎ,𝑢𝑢𝑖𝑖𝑢𝑢𝑙𝑙𝑡𝑡 𝜃𝜃𝜃𝜃𝐷𝐷𝐷𝐷
where qin is infiltration [m/y], θ is the total porosity in the medium [-]; ε is the de-gree of saturation of the medium; D is depth of the medium through which the ra-dionuclide is transported [m]; R is the retardation coefficient given by:
𝜌𝜌𝑢𝑢𝑖𝑖𝑢𝑢𝑙𝑙𝑡𝑡 (1 − 𝜃𝜃)𝐾𝐾𝑑𝑑 Eq. (6)
𝐷𝐷 = 1 + 𝜃𝜃𝜃𝜃
where ρunsat is the bulk density of the medium [kg/m3]; Kd is the sorption coeffi-cient of the medium[m3/kg], ε is the degree of saturation of the medium.
Transport of solute in the aquifer in general is described by an advection-disper-sion partial equation. The compartmental model can be used to approximate the solution of this solute transport problem. Xu et al., (2007) shows that discretisa-tion of a transport path into a few number of compartments results in a soludiscretisa-tion
that is still close to the analytical solution, and the amount of numerical dispersion is similar to the amount of physical dispersion. The rule of thumb is the number of compartments required should exceed Pe/2, where Pe is the Peclet number. As can be seen in Fig. 17, five compartments are used in the modelling. The transfer co-efficient λA,ij is expressed as
𝑞𝑞 Eq. (7)
=
𝜆𝜆𝐴𝐴,𝑖𝑖𝑗𝑗 𝐿𝐿⁄𝑛𝑛 𝜃𝜃
𝑤𝑤𝐷𝐷𝑤𝑤
where L is the total transport length [m]; n is a number of compartments [-]; θw is the porosity of the medium [-]; Rw is the retardation coefficient of the medium [-];
q is Darcy velocity given by
∂H Eq. (8)
𝑞𝑞 = −K 𝜕𝜕𝜕𝜕
where K is the hydraulic conductivity of the medium [m/y]; ∂H/∂x is the hydraulic gradient [-].
Once the radionuclide discharge flux to the well is determined the activity concen-trations for well water Cwell can be determined, in which the expression for deter-mining the activity concentrations for the well water is slightly modified from the original ISAM expression:
𝑄𝑄𝑔𝑔𝑙𝑙𝑔𝑔 Eq. (9)
𝐶𝐶 𝑤𝑤𝑙𝑙𝑙𝑙𝑙𝑙 = 𝑉𝑉
𝑤𝑤𝑙𝑙𝑙𝑙𝑙𝑙𝐷𝐷𝑢𝑢𝑙𝑙𝑡𝑡
where Qgeo is the flux of the radionuclides into the well (flux discharged to the well) [Bq/y]; Vwell is the well capacity [m3/y]. Further discussion of this well ca-pacity will be given in section 4.3.2.
The dose to a member of the critical group for these two calculation cases of the design scenario can be expressed as (in [Sv/y]):
𝐷𝐷𝐷𝐷𝐷𝐷𝐷𝐷 = 𝐷𝐷𝐷𝐷𝐷𝐷𝐷𝐷𝑖𝑖𝑖𝑖ℎ + 𝐷𝐷𝐷𝐷𝐷𝐷𝐷𝐷𝑙𝑙𝑒𝑒𝑡𝑡 + 𝐷𝐷𝐷𝐷𝐷𝐷𝐷𝐷𝑖𝑖𝑖𝑖𝑔𝑔 Eq. (10)
where Doseinh, Doseext and Doseing are the doses due to the inhalation, external exposure and the ingestion pathways [Sv/y].
The dose due to inhalation is expressed as:
𝐷𝐷𝐷𝐷𝐷𝐷𝐷𝐷𝑖𝑖𝑖𝑖ℎ = 𝐴𝐴𝑢𝑢𝑔𝑔𝑖𝑖𝑙𝑙 ∙ 𝑏𝑏𝑏𝑏 ∙ 8766 Eq. (11)
Where br is the breathing rate [m3/h]; 8766 are the hours in a year [h/y]; dustact and dustnorm are the dust concentrations during ploughing and non-ploughing ac-tivities [kg/m3]; %occup is the occupancy factor for ploughing activities [-]; DFinh
is the dose factor for inhalation [Sv/Bq]; Asoil is the concentration of the radionu-clide in the soil [Bq/kg], which can be expressed by a simple approximation as:
𝑖𝑖𝑖𝑖𝑖𝑖 Eq. (12)
𝐴𝐴𝑢𝑢𝑔𝑔𝑖𝑖𝑙𝑙 = 𝐶𝐶𝑤𝑤𝑙𝑙𝑙𝑙𝑙𝑙 (1 − 𝜃𝜃)𝜌𝜌
𝑢𝑢𝑔𝑔𝑖𝑖𝑙𝑙𝑇𝑇ℎ𝑢𝑢𝑔𝑔𝑖𝑖𝑙𝑙𝜆𝜆𝑙𝑙𝑒𝑒𝑒𝑒
where irr is the irrigation rate [m/y]; ρsoil is the soil dry bulk density [kg/m3];
Thsoil is the soil thickness [m]; λeff is an effective decay rate which can consists of radionuclide decay constant and the percolation of water through the soil column described in section 4.3.2 (Eq. (30)).
The dose due to external exposure is expressed as
𝐷𝐷𝐷𝐷𝐷𝐷𝐷𝐷𝑙𝑙𝑒𝑒𝑡𝑡 = 𝐴𝐴𝑢𝑢𝑔𝑔𝑖𝑖𝑙𝑙 ⋅ 8766 ⋅ 𝐷𝐷𝐷𝐷𝑙𝑙𝑒𝑒𝑡𝑡 Eq. (13)
where DFext is the external exposure dose factor [Sv/h per Bq/kg]. The dose due to ingestion is expressed as:
𝐷𝐷𝐷𝐷𝐷𝐷𝐷𝐷𝑖𝑖𝑖𝑖𝑔𝑔 = 𝐷𝐷𝐷𝐷𝐷𝐷𝐷𝐷𝑖𝑖𝑖𝑖𝑔𝑔_𝑤𝑤𝑙𝑙𝑡𝑡𝑙𝑙𝑏𝑏 + 𝐷𝐷𝐷𝐷𝐷𝐷𝐷𝐷𝑖𝑖𝑖𝑖𝑔𝑔_𝑙𝑙𝑏𝑏𝑔𝑔𝑜𝑜 + 𝐷𝐷𝐷𝐷𝐷𝐷𝐷𝐷𝑖𝑖𝑖𝑖𝑔𝑔_𝑙𝑙𝑖𝑖𝑖𝑖𝑛𝑛𝑙𝑙𝑙𝑙 Eq. (14)
where Doseing_water is the dose due to water ingestion [Sv/y]
𝐷𝐷𝐷𝐷𝐷𝐷𝐷𝐷𝑖𝑖𝑖𝑖𝑔𝑔_𝑤𝑤𝑙𝑙𝑡𝑡𝑙𝑙𝑏𝑏 = 𝐼𝐼𝑛𝑛𝐼𝐼𝑤𝑤𝑙𝑙𝑡𝑡 ⋅ 𝐶𝐶𝑤𝑤𝑙𝑙𝑙𝑙𝑙𝑙 ⋅ 𝐷𝐷𝐷𝐷𝑖𝑖𝑖𝑖𝑔𝑔 Eq. (15)
where Ingwat is the individual ingestion rate of freshwater [m3/y]; and DFIng is the dose coefficient for ingestion [Sv/Bq]; Kdw is the distribution coefficient for wa-ter/particles [m3/kg]; and part is the suspended particle concentration [kg/m3] in
the water (assumed to be zero for well water.
Eq. (16) 𝐷𝐷𝐷𝐷𝐷𝐷𝐷𝐷𝑖𝑖𝑖𝑖𝑔𝑔_𝑙𝑙𝑏𝑏𝑔𝑔𝑜𝑜 = � �𝐼𝐼𝑛𝑛𝐼𝐼𝑙𝑙𝑏𝑏𝑔𝑔𝑜𝑜�𝐴𝐴𝑢𝑢𝑔𝑔𝑖𝑖𝑙𝑙 ⋅ 𝑇𝑇𝐷𝐷𝑙𝑙𝑏𝑏𝑔𝑔𝑜𝑜�𝐷𝐷𝐷𝐷𝑖𝑖𝑖𝑖𝑔𝑔�
𝑏𝑏𝑔𝑔𝑔𝑔𝑡𝑡,𝑔𝑔𝑏𝑏𝑙𝑙𝑙𝑙𝑖𝑖,𝑔𝑔𝑏𝑏𝑙𝑙𝑖𝑖𝑖𝑖
where Ingcrop is the consumption rate of crop including root vegetables, green vegetables and grain [kg/y]; TFcrop is the soil to plant concentration factor for the crop including root vegetables, green vegetables and grain [Bq/kg fresh weight per Bq/kg dry soil].
𝐷𝐷𝐷𝐷𝐷𝐷𝐷𝐷𝑖𝑖𝑖𝑖𝑔𝑔_𝑙𝑙𝑖𝑖𝑖𝑖𝑛𝑛𝑙𝑙𝑙𝑙 Eq. (17) = � �𝐼𝐼𝑛𝑛𝐼𝐼𝑙𝑙𝑖𝑖𝑖𝑖𝑛𝑛𝑙𝑙𝑙𝑙�𝑞𝑞𝑤𝑤𝑙𝑙𝑡𝑡𝑙𝑙𝑏𝑏𝐶𝐶𝑤𝑤𝑙𝑙𝑙𝑙𝑙𝑙 + 𝑞𝑞𝑢𝑢𝑔𝑔𝑖𝑖𝑙𝑙𝐴𝐴𝑢𝑢𝑔𝑔𝑖𝑖𝑙𝑙 𝑏𝑏𝑙𝑙𝑙𝑙𝑒𝑒,𝑛𝑛𝑖𝑖𝑙𝑙𝑚𝑚 + 𝑞𝑞𝑜𝑜𝑙𝑙𝑢𝑢𝑡𝑡𝑢𝑢𝑏𝑏𝑙𝑙 𝐴𝐴𝑢𝑢𝑔𝑔𝑖𝑖𝑙𝑙𝑇𝑇𝐷𝐷𝑜𝑜𝑙𝑙𝑢𝑢𝑡𝑡𝑢𝑢𝑏𝑏𝑙𝑙 � × 𝑇𝑇𝐷𝐷𝑙𝑙𝑖𝑖𝑖𝑖𝑛𝑛𝑙𝑙𝑙𝑙𝐷𝐷𝐷𝐷𝑖𝑖𝑖𝑖𝑔𝑔�
where Inganimal is the annual animal product consumption rate (beef or milk) [kg/y]; qwater is the daily animal water intake [m3/day]; qsoil is the daily animal soil intake [kg/day] qpasture is the daily animal pasture intake [kg/day]; TFpasture is the soil to plant concentration factor for the pasture [Bq/ kg fresh weight per Bq/kg dry soil]; TFanimal is the transfer coefficient to the animal product [day/kg]. All the mathematical expressions above are adopted from ISAM report Vol. II (IAEA 2004b) and IAEA TECDOC-1380 (IAEA 2003b) except Eq. (12) which is a simple approximation. The concentration of soil Asoil [Bq/kg dry] is governed by a first order differential equation:
𝑑𝑑𝐴𝐴𝑢𝑢𝑔𝑔𝑖𝑖𝑙𝑙 𝑖𝑖𝑖𝑖𝑖𝑖 Eq. (18)
= −𝐴𝐴𝑢𝑢𝑔𝑔𝑖𝑖𝑙𝑙𝜆𝜆𝑙𝑙𝑒𝑒𝑒𝑒 + 𝐶𝐶𝑤𝑤𝑙𝑙𝑡𝑡𝑙𝑙𝑏𝑏
𝑑𝑑𝑑𝑑 (1 − 𝜃𝜃𝑤𝑤)𝜌𝜌𝑢𝑢𝑔𝑔𝑖𝑖𝑙𝑙𝑇𝑇ℎ𝑢𝑢𝑔𝑔𝑖𝑖𝑙𝑙
Assuming dAsoil /dt=0, Asoil is expressed as Eq. (12). Comparison of results ob-tained from this simple approximation and a dynamic biosphere model are dis-cussed in section 5.1.1.
4.2.2. Modelling of human intrusion scenario
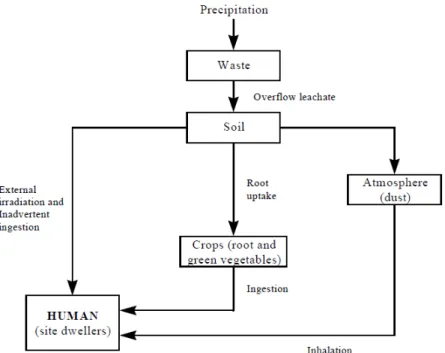
As mentioned earlier three human intrusion scenarios are selected, namely on-site residence and contamination by leachate (bathtub effect) SCE4, the on-site resi-dence scenario SCE6 and the road construction scenario SCE7 (see Fig. 14). The conceptual models for these three scenarios are shown in Fig. 18 – 20. Release mechanisms, transport media and exposure mechanisms for these three scenarios are identified in Table 5.
Fig. 18 Simplified representation of the conceptual model for the Post-closure
Bathtubbing Scenario (IAEA 2004b)
Fig. 19 Simplified representation of the conceptual model the Post-closure
Fig. 20 Simplified representation of the conceptual model the Post-closure Road
Construction Scenario SCE7 (IAEA 2004b)
For three human intrusion scenarios there are analytical solutions available in IAEA’s technical document 1380 (IAEA 2003b). Descriptions of the solutions are given below.
Bathtubbing scenario (SCE4)
The analytical solution of the concentration of radionuclides in the overflowing leachate Cdisp [Bq/m3] used in evaluation of the bathtubbing scenario is expressed as:
𝐴𝐴𝑛𝑛𝑖𝑖 Eq. (19)
𝐶𝐶𝑑𝑑𝑖𝑖𝑢𝑢𝑜𝑜(𝑑𝑑) = 𝐷𝐷−𝜆𝜆𝑡𝑡 𝑉𝑉
𝑑𝑑𝑖𝑖𝑢𝑢𝑜𝑜𝑢𝑢𝑖𝑖𝑖𝑖𝑡𝑡 (𝜔𝜔𝑙𝑙𝑑𝑑 + 𝜌𝜌𝑏𝑏𝑑𝑑𝐾𝐾𝑑𝑑𝑑𝑑)
where e-λt is the radioactive decay before the scenario [-]; A
mi is the initial activity in the disposal unit [Bq]; Vdispunit is the volume of the disposal unit [m3]; ωcd is the moisture content of the disposal unit [-]; ρbd is the dry bulk density in the disposal unit [kg/m3]; Kd
d is the radionuclide distribution coefficient in the disposal unit [m3/kg].
The dose due to “bath-tub” effect is a sum of external dose (Doseext), inhalation dose (Doseinh) and ingestion dose (Doseing).
𝑂𝑂𝐷𝐷 Eq. (20)
𝐷𝐷𝐷𝐷𝐷𝐷𝐷𝐷𝑙𝑙𝑒𝑒𝑡𝑡 = 𝜌𝜌 𝐶𝐶𝑑𝑑𝑖𝑖𝑢𝑢𝑜𝑜(𝐷𝐷𝑠𝑠 ∙ 𝑑𝑑𝑖𝑖𝑖𝑖 + 𝑑𝑑𝑔𝑔𝑢𝑢𝑡𝑡 )𝐷𝐷𝐷𝐷𝑙𝑙𝑒𝑒𝑡𝑡 𝑢𝑢𝑔𝑔𝑖𝑖𝑙𝑙 ∙ 𝑇𝑇ℎ𝑢𝑢𝑔𝑔𝑖𝑖𝑙𝑙
where OF is the water overflow to the garden during one year [m]; ρsoil is the soil dry bulk density of the soil [kg/m3]; Thsoil is the soil thickness [m]; Cdisp is the
concentration of radionuclides in overflowing leachate [Bq/m3]; sf is the shielding
factor [-]; tin is the time spent indoors [h/y]; tout is the time spent outdoors [h/y];
DFext is the external exposure dose factor [Sv/h per Bq/kg].
Table 5 Release mechanisms, transport media and exposure mechanisms for three hu-man intrusion scenarios
Scenarios Contami-nant Release Mecha-nisms Contami-nant Release Media Contami-nant Transport Media Contami-nant Transport Mecha-nisms Human Exposure Mecha-nisms
SCE4: Leaching Leachate Overflow Overflow of Ingestion of
Bathtub- leachate leachate crops
bing Soil Atmosphere (dust) Crops Suspension Root uptake Adsorption Inadvertent ingestion of soil Inhalation of dust External irradiation from soil
SCE6: Excavation Excavated House Root uptake Ingestion of
On-site waste crops
residence Soil Atmosphere (dust) Crops Adsorption Suspension Inadvertent ingestion of soil Inhalation of dust External irradiation from soil
SCE7: Excavation Dust Atmosphere Suspension Inadvertent
Road (dust) ingestion of
construc- contami-tion nated material and waste Inhalation of dust External irradiation from contami-nated material and waste
𝑂𝑂𝐷𝐷 Eq. (21) 𝐷𝐷𝐷𝐷𝐷𝐷𝐷𝐷𝑖𝑖𝑖𝑖ℎ = 𝜌𝜌 𝐶𝐶𝑑𝑑𝑖𝑖𝑢𝑢𝑜𝑜(𝑑𝑑𝑑𝑑𝐷𝐷𝑑𝑑𝑖𝑖𝑖𝑖𝑏𝑏𝑖𝑖𝑖𝑖𝑖𝑖𝑑𝑑𝑖𝑖𝑖𝑖 𝑢𝑢𝑔𝑔𝑖𝑖𝑙𝑙 ∙ 𝑇𝑇ℎ𝑢𝑢𝑔𝑔𝑖𝑖𝑙𝑙 + 𝑑𝑑𝑑𝑑𝐷𝐷𝑑𝑑𝑔𝑔𝑢𝑢𝑡𝑡 𝑏𝑏𝑖𝑖𝑔𝑔𝑢𝑢𝑡𝑡 𝑑𝑑𝑔𝑔𝑢𝑢𝑡𝑡 )𝐷𝐷𝐷𝐷𝑖𝑖𝑖𝑖ℎ
where dustin, dustout are the indoor and outdoor dust levels [kg/m3]; brin, brout are the indoor and outdoor breathing rates [m3/h]; DF
inh is the dose factor for in-halation [Sv/Bq].
𝑂𝑂𝐷𝐷 Eq. (22)
𝐷𝐷𝐷𝐷𝐷𝐷𝐷𝐷𝑖𝑖𝑖𝑖𝑔𝑔 = 𝜌𝜌 𝐶𝐶𝑑𝑑𝑖𝑖𝑢𝑢𝑜𝑜�𝑇𝑇𝐷𝐷𝑣𝑣𝑙𝑙𝑔𝑔𝑡𝑡 𝑄𝑄𝑣𝑣𝑙𝑙𝑔𝑔𝑡𝑡 + 𝑄𝑄𝑢𝑢𝑔𝑔𝑖𝑖𝑙𝑙�𝐷𝐷𝐷𝐷𝑖𝑖𝑖𝑖𝑔𝑔 𝑢𝑢𝑔𝑔𝑖𝑖𝑙𝑙 ∙ 𝑇𝑇ℎ𝑢𝑢𝑔𝑔𝑖𝑖𝑙𝑙
where TFveget is the soil to plant concentration factor for the vegetable [Bq/kg fresh weight per Bq/kg dry soil]; Qveget is the vegetable consumption rate [kg/y];
Qsoil is the inadvertent soil ingestion rate [kg/y]; DFing is the dose factor for in-gestion [Sv/Bq].
On-site residence scenario (SCE6)
The analytical expression of activity to which the on-site resident is exposed, Ares [Bq/kg of waste], is given by:
𝐴𝐴𝑏𝑏𝑙𝑙𝑢𝑢 = 𝐴𝐴𝑛𝑛𝐷𝐷−𝜆𝜆𝑡𝑡1 ∙ 𝑑𝑑𝑖𝑖𝑑𝑑 Eq. (23)
where Am is the initial concentration of the radionuclide disposed waste [Bq/kg];
λ is the radioactive decay constant [1/y] (if required other mechanisms contrib-uting to diminishing the radioactivity could also be incorporated in an effective decay term (λeff)); t1 is the time before exposure starts [y]; dil is the dilution factor [-].
The dose due to on-site residence is a sum of external dose (Doseext), inhalation dose (Doseinh) and ingestion dose (Doseing).
𝐷𝐷𝐷𝐷𝐷𝐷𝐷𝐷𝑙𝑙𝑒𝑒𝑡𝑡 = 𝐴𝐴𝑏𝑏𝑙𝑙𝑢𝑢(𝐷𝐷𝑠𝑠 ∙ 𝑑𝑑𝑖𝑖𝑖𝑖 + 𝑑𝑑𝑔𝑔𝑢𝑢𝑡𝑡 )𝐷𝐷𝐷𝐷𝑙𝑙𝑒𝑒𝑡𝑡 Eq. (24)
𝐷𝐷𝐷𝐷𝐷𝐷𝐷𝐷𝑖𝑖𝑖𝑖ℎ = 𝐴𝐴𝑏𝑏𝑙𝑙𝑢𝑢(𝑑𝑑𝑑𝑑𝐷𝐷𝑑𝑑𝑖𝑖𝑖𝑖𝑏𝑏𝑖𝑖𝑖𝑖𝑖𝑖𝑑𝑑𝑖𝑖𝑖𝑖 + 𝑑𝑑𝑑𝑑𝐷𝐷𝑑𝑑𝑔𝑔𝑢𝑢𝑡𝑡 𝑏𝑏𝑖𝑖𝑔𝑔𝑢𝑢𝑡𝑡 𝑑𝑑𝑔𝑔𝑢𝑢𝑡𝑡 )𝐷𝐷𝐷𝐷𝑖𝑖𝑖𝑖ℎ Eq. (25)
Eq. (26) 𝐷𝐷𝐷𝐷𝐷𝐷𝐷𝐷𝑖𝑖𝑖𝑖𝑔𝑔 = 𝐴𝐴𝑏𝑏𝑙𝑙𝑢𝑢�𝑇𝑇𝐷𝐷𝑣𝑣𝑙𝑙𝑔𝑔𝑡𝑡 𝑄𝑄𝑣𝑣𝑙𝑙𝑔𝑔𝑡𝑡 + 𝑄𝑄𝑢𝑢𝑔𝑔𝑖𝑖𝑙𝑙�𝐷𝐷𝐷𝐷𝑖𝑖𝑖𝑖𝑔𝑔
Road construction scenario (SCE7)
The analytical solution of the activity concentration to which the intruder is simi-lar to the Eq. (23) and is expressed as Aint [Bq/kg of waste], which is given by
where Am is the initial concentration of the radionuclide disposed [Bq/kg of waste]; λ is the radioactive decay constant [y] (if required other mechanisms con-tributing to diminishing the radioactivity could also be incorporated in an effec-tive decay term (λeff)); t1 is the time before intrusion starts [y]; dil is the dilution factor [-].
The dose due the road construction scenario can be expressed as (in [Sv/y]): 𝐷𝐷𝐷𝐷𝐷𝐷𝐷𝐷 = 𝐴𝐴𝑖𝑖𝑖𝑖𝑡𝑡 �𝑄𝑄𝑢𝑢𝑔𝑔𝑖𝑖𝑙𝑙𝐷𝐷𝐷𝐷𝑖𝑖𝑖𝑖𝑔𝑔 + 𝐷𝐷𝐷𝐷𝑙𝑙𝑒𝑒𝑡𝑡 + 𝑏𝑏𝑏𝑏 ∙ 𝑑𝑑𝑑𝑑𝐷𝐷𝑑𝑑 ∙ 𝐷𝐷𝐷𝐷𝑖𝑖𝑖𝑖ℎ�𝑑𝑑2 Eq. (28)
where Aint is the activity to which the intruder is exposed [Bq/kg of waste]; Qsoil is the inadvertent soil ingestion rate of the intruder [kg/h]; DFing is the dose factor for ingestion [Sv/Bq]; DFext is the external exposure dose factor [Sv/h per Bq/kg];
br is the breathing rate of the intruder [m3/h]; dust is the dust level experienced by the intruder [kg/m3]; DF
inh is the dose factor for inhalation [Sv/Bq]; t2 is the expo-sure duration [h].
4.2.3. Modelling of alternative scenarios
Two scenarios are selected as alternative scenarios, namely the flooding scenario and landslides scenario.
The model used for the flooding scenario is the same to the model used for the bathtubbing scenario (Eq. (19)). Once the concentration of radionuclides in the overflowing leachate Cdisp is determined rest of calculations are exact the same as in the bathtubbing scenario (see section 4.2.2).
For the landslides scenario we assume that the result of the on-site residence sce-nario can cover this case.
4.3 Biosphere objects and mathematical models
4.3.1. Identification of biosphere objects
The BIOMASS methodology (IAEA 2003a) was illustrated with Example Refer-ence Biospheres (ERBs) using generic biosphere models. ERB2b model deals with the discharge of contaminated groundwater or surface water to overburden media in the biosphere (see Fig. 21), which has similarities to the farm system to be considered in the SCE1. The dimensions of biosphere objects are important since the total area largely determines the overall water balance in the landscape and has significant impact on the final calculated doses.
Fig. 21 Site-generic interpretation of a stylised landscape dose objects.
Illustra-tion of the ERB2b catchment, (IAEA 2003a, Figure C11.3).
In this assessment the GIS tool Global Mapper 19.11 is used to obtain catchment
areas consistent with local topography and identify the relevant object areas based on the site specific DEM (digital elevation model) data provided in the Radiologi-cal Object Report. The details of identification of catchment areas can be found in Guerfi et al., (2019).
Fig. 22 shows identified catchments and potential streams on the map of the site from the watershed analysis in the GIS tool. The stream paths are potential since they represent the local low points of the topography determined by the 8-point pour algorithm in the mapping software, i.e., the path where particles dropped onto the surface of the terrain would accumulate. In this way they represent the preferential flow path where streams would flow if the local aquifer were to out-crop at the surface. They are therefore treated as indications of the surface flow system associated with the local watershed configuration.
The disposal facility is within a single catchment of area 1 140 907 m2 (green
shading). Just south of the flow system outlet from this landscape object there is a confluence with the watershed to the west, with area 1 453 830 m2 (red shading).
The area for the dose calculations would be located in the southern area (purple). This covers a large area but the focus is on the area downslope from the conflu-ence of boundary of the drainage system. The water balance of the object can be conservatively derived from the red and green areas, areas are listed in Table 6.
Fig. 22 Catchments and surface drainage streams around the disposal site
When identifying the candidate areas for the biosphere objects or the farm system the requirement is to determine locations in the landscape where the highest con-centrations of radionuclides remobilised from the disposal facility can occur and then to set potential exposure pathways, as defined in SCE1. The focus is there-fore on areas as close to the disposal site boundary as possible.
The aim of the identification is to define areas in the landscape for potential expo-sure, they need not necessarily correspond to identified areas in the present day landscape. The procedure is as follows:
1. Look for potential areas in the landscape (aided by the orthophoto) and the topographic map of the site (the DEM)
2. Candidate areas should be
a. Close to the main drainage path as identified from analysis of the DEM, since radionuclides leached from the repository will be transported in groundwater or the flowing surface water. If wells are considered in the modelled system placing the objects close to the axis of the drainage system means that the concentration in the local near-surface aquifer will not be underestimated
b. Close to the disposal facility site boundary so as to avoid excessive spatial dilution
c. Large enough to supply the dietary needs of at least a small family group of, say, four adults. This is typically up to 2×10⁴ to 105 m2.
3. Account should be taken of the confluence of drainage systems from dif-ferent watersheds
Two candidate objects are indicated in Fig. 23. The first object is closest to the disposal facility site boundary and is situated on the land adjacent to the drainage stream that runs through the waste site itself and is along boundary of the drainage
system of the western catchment. The second object is identified by an area along the valley floor of the combined drainage system. The areas of the two objects are, respectively, 2.1×10⁴ m2 and 1.8×10⁴ m2.
According to the landuse map (Fig. 12) the area of object 1 is currently agricul-tural land with woodland along the drainage system. It is selected as the closest location with potential for cultivation to the site boundary. The distance between the object 1 and the disposal facility is about 300 m.
Object 2 is classed as non-productive land and natural pasture. For assessment purposes there appears to be no reason why the two areas could not be cultivated, although the land area close to the stream path is relatively steep. According to the orthophoto, the drainage system is not necessarily above ground so a well in the two areas, used for cultivation purposes is the most realistic approximation.
Table 6 Areas of subcatchments in the map (Fig. 22).
landscape area enclosed area m2
Disposal site catchment (green) 1.1E+06
Western catchment (red) 1.5E+06
Downstream catchment (purple) 1.2E+06
4.3.2. Formulation of mathematical models for the biosphere ob-ject
Site description
The ISAM methodology is illustrated using a specific example based around the Vaalputs site in the Republic of South Africa (IAEA, 2004a). The application of the resulting models (IAEA, 2004b) makes use of data from similar climate ana-logues around the planet, for example from the Yucca Mountain site in the west-ern USA. The ISAM methodology is widely applicable but the resulting models are not site-specific in that they are not descriptive of a single site but are more ge-nerically applicable to sites with arid climates.
The customisation of the ISAM model for the Chişinău site in Moldova incorpo-rates site-descriptive material to develop a clearer expression of the FEPs specifi-cally relevant to the site in question. The model of the vault and for the release and transport of radionuclides through the geosphere are well represented by the ISAM model, with minor adjustments to parameterisation relating to water fluxes in the system. In the biosphere, however, there are site-specific details that can be used to both simplify the structure of the biosphere dose model and to better rep-resent key features.
Fig. 23 shows the results of an analysis topography of the Chişinău site, emphasis-ing the surface drainage system (a small surface water stream which is non-per-manent) and the topography of the site and two candidate biosphere objects, downstream from the repository location, beyond the disposal facility boundary. Of the two candidate objects shown in Fig. 23, Object 1 just outside the disposal facility site boundary is selected for the dose calculations:
• It is the closest to the disposal facility site boundary, so that the concentra-tions in local groundwater resources will be higher with the reduced im-portance of dispersion in the groundwater flow system,
• It is part of the local catchment area that collect water that flows though the RADON facility itself (Fig. 23), again minimising dilution of surface water resources, and
• Although neither object is particularly high quality land, it is the better of the two for cultivation.
The selected object is an area of land (2.1 hectare), forming part of a valley on ei-ther side of the main drainage channel from the local catchment in which the re-pository is situated. The stream is small and non-permanent, making well water the most likely source of drinking and irrigation that need by assumed for the rep-resentation of the exposed group. The area is somewhat restrictive but is sufficient for a small family group, practicing subsistence agriculture. Doses calculated in this model will therefore by expected to be somewhat conservative.
Review of Biosphere FEPs
A systematic review of the ISAM interaction matrix has been caried out to deter-mine which FEPs are active at the site. Fig. 24 compares the interaction matrix used in the development of the ISAM example model and final interaction matrix developed here to define the biosphere submodel.
The model for biosphere dose calculations is set out in Section 4.2.1 (Eq. 9 to 18). Review of the ISAM interaction matrix in the context of the system description in Section 4.3.1 allows a site-specific biosphere dose model to be formulated follow-ing the guidance in Kłos and Thorne (2020) that was developed as part of the MODARIA II update of the BIOMASS methodology (IAEA, 2020). The empha-sis is on turning conceptual models defined by the interaction matrix for a site into mathematical descriptions suitable for the dose assessment. There are three stages:
i. Review of ISAM biosphere interaction matrix (IAEA, 2004b, Fig. B.6, shown Fig. 24a) identify local factors of relevance from the site. The non-relevant interactions are identified and taken out of consideration and the model is restructured and simplified where possible so that the number of leading diagonal elements is reduced where possible but extended (nesting sub-models) if required.
ii. The final version of the interaction matrix (Fig. 24b) therefore contains all of the relevant model components (leading diagonal elements – the LDEs) as well as all of the interactions that need to be represented mathematically in the model. In practical terms, the LDEs become the key reservoirs of
contaminants in the model, i.e., the active compartments in the compart-mental model.
iii. The existing model from the ISAM report is audited against the revised model description in Fig. 24b.
The key features of the procedure are described below.
(a) 3D-map
(b) 2D map
Fig. 23 Candidate areas for potential radiological objects. With reference to the