MASTER'S THESIS
Hydro-Geotechnical Study of Tailings at
Aitik Mine
Emphasis on Hydraulic Conductivity of the Deposit
Aymiro Abitew
Master of Science (120 credits) Civil Engineering
Luleå University of Technology
Hydro-Geotechnical Study of Tailings at
AITIK Mine
Aymiro Ambachew Abitew
Master Programme in Civil Engineering, with specialization in mining and
Geotechnical Engineering
Luleå University of Technology
1
Abstract
The main objective of this study is to characterize the tailings deposit at Aitik Mine in terms of its hydro geotechnical properties with more emphasis on hydraulic conductivity and present their vertical and horizontal distribution. In this study, relationship between each parameter has also been identified. The investigation has been done in three sections which cover approximately 3km2 of area and 4-5meters vertically. 3-5 test pits have been excavated in each section and disturbed and undisturbed samples are collected from various levels. Apart from in situ tests like balloon density, laboratory investigations have been done on the collected samples. These tests includes: Proctor compaction, particle density termination, grain size analysis, and permeability. Evaluation of existing empirical relations between grain size analysis and hydraulic conductivity were also one of the aims of this thesis work.
The horizontal hydraulic conductivity has been found to have a good correlation to fine fraction and void ratio. Similar to the results of Jantzer et al (2008), the increased void ratio did not correspond to vertical hydraulic conductivity. Based on evaluation of Hazen (1911) and Chapuis et al (2003) formulas using the samples collected, conclusions have been made. Therefore, Hazen formula (1911) has given 25 and 45 times the measured values of vertical and horizontal hydraulic conductivity respectively. On the other hand, Chapuis et al (2003) has not been succeeded for prediction of hydraulic conductivity of undisturbed samples. However, it has given comparatively good prediction of hydraulic conductivity for disturbed samples which are compacted to their field dry density.
Particle density, porosity and void ratio results are in agreement with the range determined by Yunxin (2001), Shamsai (2007), and Jantzer et al (2008) on different tailings deposit. Ice layers are encountered exactly above layers with higher silt and clay contents. Silty SAND is discovered to be the predominant soil type in the investigated area.
Because the study was able to cover only part of the whole deposit, further detailed investigation covering the whole area and depth of the deposit is recommended to be done in the future. Additionally, monitoring and continuous measurements are important to minimize uncertainty that could be caused by seasonal tailings property changes.
2
Contents
Abstract ...1 Acknowledgement ...8 1 Problem background ...9 1.1 Introduction ... 101.2 Location and Site Description ... 11
1.3 Geology and reserves ... 13
1.4 Mining and production at Aitik ... 14
1.5 Tailing Dam at Aitik ... 14
2 Aims and Methodology of the study ... 16
2.1 Aims ... 16
2.2 Methodology ... 16
2.2.1 Field study comprises the following activities: ... 17
2.2.2 Laboratory tests ... 17
3 Literature review ... 19
3.1 Hydrological and geotechnical properties of tailings material ... 19
3.1.1 Geoffrey Blight (2010) ... 19
3.1.2 Jantzer et al (2008) ... 20
3.1.3 A. Shamsai et al (2007) ... 21
3.1.4 R. Rodriguez (2006) ... 23
3.1.5 Yunxin et al (2001) ... 24
3.2 Determination of hydraulic conductivity from grain size distribution ... 26
3.2.1 Chapuis et al (2003) ... 27
3
4 Field and Laboratory investigation ... 30
4.1 Field Investigation ... 30
4.1.1 Sampling and soil profile logging ... 31
4.1.2 Balloon density test set... 32
4.2 Laboratory investigation ... 34
4.2.1 Proctor compaction ... 35
4.2.2 Particle density/Specific Gravity ... 35
4.2.3 Porosity and void ratio ... 37
4.2.4 Particle size analysis ... 37
Hydrometer analysis ... 39
Pipette Analysis ... 41
4.2.5 Permeability test ... 43
5 Result and discussion ... 46
5.1 Stratigraphy ... 46
5.2 Field bulk and dry density ... 50
5.3 Proctor density ... 52
5.4 Particle density and phase relationships ... 54
5.5 Grain size distribution ... 57
5.6 Hydraulic Conductivity of the tailing deposit material ... 61
5.7 Relationship between hydraulic conductivity and different physical parameters ... 65
5.7.1 Variation of Permeability with void ratio ... 65
5.7.2 Correlation between fine fraction and hydraulic conductivity ... 66
5.8 Emperical correlation between hydraulic conductivity and grain size analysis ... 68 6 Conclusion and Recommendation ... Error! Bookmark not defined.
4
6.1 Conclusions ... Error! Bookmark not defined. 6.2 Recommendations ... Error! Bookmark not defined.
7 Bibliography ... 73
8 Appendixes ... 76
8.1 Appendix A: Permeability test result of all samples ... 77
8.2 Appendix B: Logs of trial pits ... 78
8.3 Appendix C: Results of Grain size analysis ... 84
8.4 Appendix D: Results of Field bulk density, Dry density and Water Content ... 86
8.5 Appendix E: Location of pits and key for naming of samples ... 88
List of Tables Table 1: Measured and predicted hydraulic conductivity at Aitik according to (I. Jantzer, et al, 2008) ... 21
Table 2: Basic properties of copper mine tailings: (after Yunxin et al. 2001) ... 24
Table 3: Balloon Density test locations ... 33
Table 4: Samples taken for sieving from each section ... 38
Table 5: Maximum dry density and optimum moisture content from Modified proctor test. ... 53
Table 6: Summarized fractions of sand, silt and clay at a depth between 1.5 and 2.0meters. ... 58
Table 7: Summarized values of the total grain size distribution test ... 60 Table 8: Relation between Hazen’s result and measured vertical hydraulic conductivity ...Error!
Bookmark not defined.
Table 9: Relation between Hazen’s result and measured Horizontal hydraulic conductivity .Error!
Bookmark not defined.
Table 10: calculated K by Chapius et al. (2003) formula and measured K .... Error! Bookmark not
5
Table 11: Relation between calculated (by Chapuis et al. 2003) formula and measured hydraulic conductivity values ... Error! Bookmark not defined.
List of Figures
Figure 1: 3D topographical setup of the tailings storage facility dam site ... 10 Figure 2: Location map of the area (Tailings deposit of Aitik mine), after (GoogleMap, 2011) .. 12 Figure 3: Geological map of Aitik mine (Sammelin, 2011) ... 13 Figure 4: The three main methods for tailings dam construction, upstream (a), centre line (b) and downstream (c) construction... 15 Figure 5: Comparison of grain size distribution of different copper mine tailings (Abolfazl Shamsai Ali Pak, S. Mohyeddin Bateni, S. Amir Hossein Ayatollahi, 2007) ... 21 Figure 6: Experimental test data on hydraulic conductivity of tailings (Abolfazl Shamsai et al (2007) ... 22 Figure 7: Grain- size distribution of ACL MW obtained by laser technique (left), and Relation between saturated hydraulic conductivity and void ratio (right) (After Rodriguez, 2006) ... 23 Figure 8: Grain-size distribution of copper tailings, (after Yunxin et al, 2001) ... 25 Figure 9: Relation between measured and predicted hydraulic conductivity (After Chapuis et al, 2003) ... 28 Figure 10: Bench shaped wall of trial pits (Left) and excavator used to burrow the trial pits (Right) ... 30 Figure 11: Selected sections of investigation ... 31 Figure 12: Undisturbed samples taken for hydraulic conductivity test ... 32 Figure 13: Balloon density test set (a), and oven dried samples for moisture content
determination (b). ... 34 Figure 14: Pycnometers used for particle density determination. ... 36 Figure 15: Electrical sieve shaker used ... 38
6
Figure 16: Hydrometer used type 151H (Left) and hydrometer testing on tailings (Right) ... 40
Figure 17: Schematic diagram showing regular pipette test set used; After (Bardet, 1997) ... 41
Figure 18: Equipments used for permeability test, cylinder (1), inlet cap (2) and out let (3) caps, filter (4) and schematic diagram of constant head permeability test (Right) ... 44
Figure 19: typical chart showing variation of hydraulic conductivity during testing time and its stability at the end. ... 45
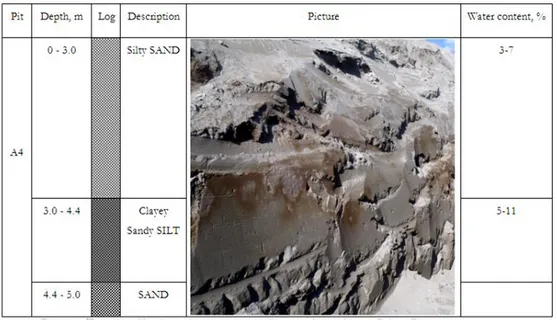
Figure 20: Side and top view of ice layer at a distance of 320m from A-B dam and 1.1m depth 47 Figure 21: Typical profile of test pit at approximate distance of 480m from A-B dam (Pit A4) .. 47
Figure 22: typical profile of pits having ice layer (pit B3 and B4) ... 48
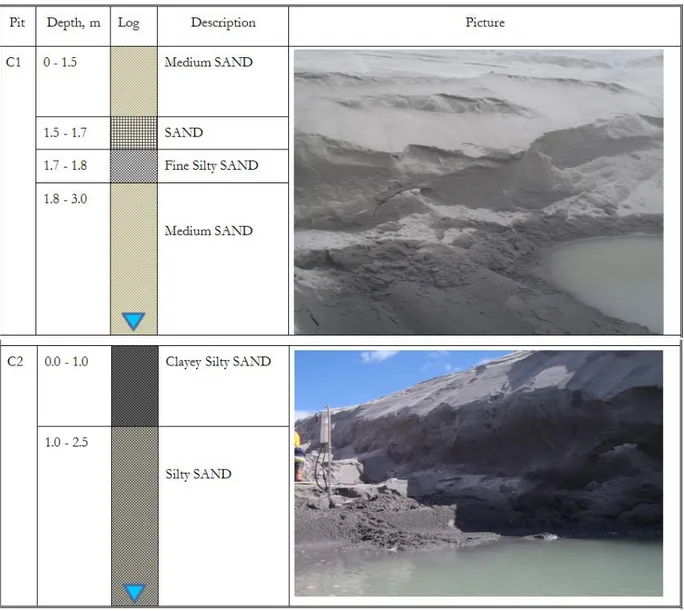
Figure 23: Soil profile of pit C1 and C2 along Section-C ... 49
Figure 24: Field dry density in relation to depth. ... 51
Figure 25: Variation of field bulk density with distance from C-D dam along section B for depth ranges from 0 - 2.5m. ... 50
Figure 26: Distribution of dry density along section-A from centerline of dam A-B towards the pond. ... 51
Figure 27: Variation of field bulk density at different depths along section-C ... 50
Figure 28: Modified proctor compaction curves and zero air void of soils from the tailing. ... 53
Figure 29: Contour map showing the distribution of particle density at a depth of 0-0.65m ... 54
Figure 30: Vertical distribution of particle density at different distances from A-B dam along Section A ... 55
Figure 31: Variation of porosity with depth along Section- A (Left) and Section B (Right) ... 55
Figure 32: Horizontal variation of porosity in the studied area. ... 56
Figure 33: Void Ratio, e with depth at a distances of 130, 240, and 480m from A-B dam along Section A ... 57
Figure 34: Frequency of sand, silt and clay fraction at a depth from 1.5-2.0m along section-A (Top left), Section-B (Top Right) and Section-C (Bottom) ... 59
7
Figure 35: Typical Grain size distribution of dominant layers (a) and layers under ice layer (b). 60
Figure 36: Frequency distribution of Vertical hydraulic conductivity ... 61
Figure 37: Frequency distribution of horizontal hydraulic conductivity ... 61
Figure 38: Relation between vertical and horizontal hydraulic conductivity... 62
Figure 39: Reduction of Kr with distance from A-B dam ... 63
Figure 40: Vertical hydraulic conductivity along section-A at a depth of 1.5-2m. ... 63
Figure 41: Vertical hydraulic conductivity along three sections at a depth of 1.5-2.5m ... 64
Figure 42: Horizontal hydraulic conductivity along three sections at a depth of 1.5-2.5m ... 64
Figure 43: Vertical hydraulic conductivity with void ratio. ... 65
Figure 44: Horizontal hydraulic conductivity with void ratio. ... 66
Figure 45: Relation between fine fraction and Vertical permeability ... 67
Figure 46: Relation between fine fraction and horizontal permeability ... 67 Figure 47: Relation between measured and predicted k on disturbed samples .. Error! Bookmark
8
Acknowledgement
First and foremost, I thank the almighty God for everything!
I am heartily grateful to my supervisor, Professor Sven Knutsson, who for his valuable supervision and support from the preliminary to the concluding level. Without him this thesis would not have been completed
I also owe sincere and earnest thankfulness to Håkan Åkerlund who supported me in the field investigation and for providing me vital tips on writing my report.
It is a great pleasure to thank everyone who helped me to write my dissertation successfully; Dr. Tommy Edeskär for your guidance in planning and organizing the field investigation as well as commenting on thesis report, Lic. Eng. Kerstin Pousette for your priceless advices and support in the laboratory work, Dr. Hans Mattsson, Prof. Nadir Nadhir Al-Ansari for your important ideas. I am truly indebted and thankful to Jens Johansson and Roger Knutsson who were with me at the very challenging field conditions and helped me in most of the practical works.
Special thanks would goes to research eng. Thomas Forsberg and technician Ulf Stenman who were key persons in smoothening all the laboratory works.
I am obliged to many of my colleagues and classmates who supported me, especially Amin Zenalie who were with me all the time, from the beginning to the end. I would like to show my gratitude to Laith Al-Taie for his repetitive encouragement and guidance in many ways during my research.
I thank Lulea University of Technology, department of civil environmental and Natural resource engineering, SWECO AB, and NEW BOLIDEN36 AB, for organizing and funding this research. Finally, I offer my regards and blessings to my parents Etalem and Gashe for your endless support.
9 Aymiro Ambachew Abitew
Lulea, Sweden, 2012
1 Problem background
Investigating and getting to know about the major geotechnical characteristics is very crucial before any numerical modeling or empirical description of tailings deposit. These modeling could be hydro geological such as water balance of deposit to get major inputs for designing competent and stable waste storage facility or tailings dam. In other words, investigations and detail descriptions of the deposit in terms of its degree of compaction, particle size distribution, and layering sequences of different types of soils (Stratigraphy) is vital. In the case of this particular thesis research, many important geotechnical parameters which are useful for modeling the deposit with their distribution have been described in detail.
The study deposit is tailings of Aitik Copper mine, owned by Boliden. It is the biggest open pit mine in Europe, and the waste material deposit so far has a vertical thickness of more than 50m. Tailings deposit of Aitik mine is impounded by an old dam which had been raised for several times following the increment of volume of deposited tailings. The main purpose of the research is to determine defined and representative geotechnical parameters of the deposit material especially hydraulic conductivity for it is the main component of water balance model. The aim of this model is to check whether the tailings dam rising is feasible in terms of stability and environmental aspects or not. There are a number of environmental issues about tailings deposit. One of the main and solution demanding problem is the existence of sulfide rich tailings with high potential to be oxidized and finally converted in to sulfuric acid. The formation of sulfuric acid could leads to isolation of hazardous heavy metals through leaching process. Therefore, keeping the deposit out of contact to the atmosphere is very important. Covering the deposit either with another environmental friendly material (dry method) or by water is common practice. However, for tailings deposit like Aitik which has large area, the dry method seems to be comparatively uneconomical. On the other hand, covering the deposit by water is not an easy task especially after the mine’s closure, because rain will be the only source of water. For this
10
reasons, knowing the actual hydraulic conductivity would be very crucial in order to simulate, plan, and use the storage facility effectively.
On the other hand, one has to take in to consideration that design and construction of tailings dam using higher safety factor is very important in order to prevent humans’ loss of life and damages of property due to tailings dam failures. For this reason, it has to be a focus of study to get the appropriate input for the design to be produced.
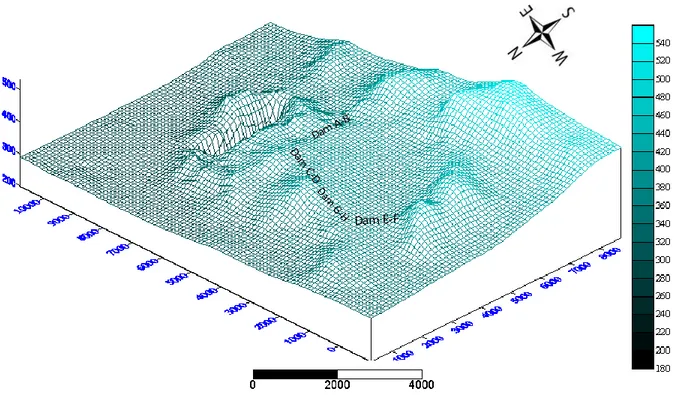
Figure 1: 3D topographical setup of the tailings storage facility dam site
1.1 Introduction
Tailings consist of ground rock and process effluents that are generated in a mine processing plant. Mechanical and chemical processes are used to extract the desired product from the run of the mine ore and produce a waste stream known as tailings. (J.Engels , 2002 - 2011)The unrecoverable and uneconomic metals, minerals, chemicals, organics and process water are discharged, normally as slurry, to a final storage area commonly known as a Tailings Storage Facility (TSF).
11
Physical and chemical characteristics of tailings and their ability to mobilize metal constituents are of great and growing concern (ICOLD and UNEP, 2001)
Tailings are generally stored on the surface as well as in underground as a back fill. The tailings in Aitik are retained in four impoundment dykes made of earth materials. Advances in technology allow lower grade ores to be exploited, generating higher volumes of waste that require safe storage (Example Aitik Mine). Environmental regulations are also advancing, placing more stringent requirements on the mining industry, particularly with regard to tailings storage practices.
The majority of historical tailings related incidents have been influenced by hydro geotechnical, physical and chemical properties of the tailings itself. This is mainly because most of the times the tailings itself serves as a construction material for the tailings dam. The parameters that influence the stability, operation and management of the storage facility have been identified for part of the deposit, which could be assumed as representative of the tailings deposit.
1.2 Location and Site Description
The Boliden-owned Aitik mine was opened in 1968. Aitik is an open pit copper mine and mill located north of the Arctic Circle in northern Sweden. The mine is Europe‘s largest copper mine. According to (Net Resources International, 2011), in 2010 after a four-year expansion construction period, Boliden is producing at 33Mt annual capacity, which will rise to 36Mt in 2014. The mill tailings are pumped to the tailings pond, situated in a shallow valley nearby. The tailings pond occupies an area of 13 square km and is limited by the topography and four dams (A-B, C-D, E-F incl. the E-F extension, and G-H), see figure 2. The thickness of the tailings deposit at present is more than 50 meters. The tailings are limited by downstream dyke, at which a small pond of water is maintained to secure settling of the fines. Downstream of the tailings is a separate settling pond with an area of 4 square kilometers, built to ensure an efficient sedimentation of ultra fine particles. The active water volume in the tailings pond is in the normal case about 2,000,000 m3, which occupies about 1/5 of the pond’s area. (Annika Benckert and Jan Eurenius, 2000)
Moreover, the amount of tailings disposal is expected to be enhanced by a large amount after the completion of Atik36 extension project and corresponding start of production with its full
12
capacity. The annual ore production will be enhanced to 36Mt. The deposit could be described as comparatively flat with a very small gradient.
13
1.3 Geology and reserves
The ore body of Aitik mine is hosted by a basin of volcanic rocks surrounded by granitic
intrusions within a supracrustal metamorphosed shear zone of Precambrian age. Biotite schists in the volcanic sequence contain disseminated Chalcopyritic mineralization averaging less than 0.40% copper, as well as gold and silver values. (Net Resources International, 2011)
According to Monro 1988, as cited in (Sammelin, 2011), the bedrock surrounding Aitik consists of Paleoproterozoic (~1.9–1.8 Ga/Giga Annum), amphibolite facies gneisses and schists (originally intermediate volcanic rocks and clastic sedimentary rocks), and granitic, gabbroic and dioritic intrusions.12, 14 The deposit is situated 5 km from a structurally important NW–SE striking shear zone (Figure 3), this is spatially associated with numerous small Cu–Au mineralisations. Host rocks to the Aitik Deposit are calc–alkaline in composition and probably originally formed as a volcano-sedimentary sequence in a 1.9 Ga volcanic arc at the south-western margin of the Archaean craton.
14
1.4 Mining and production at Aitik
Aitik is a single open pit divided into a southern section, where mining reached a final depth of 250m, and a northern area where mining is proceeding towards an ultimate 400m. The new mills have with a grinding capacity of 2,200ton per hour. They are fed with run of mill sized minus 400mm that are delivered from a stockpile with a capacity to store 200,000t. The ore is transported via a 7km-long conveyor system. About 3.5km of the conveyor runs underground from the old in-pit crusher and a new semi-mobile in-pit crusher installed at a depth of 285m within the mine. Pressure filtered concentrate is transported in purpose-designed containers to Boliden's smelter at Skelleftehamn on the Baltic coast, 400km from the mine site. (Net Resources International, 2011)
1.5 Tailing Dam at Aitik
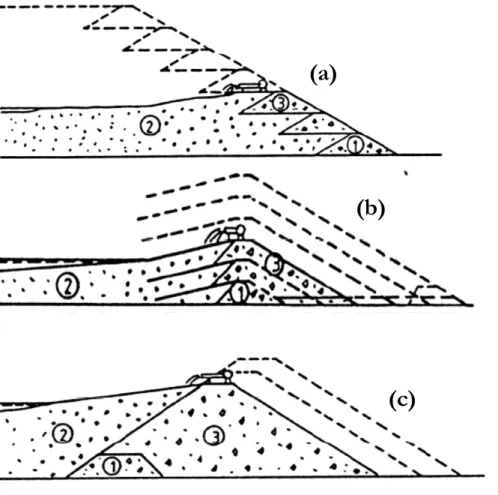
Tailings dams are considerably different from water retention dams in both construction material and structure. Tailings materials are often used as construction material in the dam body. The main difference of tailings dam from water retention dams is they are raised in stages or continuously along with mining production. Basically, there are three different types of tailings dam design. Upstream, centerline, and downstream methods are mostly common, (Figure 4). These dams are expected to stay for long time as the tailings are environmentally hazardous and should be kept away from human contact. Long term stability is the stability of a tailings dam for 1000 years, or more, without requirements for supervision and/or maintenance. Present long term design for tailings dams in Sweden is based upon the knowledge we have today about natural analogies, i.e. about natural moraine formations from the last glacial period. (Bjelkevik, 2005)
15
Figure 4: The three main methods for tailings dam construction, upstream (a), centre line (b) and downstream (c) construction.
Tailing dam at Aitik is of upstream type but with some modifications. This type of dam has many advantages over the other two types. Embankment fill could be constructed from natural soils, sand tailings or mine waste. Due to this reason, the cost of upstream design is much lower than downstream and centerline methods. The major setbacks of the upstream method of tailing dam construction would be its lowest resistance to seismic activities and decrement of volumetric tailings holding capacity with time.
Dam failure incident was recorded during the year 2000 at E-F dam. According to the consultant engaged by Boliden after the incident, the dam failure was caused either by high pore pressure within the support fill or by leakage into the discharge culvert. Boliden´s interpretation is that leakage into the culvert is the most likely cause of the dam failure. That leakage resulted in the establishment of a sink hole followed by erosion of the dam and finally transportation of water
(a)
(b)
16
from the tailings pond to the clarification pond. (Dam failure at the Aitik mine: Investigations, Conclusion and Measures taken, 2000)
2 Aims and Methodology of the study
2.1 Aims
This research is aiming at defining the hydraulic conductivity of the tailings deposit comparatively with a good reliability. Along with the determination of hydraulic conductivity, it covers a number of geotechnical properties of the deposit material. These geotechnical properties are highly related to the hydrologic behavior of the tailings.
By doing this investigation on a large portion of the deposit, it anticipates or provides the general trend of different parameters using empirical relations as well as graphical representations. Aims of the study could also be listed as the following:
Determination of horizontal and vertical hydraulic conductivity of the tailings using direct laboratory measurement.
Comparison of the measured values of hydraulic conductivity with predicted ones using existing empirical relations.
Identify the distribution of hydro-geotechnical properties throughout the investigated area of the deposit.
Identify and present substantial relationships between the measured parameters and the existing hydraulic conductivity predicting relations.
2.2 Methodology
Both field and laboratory investigations of the tailings deposit are carried out, (Section 4). Several data has been collected during these investigations. Based on the results of these investigations and analytical knowledge of both hydrogeology and geotechnical engineering, this study will come up with defined results and intellectual suggestions.
17
2.2.1 Field study comprises the following activities:
Making trial pits at different distances along selected three cross sections. Number and length of sections are controlled by accessibility of the digging machine and the representativeness of the section itself. Depths of test pit are affected by the presence of ground water and ice lenses. A maximum of 5m depth trial pit has been dug out. Detailed information will be provided in the later section.
Logging of different soil layers according to their type and degree of compaction. This has to be carried out by measuring the thicknesses of every soil layers and giving detailed field descriptions.
Records of field observations which might affect the general hydro geotechnical properties of the deposit.
Determination of in place density using balloon density method. This test was conducted at an average interval of 0.5m vertically. The field density has numerous uses in determining the existing porosity and how stiff the deposit is.
2.2.2 Laboratory tests
It is always important to follow certain test standards and procedures; therefore American Society for Testing and Materials (ASTM) standard was preferred to be used as the main basis and reference for this specific laboratory investigation. Although some modifications in the procedures are made, it has been seen that no test result is affected. Below are tests that are conducted in order to determine the parameter that helps to understand the hydrological setup of the deposit.
Constant head permeability test is one of the major tests used in laboratory investigation of the tailings material. This test is mainly targeted in determining the hydraulic conductivity of the deposit in its different parts. It is carried out on 43 undisturbed soil samples taken in both vertical and horizontal directions. Permeability test has also been done on three disturbed samples after remolding it up to its field dry density. (Section 4.2.5)
Particle size distribution test has been carried out on 35 samples which are taken from different depths in the three sections.
18
Wet sieving using standard mesh sizes starting from 0.063mm to 2mm diameter have been used for part of samples coarser than silt size.
Hydrometer and pipette analysis had to be used for the fine fraction depending on the amount of soil passing sieve size of 0.063mm. For those samples with less than 50 gram of this size, pipette analysis has been used, while hydrometer analysis was conducted on the samples having more than or equal to 50g of silty and clay particles.
Modified proctor compaction test was supposed to be done for at least every 1.5-2m interval. This test helps to check the degree of compaction of the hydraulically deposited tailings by comparing maximum laboratory density
Moisture content of the soil collected from balloon density test has to be determined shortly after the test.
Pycnometer test has been used to get the exact density of soil particles. This is very crucial for several phase relationship calculations such as porosity and void ratio that intern affect the ease of water flow through pores.(permeability)
19
3 Literature review
This particular thesis research has theoretical support from a number of previous studies in similar topic. Among these previous works, some of the main literatures are reviewed below. These literatures are written based on different experiments on tailings material in many different places. Alike this thesis, their main concern is hydro geotechnical, geotechnical, physical and hydro geological characteristics of tailings material for specific tailing deposits or mine waste materials in general. Finally, few works will be reviewed on determination of hydraulic conductivity of soils based on their grain size analysis.
3.1 Hydrological and geotechnical properties of tailings material
3.1.1 Geoffrey Blight (2010)
He has covered many aspects of geotechnical investigations and a characteristic of mine waste storage facilities in general and tailings impoundment in particular. Mainly, he dealt with particle size analysis, permeability of the whole material and of its coarse and fine fractions, shears strength characteristics of the waste, in situ void ratio or density and particle relative density. He summarized the particle size analyses for a number of tailings from the extraction of various mineral products. The actual particle size distribution for tailings depend on factors such as the fineness to which the ore is milled, the mineralogy and degree of weathering of the ore, the type of milling process, the separation or extraction process, etc. Grading may be very variable both at a single mine and from mine to mine, as well as being variable on a single tailings storage (Blight, 2010)
The need of determination of both vertical and horizontal hydraulic conductivities is due to their high difference between them. This difference is common as a result of hydraulic deposition. During deposition there is high potential of formation of layers or stratifications as well as grading down the length of the hydraulic beach. Ultimately, this difference in permeability will influence not only the shape of the seepage or phreatic surface at the perimeter of the waste storage, but also possible seepage losses through the floor (or footprint) of the storage.
20
Blight stated that, in situ void ratio or density of tailings materials usually shows loose state as a result of mode of deposition is hydraulic. A loose structure combined with a high state of saturation may render the material liable to static or dynamic liquefaction.
He also mentioned that, particle relative density G has an influence on the density or unit weight of the waste and hence on volume/mass calculations. For many wastes the particle relative density has values in the range 2.65 to 2.75. Depending on mineralogy (e.g. for plat inum tailings), the particle relative density may be as high as 3.5 to 4.
3.1.2 Jantzer et al (2008)
They presented the general material properties of tailings from Swedish mines. Properties which were emphasized in their paper are shear strength and hydraulic conductivity. According to this paper, tailings are particles of crushed rock with particle sizes ranging from clay to sand. This paper stats that grain size of tailings material varies from 0.01 mm to 1.0 mm, but up to 20 % clay-sized particles, i.e. 0.002 mm, can be found. Such variations occurs dependent on sedimentation, site and processing methods. Like Blight, Jantzer et al said that characteristics of tailings material could be dependent on origin and processing of the ore, as well as deposition methods. The origin affects the size and the gradation of the grains, the internal friction angle and the particle density; whereas the deposition method is responsible for bulk density, void ratio and porosity, and the hydraulic conductivity. Tailings generally have high water content and porosity, a low to moderate hydraulic conductivity and a low plasticity when compared to natural geological materials. (I. Jantzer, A. Bjelkevik, K. Pousette, 2008)
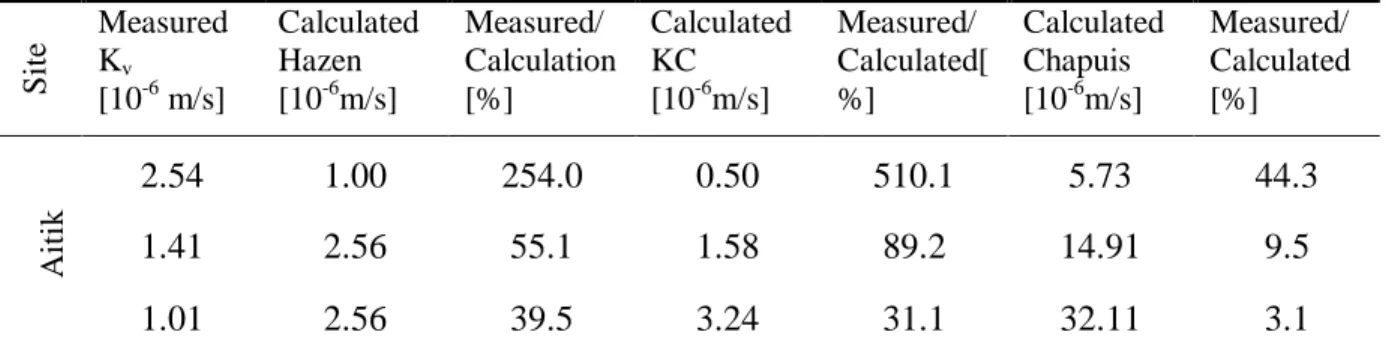
Based on this paper, tailings generally have a relatively low uniformity coefficient Cu between 3 and 8. The value is not constant, as it varies with the distance to the discharge point because of the sorting effect of sedimentation. Results from study on tailings of Aitik mine are included. These are measured and calculated hydraulic conductivity results and their comparison. (Table1)
21
Table 1: Measured and predicted hydraulic conductivity at Aitik according to (I. Jantzer, et al, 2008)
S it e MeasuredK v [10-6 m/s] Calculated Hazen [10-6m/s] Measured/ Calculation [%] Calculated KC [10-6m/s] Measured/ Calculated[ %] Calculated Chapuis [10-6m/s] Measured/ Calculated [%] A it ik 2.54 1.00 254.0 0.50 510.1 5.73 44.3 1.41 2.56 55.1 1.58 89.2 14.91 9.5 1.01 2.56 39.5 3.24 31.1 32.11 3.1
The report concluded that measurement and calculation of the hydraulic conductivity of tailings appears to be difficult as the study shows that obtained values have a large variation and that increased void ratio does not always correspond to increased hydraulic conductivity.
3.1.3 A. Shamsai et al (2007)
A research by A. Shamsai et al (2007) covered the geotechnical characteristics of tailings specifically for copper. They took one mine as a case study. In this research, many of the geotechnical and hydro geological parameters were determined. Comparison between grain size distribution curve of Iran- whole tailings and other tailings from different mines are shown in figure 5. Mines that are included in this chart include Michigan-whole tailings and Philippines-whole tailings. Based on grind milling size of the extracted minerals, generally, the tailings are relatively coarse, with about only 45% finer than 0.075mm on average.
Figure 5: Comparison of grain size distribution of different copper mine tailings (Abolfazl Shamsai Ali Pak, S. Mohyeddin Bateni, S. Amir Hossein Ayatollahi, 2007)
22
Measurements showed that the tailings of Sarcheshmeh mine appear to have heavier grains with specific gravity value of 2.79. According to this study, the in-place void ratio ranges from 0.4 to 1.0. Average dry density of the deposit is 1.78 g/m3.
One of the interesting concepts stated in this paper is the empirical relation between portion of tailing material finer than 0.075mm and void ratio and in turn hydraulic conductivity.
Percentage of soil finer than 0.075mm, which is denoted as P200, is used to distinguish the characteristics of the soil in terms of its hydrologic behavior, (Shamsai et al 2007). Therefore, nine samples from tailings were chosen. After carrying out 9 tests for P200 = 55, 60, 65, 70, 75, 80, 85, 90, and 95% (Figure 6), values of hydraulic conductivity for different void ratios were determined indirectly through consolidation odometer test results. The relation between hydraulic conductivity and the void ratio was presented as follows:
Figure 6: Experimental test data on hydraulic conductivity of tailings (Abolfazl Shamsai et al. (2007)
A mathematical relation has also been determined by Abolfazl et al. (2007) by fitting the curves above with R2 value of 0.984. This relation is shown as:
23
...Equation (1)
Where: K = Hydraulic conductivity, in cm/sec, and e = Void ratio
Despite the simplicity of this equation, it has a limitation on P200 to be over 50%. However, it gives values of hydraulic conductivity for a wide range of void ratios between 0.3 and 1.1. (Abolfazl et al 2007)
3.1.4 R. Rodriguez (2006)
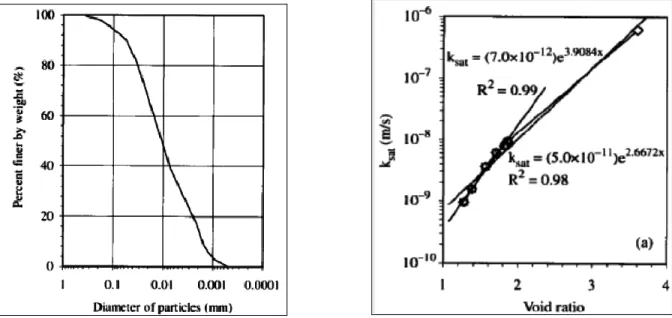
R. Rodriguez in 2006 presented hydro-geotechnical characterization of a metallurgical waste. This study has given emphasis to chemical and mineralogical analysis, odometer test, tensile strength tests, determination of water retention curve, and shrinkage and permeability tests. Review of this study will be more of on the test results of saturated hydraulic conductivity and grain size distribution of tailings material from Ammoniac ammonium carbonate leaching (ACL) metallurgical waste (MW) in Moa mining district, Cuba.
Here, it is stated that, 99 percent of the residue has a grain size finer than 0.2mm, with a mean grain size of 20μm.(Figure7) The material has an in situ density of about 2.30g/cm3, a particle density between 3.80 and 4.04, and a void ratio between 1.3 and 2.2.
Figure 7: Grain- size distribution of ACL MW obtained by laser technique (left), and relation between saturated hydraulic conductivity and void ratio (right) (After Rodriguez, 2006)
24
It is also tried to show the relationship between saturate hydraulic conductivity and waste void ratio as in the figure 7.
Based on the experiments, the tailings have a grain size distribution similar to that of silty soil. The relation between hydraulic conductivity and void ratio could generally be represented as: (Rodriguez, 2006)
Where: is saturated hydraulic conductivity (m/sec), e is void ratio and y is constant
Hydraulic conductivity has important dependence on degree of saturation and varies significantly during drying process. (Rodriguez, 2006)
3.1.5 Yunxin et al. (2001)
They have shown many important and basic characteristics of tailings by taking four mines as an example. These properties comprise the specific gravity, grain size distribution, porosity. Large-strain consolidation tests and hydraulic conductivity tests are also covered in this paper for all of the four mines and tried to compare the results with those of similar mines.
It is important to put some of the major results and drawn conclusions made by Yunxin et al. (2001).
Table 2: Basic properties of copper mine tailings: (after Yunxin et al. 2001)
Copper tailings
Specific gravity, Gs 2.75
Shrinkage limits (%) 24.4
Clay size particles (<2μm; %) 1.3 Sand Content (<2mm; %) 74.5 Fines content (<74μm; %) 31.3
D10 (μm) 16.28
D30 (μm) 72.25
25
Figure 8: Grain-size distribution of copper tailings, (after Yunxin et al, 2001)
Based on the grain size distribution curves above, the tailings of copper mine is dominated by sand size followed by silt.
Yunxin et al. (2001) stated that based on their grain-size distributions and basic physical properties, the tailings are non plastic. The specific gravity of the copper tailings was also within the range presented by Blight (2010).
Constant head permeability tests were conducted on copper tailings material in saturated condition. Water from the constant-head reservoir flowed upward through the samples under a low constant and gradient. The results are found to be in the range of 4.5×10⁻⁸ to 9.8×10⁻⁷m/sec.
These values are 300 to 600 times less than the results of hydraulic conductivity mentioned by Jantzer et al, 2008 from tailings of Aitik Mine.
Finally, Yunxin et al, 2001 concluded that the relationships between the void ratio and the logarithm of saturated hydraulic conductivity of the tailings are almost linear.
0 10 20 30 40 50 60 70 80 90 100 0,0001 0,001 0,01 0,1 1 10 perc ent pa si ng , % Particle diameter, mm
26
3.2 Determination of hydraulic conductivity from grain size distribution
Prediction of hydraulic conductivity for tailings from grain-size distribution might not be as successful as prediction on natural soils. This is because tailings are prone to several phenomena such as creation of new fines during compaction (if the test is done on disturbed soil sample) and chemical reaction during permeability testing. Moreover, shapes of tailings and natural soils area quite different while having equivalent diameters. Consequently, the predicted hydraulic conductivity must take these phenomenons into account.
A number of researches dealt with modeling and empirical formulation for hydraulic conductivity from grain size distributions.
Hazen in 1893 proposed a formula which is oldest and originally developed for determination of hydraulic conductivity of uniformly graded sand but is also useful for fine sand to gravel range, provided the sediment has a uniformity coefficient less than 5 and effective grain size between 0.1 and 3mm. (Odong, 2007)
...Equation (2)
Where:
Hydraulic conductivity, (m/sec) Acceleration due to gravity, (m/sec2
) = Kinematic coefficient of viscosity, (m2
/s) = Porosity
= Effective diameter or grain size at which 10% of the grains are finer, (m)
Similarly, Hazen in 1911 developed the following empirical formula for predicting the permeability or hydraulic conductivity of saturated sands: (W. David Carrier, 2003) Where: is Hazen empirical coefficient which is usually equal to 100 for medium and well sorted sand.
27
3.2.1 Chapuis et al. (2003)
Chapuis et al. (2003) have done extensive evaluation of Kozeny- Carman equation and claimed that there is a large consensus in geotechnical literature about the effectiveness of KC (Kozeny- Carman) formula for prediction of saturated hydraulic conductivity from empirical relations on sands but not clays. (Robert P. Chapuis, Michel Aubertin, 2003). It is a mathematical relation used to predict k-value from grain-size distribution, and assumed the soil specimen to be homogenous. In the other hand, it is obvious that intact tailings are typically finely stratified (cm or mm scale) and have a high anisotropy in K. The formula below is proposed by Chapuis et al. which is modified form of Kozeny-Carman formula.
...Equation (3) (Modified after Chapuis et al. 2003)
Where; = hydraulic conductivity, m/sec Gs is specific weight = of solid.
S = specific surface, m2/kg
e = void ratio.
Specific surface could be estimated using simple geometric considerations for non-plastic soils like tailings. If d is the diameter of a sphere or the side of a cube, the specific surface S of a group of spheres or cubes is given by:
Where, = the density (kg/m3) of the spheres or cubes.
According to Chapuis and Legare (1992), the equivalent size is given by:
28
Figure 9: Relation between measured and predicted hydraulic conductivity (After Chapuis et al, 2003)
3.2.2 Fred Kofi Boadu (2000)
He presented new developments of regression-based models to predict saturated hydraulic conductivity of compacted soils from grain-size distribution. These models incorporate parameter values that adequately represent the distribution of grain sizes. Alternative representations of the grain-size distribution, the fractal dimension and entropy of the distributions, as well as porosity, soil density, and fines content are used in the models to estimate the hydraulic conductivity. For this particular thesis research, some of the parameters are missing to fulfill all the necessary parameters for this model. However, the model is presented here, because it is believed that this model incorporated many of the permeability controlling factors.
In this paper regression equations are developed to predict the hydraulic conductivity using the measured petro physical parameters of the soils as descriptor variables.
Based on the model, the resulting regression equation that best relates the hydraulic conductivity K to the five structural descriptors of the soil properties is given
29
This equation describes a model that predicts hydraulic conductivity of a soil, using information from the structural parameters characterizing the soil. The model is described by a functional relationship between and a set of five variables.
These are:- fractal dimension D, entropy S, fractional porosity , percent of fines P (%), and the bulk density (Mg/m3)] that describes the structural and compositional conditions of the soil obtained from the field. The model has given R2 value of 0.89, meaning roughly 90% of the variance in hydraulic conductivity is explained by the model.
Boadu finally concluded that, the two models, Kozeny-Carmen and Hazen, predict the hydraulic conductivity of soil samples reasonably only within a particular range of soil grain sizes. The existing models were developed based on representative grain sizes of soil samples. So, any attempt to use them without compensating for the distribution of the particle sizes will produce erroneous results. (Boadu, 2000)
30
4 Field and Laboratory investigation
Prior to analysis or modeling of any geotechnical site, it is very crucial to acquire detail outlook of the area to be studied. This important information could be obtained in two ways. These are field and laboratory investigations. In this particular case, extensive examination of tailings materials starting from visual observation through detailed laboratory investigations were employed. As the investigation was done on part of the whole area of the deposit, it is tried to make the investigation as good representative as possible.
4.1 Field Investigation
The field investigation took 15 days; it has been going through 6th of July to 21th of July 2012. It was executed mainly by two persons with the help of some people from SWECO AB, Lulea University of Technology and New Boliden36. It was categorized into three parts. These are describing and recording visual soil characteristics including logging, conducting in situ tests, and sampling.
Some equipment is used during this investigation. These are excavator for digging out trial pits, full set of balloon density measuring machine, and few sampling materials such as buckets, plastic bags and shovels. The heavy duty excavation machine was making the trial pits having benched walls with bench height and width of approximately 1m. (Figure 10)
Figure 10: Bench shaped wall of trial pits (Left) and excavator used to burrow the trial pits (Right)
31
4.1.1 Sampling and soil profile logging
Soil samples are taken from different locations in order to make reasonable representation of the tailing deposit. All efforts and cares have been taken to visualize the soils types and their distribution in the deposit. Proper handling of samples is also very essential to avoid alteration in behavior of the soil.
Three sections (A, B, and C) (Figure11) were selected based on the geometry of the deposit area and the expected type of soil and their distribution. These sections are described in the later part of this report. Along these sections trial pits have been excavated with a depth varying from 3 to 5metres. Activities such as visual field logging, sampling and conducting in place density have also been carried out on most of the pits. Density determination has been performed using Balloon density test method.
Figure 11: Selected sections of investigation
A B C
32
Sampling has also been done for further laboratory investigations. Disturbed samples are intended to be used for tests such as particle size distribution, specific gravity determination, and proctor compaction. These samples are approximately 15kg each. Moreover, undisturbed soil samples were taken by 11cm diameter PVC pipe having a length of 50cm. This was done in both vertical and horizontal directions for getting the hydraulic conductivity of the deposit in the specified directions. Undisturbed samples were properly handled in order to avoid secondary disturbance during to transportation. The natural water content was kept as constant as possible by covering the two ends of the sampling tube with plastic and reasonably fitting caps, (Figure 12).
Figure 12: Undisturbed samples taken for hydraulic conductivity test
4.1.2 Balloon density test set
Plenty of samples were taken along with a number of in situ density tests. These samples are taken just after the field density test. These tests were conducted at a point where soil variation is experienced and with a vertical interval of 0.5-1m. Samples were also taken only for water content determination at depths where balloon density test was inconvenient to conduct due to soil behavior and ground water condition. 61 samples were collected during balloon density test and sampling for water content determination. Total number of Balloon density tests that are carried out during the field investigation is 51.
33 Table 3: Balloon Density test locations
Test pit Name Number of tests Depths, m
A1 7 0, 0.6, 1, 1.5, 2 ,2.5, and 3.4 A2 7 0, 1, 2, 2.5, 3.5, 4, and 4.5 A3 - A4 6 0, 0.6, 1, 1.5, 2,and 2.5 A5 - B1 3 0, 0.6, and 1 B2 4 0, 1, 2, and 2.5 B3 5 0, 1, 1.7, 2.5, and 3.3 B4 5 0, 1, 2.4, 3.2, and3.8 B5 6 0, 0.7, 1.5, 2.5, 3.1, and 4 C1 4 0, 0.7, 1, and 2.3 C2 4 0, 0.65, 1.5, and 2.5 C3 4 0.1, 0.65, 1.2, and 1.8
ASTM D 2167 standard was used to conduct this test. The following procedure was properly followed.
1) Position the density plate on a flat surface and set the volume measuring apparatus in the recessed hole in the density plate.
2) Hold the apparatus down firmly in position, open the control valve, pump the balloon down with the rubber bulb until the water level in the graduated cylinder has reached its lowest position, and record this volume which is the initial reading.
3) Pump the balloon back into the cylinder by inverting the rubber bulb, and close the control valve. 4) Place the density plate in a level position on the material to be tested, dig a test hole about
4 in. in diameter and 4 in. deep retain all the material which is removed from the hole, then measure and record the mass of the excavated soil.
5) Set the apparatus in the recess in the density plate, hold it down firmly, open the control valve, pump the balloon into the hole, and record the lowest point reached by the water in cylinder which is the final reading.
34
6) Invert the pressure-vacuum bulb and pump the balloon back into the cylinder.
7) Subtract the initial reading from the final reading and obtain the volume of the hole in cubic feet. 8) Mix the material thoroughly and secure a representative sample of not less than 100 gm for moisture determination.
9) Make density calculations based on volume of the test hole and dry or wet weight (as required) of materials removed.
Figure 13: Balloon density test set (a), and oven dried samples for moisture content determination (b).
Water content determination has been carried out on the soil samples acquired from holes dugout for balloon density test. Normal heating oven with a maximum temperature 105oC has been used to dry out the sample for 24 hrs. Weighing Balance with measuring accuracy of 0.01g was also been used.
4.2 Laboratory investigation
The tailings samples that are collected during the field investigation were shipped off-site to the geotechnical laboratory of Lulea University of Technology for physical index and permeability tests. On average around 39 samples were tested for grain size distribution, proctor compaction, Pycnometer test, and constant head permeability test. Standard test procedures were followed, although, sometimes with a little modification in order to make the test as per the actual situations. For instance, Particle size determination was done using smaller pycnometers than the standard size with a capacity of 110ml on average. All of the tests were carried out in
35
geotechnical laboratory of Lulea University of Technology except water content determination which is conducted in Aitik geotechnical laboratory. Detailed test results with their raw data are presented in appendixes.
4.2.1 Proctor compaction
Modified proctor compaction was conducted on 31 samples taken from the three sections. Individually, 10, 15 and 6 samples were engaged in this test from section A, Section B and Section C respectively. It was conducted according to ASTM standard for laboratory compaction characteristics of soil using modified effort (2,700KN/m3). (ASTM, 1998).
The use of proctor compaction test in this study was to characterize the deposited material in terms of its potential to be compacted seeing that, it could also be part of construction material in the tailing dam. As far as stability of tailing dam is concerned, it is always important to determine the possible maximum dry density and optimum water content that would be used for a better stability condition. On the other hand, it could be used to check how much the tailings material in the deposit is compacted naturally during deposition. This is usually done by calculating the percentage of compaction through comparison of field density with the maximum dry density determined in laboratory from proctor test.
4.2.2 Particle density/Specific Gravity
Particle relative density, in general, is the ratio of the weight in air of a given volume of material at a stated temperature to the weight of the same volume of water (or other reference) at a stated temperature.
The particle relative density, Gs, has an influence on the density or unit weight of the waste and hence the volume-mass calculations. For many geological and waste materials, the particle relative density has values in range 2.65 to 2.75 (Blight, 2010). Depending on the mineralogy (e.g. for Platinum, Iron, lead...etc tailings), the particle density may be as high as 3.5 to 4. Particles relative density of less than 2.5 may be found for certain wastes, e.g. coal wastes have a particle relative density of about 2.
Pycnometer test is very important as it is the most popular methods of determining specific gravity or particle density of soils. The test in this study was carried out based on ASTM D
854-36
98. Some modifications have been made on the volume and shape of the pycnometers without affecting the overall result. The volume of pycnometer used was about 110ml on average. Flat pieces of glasses were used to cover the pycnometers as we need to make sure that no air bubble were left during weight determination of pycnometer with full of water.(Figure 14)
Calculation has been using the equation below.
...Equation (5)
Where:
= weight of the empty clean and dry Pycnometer, = weight of the pycnometer containing the dry soil, = weight of the Pycnometer with Soil and water, = weight of the Pycnometer filled with distilled water.
Figure 14: Pycnometers used for particle density determination.
After having particle density, calculation of physical parameters such as porosity and void ratio is followed. These parameters, porosity and void ratio are very important in controlling the flow of water through the soil. Additionally, pycnometer test results are vital input to be considered or serve as basis in sedimentation analysis as we will experience in later sections.
The tested samples are collected from holes made for field density determination. Totally, 39 soil samples are tested for particle density determination. The tests were conducted carefully on
37
double samples from all 39 locations. This was to reduce the effect of human and instrumental errors.
4.2.3 Porosity and void ratio
Porosity for the samples has been determined by empirical calculation using the dry density from the field and particle density from pycnometer test. It could be expressed as below
...Equation (6)
4.2.4 Particle size analysis
The particle size distribution of the tailings material is primarily used for classification purposes. The distribution of particle sizes larger than 0.063 mm is determined by wet sieving, while distribution of particles sizes smaller than 0.063 mm is determined by sedimentation process using a hydrometer or pipette analysis.
4.2.4.1 Wet Sieving
The sieve analysis determines the grain size distribution curve of soil samples by passing them through a stack of sieves of decreasing mesh opening sizes and by obtaining the weight retained on each sieve.
Totally, sieving was carried out on 39 samples which are obtained from different locations of the deposit. Among these samples 18 of them are taken from section-A, 13 from section-B and 8 samples from section C.
As is mentioned before, the sieve analysis is generally applied to the soil fraction larger than 63 μm. Based on the available mass of fines, grains smaller than 63 μm in the samples, either hydrometer or pipette analysis has been adopted.
Sieving can be performed in either wet or dry conditions. Dry sieving is used only for soils with a negligible amount of plastic fines, such as gravels and clean sands, whereas wet sieving is applied to soils with plastic fines. (Bardet, 1997). Although the tailings material is with almost no plastic nature, wet sieving was used. This was because of its higher water content and
38
particles were stuck together due to the flat shape of the grains that comes from the micaceous minerals and milling effect.
Sieve sizes used are 2mm, 1.5mm, 1mm, 0.5mm, 0.25mm, and 0.063mm. The tests were conducted on small representative samples with a mass of 300 to 400 gm.
Table 4: Samples taken for sieving from each section
Section-A Section-B Section-C
A1 A2 A3 A4 A5 B1 B2 B3 B4 B5 C1 C2 C3
A1-1 A2-1 A3-1 A4-1 A5-1 B1-2 B2-2 B3-1 B4-1 B5-2 C1-1 C2-2 C3-2
A1-3 A2-3 A3-3 A4-3 A5-2 B2-3 B3-3 B4-3 B5-4 C1-2 C2-4 C3-3
A1-5 A2-5 A3-4 A4-4 B2-4 B3-5 B4-5 B5-6 C1-3 C3-4
A1-6 A2-6 A4-5
A1-7
Figure 15: Electrical sieve shaker used
4.2.4.2 Sedimentation
The theory of sedimentation is based on the fact that large particles suspended in a liquid settle more quickly than small particles, assuming that all particles have similar densities and shapes. By assuming that, particles are approximately spherical, the relation between the velocity and particle diameter is given by Stokes’ law, which is stated as:
Pan 0.063mm 0.250mm 0.50mm 1.0 mm 2.0 mm
39
Although particles in tailings deposit are far from spherical, the application of Stokes’ law based on diameters of equivalent spheres provides a basis for comparison of the particle size distribution in tailings that is sufficiently realistic for most practical purposes like this study. A total of 39 samples like the sieving were gone through sedimentation test. Both hydrometer and pipette analysis were employed based on the mass of the soil passing sieve size 0.063mm. For those samples that have more than 50 grams of fine particles (finer than 0.063mm), Hydrometer analysis was employed. On the other hand, when the sampled soil is with lower fines than 50gm, pipette analysis was preferred as it could be done on relatively small sample.
Hydrometer analysis
Sedimentation analysis (hydrometer, pipette, and buoyancy analysis) defines the grain size distribution curve of soils that are too fine to be tested by sieving. Sedimentation analysis sorts soil particles by size using the physical process of sedimentation, a process that is described by Stokes' law (Stokes, 1891). The grain size is calculated from the distance of sedimentation of soil particles. The percent by weight finer is determined by measuring the unit weight of the soil-fluid suspension.
This method further separates fine soil particles so that a complete grain size distribution curve can be produced by the end of this experiment. From this curve, many important aspects of the soil can be determined and a general classification of the soil can be made.
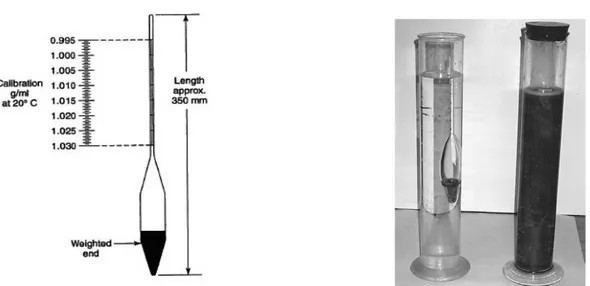
This test was conducted according to ASTM Designation: D 422 – 63, that deals about standard test methods for particles- size analysis of soils. The hydrometer used was of type 151H. (Figure 16)
All the appropriate corrections such as dispersion agent correction, hydrometer reading correction, temperature correction, and hygroscopic correction have been done.
Diameter of soil particles was calculated according to stoker’s law as follows: (ASTM, Standard Test Method for Particle-Size Analysis of Soils, 1998)
...Equation (7)
Where: = Viscosity of water at 200
40
= Depth at which the density of suspension is being measured, effective depth which is based on hydrometer. In this case for hydrometer 151H.
= Interval of time from beginning of sedimentation to the taking of the reading, min, = Specific gravity of soil particles, and
= Specific gravity (relative density) of suspending medium
Ultimately, percentage of soil remaining in suspension at the level at which the hydrometer measuring the density of suspension was calculated as:
...Equation (8)
Where:
= Percentage of soil remaining in suspension at the level at which hydrometer is measuring (%)
= Corrected hydrometer reading
Figure 16: Hydrometer used type 151H (Left) and hydrometer testing on tailings (Right)
Hydrometer analysis was accomplished on 15 soil samples which are taken from section-A and Section-B. Among the fifteen samples, ten of them are from section-A, and the remaining five were from section-B. No samples were found to be enough for hydrometer test from section-C. This might give an implication of soil from section-C is coarser than soils in section-A and section-B.
41 Pipette Analysis
This is for the determination of the sub sieve particle distribution in a soil sample by mechanical analysis. An analysis of this kind expresses quantity the proportions by weight of various sizes of particles present in the soil. Similar to hydrometer test, it is recommended as a standard procedure to use dispersion agent to avoid flocculation.
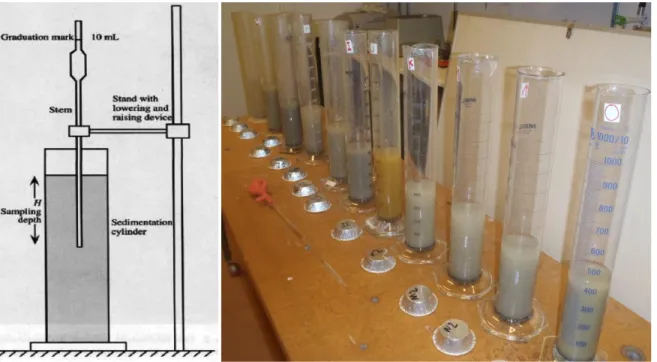
The apparatus used consists of regular sampling pipette, capable of measuring 10 ± 0.2 mL of liquid, with a lowering and raising support. (Figure17), Dispersion apparatus (1000ml), 500 ml of stock solution of sodium hexa-metaphosphate prepared as in the hydrometer test, many sedimentation cylinders, thermometer, ranging from 0 to 50°C, accurate to 0.5°C, stopwatch, and balance which is accurate to 0.001 g.
It is observed that, this method is much faster than hydrometer and gives opportunity to work on a smaller amount of samples than hydrometer.
Figure 17: Schematic diagram showing regular pipette test set used; After (Bardet, 1997)
Pipette analyses were used for most of the tailings material collected. This was due to the availability of fine fraction in the samples. In other words, more than 60 % of the collected samples (25 in number) had not enough amount of fine fraction for hydrometer analysis (which
42
should be a minimum of 50gm). Procedure and analysis of this test were adopted from (Bardet, 1997), which is based on British Standard.
The grain sizes were calculated as: ...Equation (9)
Where: t = is the time (min) after the beginning of sedimentation, = Specific gravity of the soil particles,
= Unit mass of the water (g/cm3) at temperature T, = Viscosity of the water in (g/cm .s) at temperature T, = Sampling depth (cm).
There are two methods of pipette analysis, dry and wet. For this particular study the dry pipette method has been used at which the percentage, by weight of particles with diameter smaller than D is;
...Equation (10)
Where:
= total mass of oven dried soil in suspension (g), = Mass of empty weighing dish (g)
= Mass of weighing dish and sample of oven dried soil (g) = Total volume of suspension (ml)
= Volume of pipette (ml)
= Mass of the dispersing agent in volume V (g).
During the test, it is observed that Pipette analysis has several advantages over hydrometer analysis which is also supported by (Bardet, 1997). It takes less time because the sampling depth is adjustable, whereas it is fixed in hydrometer analysis. The calculations are also simpler and there is no need to account for the correction of meniscus or hydrometer dilation. However, compared to hydrometer analysis, pipette analysis is less adapted to the conditions encountered in a field laboratory. It requires accurate weight measurement.
43
4.2.5 Permeability test
Tailings are permeable to water because the voids between the particles are interconnected. The degree of permeability is characterized by the permeability coefficient, K, also referred to as hydraulic conductivity.
One of the main aims of this study is to determine the permeability of the tailing deposit in horizontal and vertical directions and relate these characteristics to different physical and geotechnical parameters. For this purpose, it has been collected several undisturbed soil samples from different locations in both vertical and horizontal directions. Totally, it was possible to take 44 samples by using a sharp edged PVC tube having a diameter of 11cm. This much large diameter was used because, another small diameter sample was planned to be taken out of it. Moreover, lesser disturbance was assumed to be involved during transportation. These samples were stored in a cool room with a temperature of 5oC in order to keep its natural moisture content and intern maintain the permeability of the soil as it was in the actual ground.
Another cautious sampling with small cylinders on which the permeability tests were conducted was also performed from the bigger diameter samples. The technique of this sampling was designed and implemented with a great care. The load that is used to take samples out of the large diameter samples is static with a very slow rate of application. Prior to sampling, the internal walls of small plastic cylinders were waxed by petroleum jelly for friction reduction. Most of the samples tested have a length of around 10cm. Proper inlet and outlet caps have been used in order to avoid leakage during the test. Synthetic filters have also been put in both ends as it helps to protect fine particles from washing out
Constant head permeability test based on standard procedures has been employed. It is a standard test method for measurement of hydraulic conductivity of saturated porous materials using tube permeameter. ( David E. Daniel and Stephen J. Trautwein, 1994) The tubes are special made for this purpose, (Figure 18). Because the diameter of these cylinders is uniform throughout its length, no shearing or remolding effect was faced during taking the smaller sample from the bigger one. Due to this and the properties of the tailings material, the permeability values are expected to be free from risk of side wall seepage.
44
For almost all of the tests, the hydraulic gradient was 7. This gradient was selected based on the expected hydraulic conductivity value and gradient in the field.
Figure 18: Equipments used for permeability test, cylinder (1), inlet cap (2) and out let (3) caps, filter (4) and schematic diagram of constant head permeability test (Right)
According to (ASTM, 1997)calculation of the hydraulic conductivity, k, is as follows:
...Equation (11)
Where: = hydraulic conductivity, m/s,
= quantity of flow, taken as the average of inflow and outflow, m3, = length of specimen along path of flow, m,
= cross-sectional area of specimen, m2,
= interval of time, s, over which the flow Q occurs, and
= difference in hydraulic head across the specimen, m of water
Permeability test is one of the trickiest tests in soil mechanics. There are a number of factors that could influence the results of hydraulic conductivity. These effects are magnified when the test is