Colorado Alpine Dust Deposition and Associated Continental Winds
1 Morgan Phillips2Colorado Climate Center and Bureau of Land Management
Abstract. The winter and early spring of 2008-2009 brought an unusually high number of alpine
dust deposition events to the Rocky Mountains of Colorado. The greatest dust accumulations were observed in the San Juan Mountains of southwestern Colorado. Significant dust accumulation was even observed along the Continental Divide in northern Colorado. The primary source for this dust has previously been identified as the Colorado Plateau. Analysis using the HYSPLIT(Hybrid Single Particle Lagrangian Integrated Trajectory) atmospheric trajectory model along with satellite imagery showed that dust from the 2009 events also originated from the Colorado Plateau, especially from areas in and around northeastern Arizona that were experiencing drought conditions this spring.
This study utilized data from the USFS/BLM RAWS (Remote Automated Weather Station) network over the southwestern U.S. to identify periods of high winds corresponding to documented Colorado dust events. Wind speeds for the study region were evaluated for the period January through April for the past 20 years in an attempt to quantify and compare both mean wind speed and maximum wind gusts on a seasonal basis. A linear regression analysis showed a significant correlation between the Southern Oscillation Index (SOI) and the frequency of these types of high wind periods, particularly during winter months. The correlation between periods of high winds and the SOI extends through the 20 years of wind data available for these weather stations.
1. Introduction
During the late winter and early spring mid-latitude cyclones and their associated fronts moving through the southwestern United States often generate intense regional dust storms which then deposit large amounts of airborne sediment in alpine mountain areas (McBride, 2007). Aeolian sediment deposition on alpine snow packs in the western United States is becoming a subject of greater concern as a larger percentage of the population continues to depend on mountain snow as a source of municipal water supplies. The accumulation of dust on mountain snow packs has the potential to alter the snowmelt regime and thus the rate and timing of snowmelt discharge (Painter et al. 2007).
In addition to water management, these types of events have an immediate impact on regional air quality. The primary goal of this study was to investigate potential origins of dust found in the San Juan snow pack by using a combination of data analysis and atmospheric models, while at the same time attempting to quantify the frequency of high wind periods capable of generating dust storms. Previous studies have shown inter-annual variations of wind gust magnitude are related to the El Niño/Southern Oscillation cycle (Enloe, O’Brian and Smith, 2003). By looking at multiple years of wind data this study was designed to determine if atmospheric conditions were more favorable for synoptic scale dust storm formation during 2009 than in other years.
1 A joint research project through the Bureau of Land Management and the Colorado Climate Center
2Colorado Climate Center, Department of Atmospheric Science, 1371 Campus Delivery, Colorado State University, Fort Collins, CO
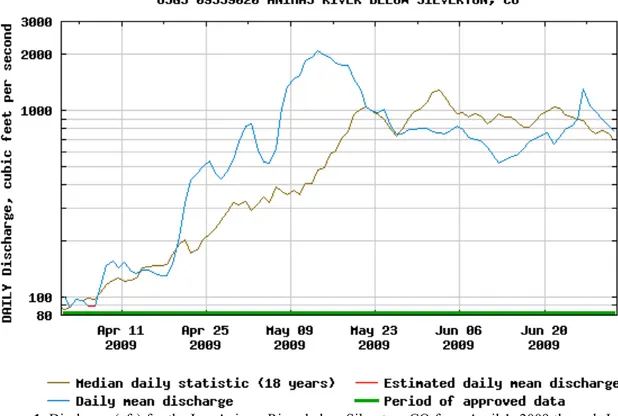
Figure 1. Discharge (cfs) for the Las Animas River below Silverton, CO from April 1, 2009 through July 1,
2009 compared to the 18 year historic average.
Isotopic analysis has shown that the dust accumulated on the San Juan snow pack during deposition events in 2004/2005 and 2005/2006 seasons originated from the basement rocks and their sedimentary derivatives in the area to the southwest of Colorado known as the Colorado Plateau (Painter et al. 2007). While it is likely that dust from many regions of the globe is transported to, and subsequently deposited in the San Juan Mountains (Jaffe, Snow and Cooper, 2003), dominant westerly flow over the region suggests that major dust sources in the upwind area would be the most likely to contribute to the majority of the aeolian sediment load.
2. Methodology
Individual RAWS Analysis
The project began with a simple visual analysis of wind data from individual RAWS locations in the western US. Stations with periods of sustained high winds (> 4 hours) best corresponding to multiple known dust deposition events (Table 1) over several years were then mapped using Geographic Information Systems (GIS) software. The resulting map indicates where conditions were most favorable for the generation of dust storms on a synoptic (non-convective) scale immediately surrounding a recorded deposition event in the San Juan Mountains.
Once several time series graphs had been identified as corresponding to dust deposition events it was possible to determine an average ‘threshold’ wind velocity above which dust storms were generated. This was done for both mean wind speed and maximum wind gusts, where the mean daily velocity threshold was found to be 15 mph and the threshold
indicator of high wind criteria for the frequency analysis. In addition to analyzing the spatial distribution of stations that corresponded well with dust events, the directional characteristics of the wind were analyzed when the velocity exceeded the threshold value to determine the dominant wind direction during potential dust generating episodes.
Table 1. Dust Deposition Events for Senator Beck Basin Study Area in the San Juan Mountains from winter
of 2002/2003 through winter of 2008/2009 (Courtesy Center for Snow and Avalanche Studies)
HYSPLIT Trajectory Modeling
An atmospheric trajectory model from the National Air Resource Laboratory known as HYSPLIT was used to further analyze the movement of air parcels during known dust events. Both back trajectory (for air parcels originating over the deposition area) and forward trajectory (for air parcels originating over the suspected dust source) analyses were carried out for multiple events. HYSPLIT models were initialized by using weather stations near the suspected source area to determine the approximate time of peak wind velocity, and used EDAS (Eta Data Assimilation System) 40 km resolution data sets from the Air Resource Laboratory. A matrix of 15 origin points centered roughly over the San Juan Mountain range was used for the back trajectory analysis, while the forward trajectory analysis used a matrix of source points centered over the suspected source area in northeastern Arizona. The resolution on both matrices was set at 0.3 degrees.
Frequency Analysis
Wind data for the project was acquired from the RAWS network which collects hourly readings of wind speed, direction and maximum gust speed from a 20 ft. mast. Prior to beginning the analysis of high wind periods, RAWS locations with at least 20 years of high quality wind data were first identified throughout the states of Nevada, Utah, Arizona and western New Mexico. Out of the several hundred RAWS sites currently operating, 42 were identified as meeting the required criteria. From this initial data set the frequency analysis was carried out by counting the number of times the daily mean wind speed and maximum daily wind gusts exceeded the threshold values for each year of record. A 20 year average was created from these data. The values for individual years were then compared against the 20 year average to identify the departure from average.
3. Results and Discussion
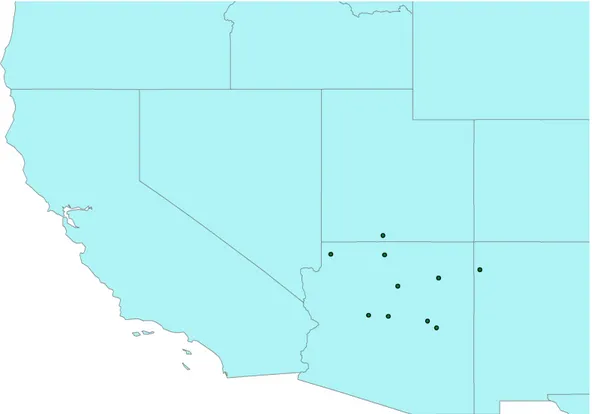
Individual RAWS AnalysisThe results from the visual analysis showed that the majority of RAWS locations with high wind periods best corresponding to known San Juan dust events were located in and around northeastern Arizona. The relationship between periods of sustained high winds and recorded dust events becomes weaker as one chooses stations further and further away from the northeast Arizona area (Fig. 1). This pattern suggests that conditions favorable to entraining and transporting aeolian sediment are present mostly in northeastern Arizona during a corresponding dust event in the San Juan Mountains, and therefore the source of this dust is most likely in the target area of northeastern Arizona. In addition to the data analysis, visual satellite imagery from Geostationary Operational Environmental Satellite (GOES) and Moderate Resolution Imaging Spectroradiometer (MODIS) instruments also show rising dust plumes prior to the dust events from the same areas in Arizona where the corresponding weather stations are located.
Figure 2. RAWS locations with high wind periods best corresponding to San Juan dust events from
2004 through 2009
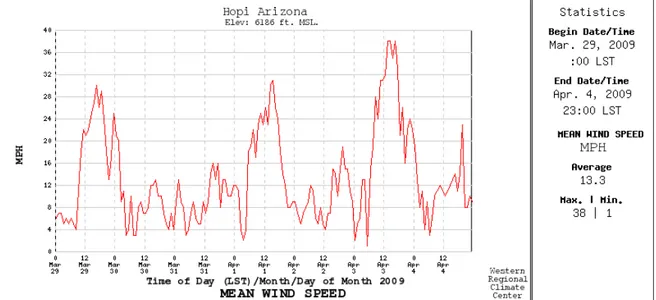
Furthermore, directional analysis of high velocity wind periods at these stations indicates the strongest winds are from a southwesterly direction. The directional component of the surface winds appear to be a major indicator as to whether or not a high wind period corresponds to a San Juan dust event. This became evident during the investigation of anomalous high wind periods that did not correspond to dust events in the San Juan Mountains. A good example can be found in the wind analysis of the Hopi, Arizona RAWS location during March 29 through April 3 of 2009 (Fig. 2). Here, a high
occurs in-between high wind periods matching dates of known San Juan dust events. The two high wind periods on March 29 and April 3 (Fig. 3 and Fig. 4) all have the strongest surface winds from the southwesterly direction, while the April 1 high wind event has the strongest winds coming from a north/northwesterly direction (Fig. 5). This evidence suggests that while the April 1 event likely entrained a significant amount of surface dust, the suspended dust was carried south of Colorado by the prevailing northerly winds associated with that particular storm system.
Figure 3. Time series graph of hourly mean wind speed in Hopi, Arizona for March 29, 2009 through April
4, 2009
HYSPLIT Trajectory Modeling
Assuming that entrained dust would travel at roughly the same speed as the boundary layer winds, the approximate time of travel from the suspected source to the San Juan Mountains was determined to be around 8 hours. Using this timing scenario HYSPILT models mostly show air parcels over the San Juan Mountains originated from northeast Arizona. Similarly, the forward trajectories were initialized during peak wind velocities on days with known San Juan dust events and run for 8 hours resulting in destinations over the southwestern Colorado Mountains. Since it is unrealistic to assume all events would have the same timing scheme, ensemble runs were made for several events using different initialization times. The resulting plots from the ensemble members showed only minor shifts in the trajectories.
The resolution for the matrix of source points was decided upon because of both the resolution of the meteorological data and the relatively large scale of the study area. At 0.3 degrees, the matrix is large enough to cover the area of interest while still retaining some level of spatial detail. The use of the model was not meant to isolate specific points of emission, but was intended to show that air parcels over the San Juan Mountains originated from the general area of the suspected dust source in northeast Arizona during known dust events.
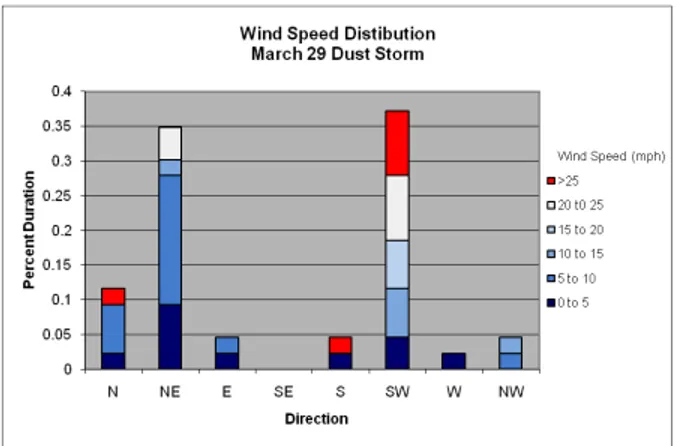
Figure 4. Wind speed distribution for 48 hours surrounding high wind events in Hopi, Arizona which
correspond to dust storms in the San Juan Mountains on March 29, 2009
Figure 5. Wind speed distribution for 48 hours surrounding high wind events in Hopi, Arizona which
correspond to dust storms in the San Juan Mountains on April 3, 2009
Figure 6. Wind speed distribution for 48 hours surrounding high wind event in Hopi, Arizona not
corresponding to a dust storm in the San Juan Mountains on April 1, 2009 Frequency Analysis
The frequency analysis was designed to quantitatively measure the amount of high wind events in the southwestern US over a wide spatial range. By combining data from the entire population of 42 stations, a change in the frequency of high wind days could be measured on a synoptic scale to reveal trends common to all of the stations. Daily summaries were used instead of hourly values because the investigation was interested in
signals that are not likely to generate large scale dust events. By focusing on daily data and eliminating short duration, high velocity signals the measured signals should be more representative of dust storm generating events.
Figure 7. (Above) Back trajectory HYSPLIT model from 19:00 UTC April 3, 2009 to 03:00 UTC April 4,
2009 with air parcel sources indicated with stars. (Below) air parcel pressure (hPa) time series graph with the beginning time of 03:00 UTC April 4, 2009 on the left moving backward in time to 19:00 UTC April 3, 2009 on the right
Preliminary analysis consisted only of the data from January through April, as this is the ideal time for the formation of large scale dust storms in the southwestern US (McBride, 2007). Using the high wind criteria defined from the individual station analysis, the average number of days the mean daily wind speed exceeded 15 mph during January through April was found to be 4.4 days with a standard deviation of 1.1 over the 20 year period, and the average number of days maximum daily wind gusts exceeding 44 mph for
the same months was 6.6 days with a standard deviation of 1.6 over the 20 year period. While the winter of 2009 ranked above the 20 year average in terms of the number of days with high winds, it was not the largest increase seen in the period of record. The discrepancy between the unusually high numbers of dust storms in 2009 with only a moderate increase in high wind frequency suggests the involvement of other controlling factors on dust entrainment, such as vegetation cover and antecedent moisture. Indeed, the suspected source area had been experiencing drought conditions that intensified throughout the winter of 2009 and could have resulted in an increased susceptibility to dust entrainment.
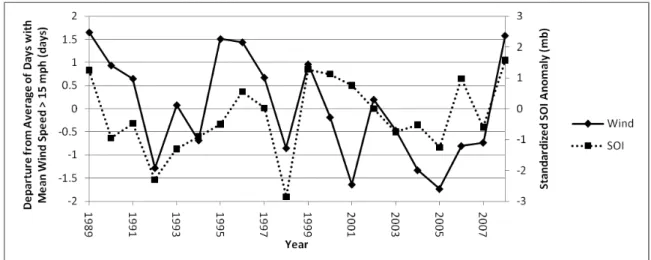
Possibly the most enlightening results came when the frequency data for the January through April high wind periods was compared to the Southern Oscillation Index (SOI) values for the same time period. The SOI data was obtained from the Climate Prediction Center and the index values were then averaged over the four month period from January to April. Visual comparison of the time series graphs of high wind frequency to the SOI revealed a corresponding relationship between positive(negative) phases of the SOI to an increase(decrease) in the frequency of high wind periods (Fig. 7 and Fig. 8). Linear regression analysis showed a correlation between the mean daily wind speeds and the SOI with a coefficient of determination of 0.21. The linear regression of the maximum daily wind gust compared to the SOI for the January through April time period yielded a coefficient of determination of 0.31. After evaluating data for the entire year it was discovered that the best correlation between the SOI and high wind frequency occurred in the January through April timeframe, a feature consistent with previous studies (Enloe, O’Brian and Smith, 2000). While these values fall short of proving a statistically significant correlation between the two phenomena, the existence of minor correlation suggests that wind frequency and the SOI are related to each other on some fundamental level throughout the 20 years of data analyzed.
4. Conclusion
In order to properly manage water supplies impacted by the effects of wind blown dust it is important to have a thorough understanding of the underlying mechanisms which bring about such situations. This study did not seek to comment on the effects caused by non-native dust on the San Juan snowpack, but rather to explore the possible sources of this sediment and the climatological patterns associated with its appearance. Considering the findings of this investigation, along with the results of other work, this study concludes that most of the dust accumulated on the San Juan Mountains in 2009 originated from the arid basin areas of the Colorado Plateau. The identification of the Colorado Plateau as the primary dust source does not imply that airborne sediment does not come from other sources, but only that the majority of San Juan dust originated from there.
As far as the correlation between increased frequency of high wind periods in the southwestern United States and the ENSO, more research is necessary before any concrete conclusions can be made. It is clear that some underlying relationship does exist between the ENSO and continental winds; however, the exact magnitude and timing of this effect is as of yet unknown. Aside from the frequency of high winds, it has been shown that ENSO forcing is also related to other key factors responsible for the generation of dust storms including vegetation (Li and Kafatos, 2000) and antecedent moisture conditions. Given
the positive results yielded from this study, the connection between the ENSO and alpine dust deposition in the San Juan Mountains certainly warrants further investigation.
Figure 8. Mean daily wind speed frequency vs. Southern Oscillation Index from January through April for
42 RAWS in AZ, NV, UT and western NM
Figure 9. Maximum daily wind gust frequency vs. Southern Oscillation Index from January through April
for 42 RAWS in AZ, NV, UT and western NM
5. References
Enloe, O’Brian and Smith (2003), ENSO Impacts on Peak Wind Gusts in the United States. Journal of Climate. Notes and Correspondence, vol. 17, 1728-1737
Jaffe, Snow and Cooper (2003), The 2001 Asian Dust Events: Transport and Impact on Surface Aerosol Concentrations in the U.S. Eos, Transactions, American Geophysical Union, Vol. 84, No. 46, 501-516 Lee and Kafatos (2000), Inter-annual Variability of Vegetation in the United States and Its relation to El
Niño/Southern Oscillation. Remote Sensing Environ., 71:239-247
McBride (2007), A Synoptic Climatology for Dust Deposition to the Snowpack in the San Juan Mountains, Colorado, U.S.A. Northern Arizona University: Master’s Thesis
Painter, T. H., A. P. Barrett, C. C. Landry, J. C. Neff, M. P. Cassidy, C. R. Lawrence, K. E. McBride, and G. L. Farmer, (2007), Impact of disturbed desert soils on duration of mountain snow cover, Geophys. Res. Lett., 34, L12502, doi:10.1029/2007GL030284.