Dentistry and Related Research. This paper has been peer-reviewed but
does not include the final publisher proof-corrections or journal pagination.
Citation for the published paper:
Chrcanovic, Bruno; Kisch, Jenö; Albrektsson, Tomas; Wennerberg, Ann.
(2017). Analysis of risk factors for cluster behavior of dental implant failures.
Clinical Implant Dentistry and Related Research, vol. 19, issue 4, p. null
URL: https://doi.org/10.1111/cid.12485
Publisher: Wiley
This document has been downloaded from MUEP (https://muep.mah.se) /
DIVA (https://mau.diva-portal.org).
Analysis of risk factors for cluster behavior of dental implant failures
Bruno Ramos Chrcanovic 1*, Jenö Kisch 2, Tomas Albrektsson 3, Ann Wennerberg 4
1
DDS, MSc, PhD student; Department of Prosthodontics, Faculty of Odontology, Malmö University, Malmö, Sweden
2
DDS; Clinic for Prosthodontics, Centre of Dental Specialist Care, Malmö, Sweden 3
MD, PhD; Department of Biomaterials, Göteborg University, Göteborg, Sweden; Department of Prosthodontics, Faculty of Odontology, Malmö University, Malmö, Sweden
4 DDS, PhD; Department of Prosthodontics, Faculty of Odontology, Malmö University, Malmö, Sweden
* Corresponding author:
Bruno Ramos Chrcanovic, Department of Prosthodontics, Faculty of Odontology, Malmö University, Carl Gustafs väg 34, SE-214 21, Malmö, Sweden. bruno.chrcanovic@mah.se; brunochrcanovic@hotmail.com Mobile: +46 725 541 545 Fax: +46 40 6658503
Bruno Ramos Chrcanovic, Jenö Kisch, Tomas Albrektsson, Ann Wennerberg: no conflict of interest
Author contributions
Bruno Ramos Chrcanovic: concept/design, data collection/acquisition, statistics, data analysis/interpretation, drafting article, critical revision of article, approval of article, agreed to be accountable for all aspects of the work.
Jenö Kisch, Tomas Albrektsson, Ann Wennerberg: concept/design, data analysis/interpretation, critical revision of article, approval of article, agreed to be accountable for all aspects of the work.
Abstract
Background. Some studies indicated that implant failures are commonly concentrated in few patients.
Purpose. To identify and analyze cluster behavior of dental implant failures among subjects of a retrospective study.
Materials and Methods. This retrospective study included patients receiving at least three implants only. Patients presenting at least three implant failures were classified as presenting a cluster behavior. Univariate and multivariate logistic regression models and generalized estimating equations (GEE) analysis evaluated the effect of explanatory variables on the cluster behavior. Results. There were 1,406 patients with three or more implants (8,337 implants, 592 failures). Sixty-seven (4.77%) patients presented cluster behavior, with 56.8% of all implant failures. The intake of antidepressants and bruxism were identified as potential negative factors exerting a statistically significant influence on a cluster behavior at the patient-level. The negative factors at the implant-level were turned implants, short implants, poor bone quality, age of the patient, the intake of medicaments to reduce the acid gastric production, smoking, and bruxism.
Conclusions. A cluster pattern among patients with implant failure is highly probable. Factors of interest as predictors for implant failures could be a number of systemic and local factors, although a direct causal relationship cannot be ascertained.
Keywords
Dental implant; implant failure; risk factors; cluster phenomenon; logistic models; multivariate analysis
Introduction
Results of some studies indicated that implant failures are commonly concentrated in few patients, rather than to be evenly distributed among all treated patients.1-6 Implant failures are not randomly distributed in all patients and a cluster behavior can occur.4 Cluster was once defined as more than one implant failure per patient, not necessarily in the same area or quadrant.5 As such, these failing patients have been described as “cluster patients,” and even though they have seemingly been observed in a randomized pattern, it is reasonable to assume that the patient with failing implant has certain individual characteristics that separate them from the more successful implant patients,4 i.e. these implant loss clusters happen in specific high-risk groups and individuals.7
Common risk factors for implant failures are poor bone quantity and quality, implant insertion in the maxilla and in the posterior region of the jaws, heavy smoking, use of shorter length implants, untreated chronic periodontitis, irradiation of the head and neck region, lack of initial implant stability, a low insertion torque of implants that are planned to be immediately or early loaded, use of cylindrical (non-threaded) implants, inexperienced surgeons conducting the surgery, greater number of implants placed per patient, implant insertion in fresh extraction sockets, and prosthetic rehabilitation with implant-supported overdentures.8, 9 However, there is still no consensus on or scientific evidence for the etiology of clustering failure phenomena.6
The aim of this study was to retrospectively analyze cluster behavior of dental implant failures among patients, to assess the possible risk factors influencing this phenomenon, and to describe and compare this group of patients with one not presenting this behavior.
Materials and Methods
Materials. This retrospective study was based on all 2,670 patients provided with implants,
consecutively treated on a routine basis at one specialist clinic (Clinic for Prosthodontics, Centre of Dental Specialist Care, Malmö, Sweden) during the period from 1980 to 2014. The study protocol was approved by the regional Ethical Committee, Lund, Sweden (Dnr 2014/598; Dnr 2015/72).
Definitions. An implant was considered a failure if presenting signs and symptoms that led to
implant removal. Thus, a failed implant in our study is equal to a lost implant. The failures were classified into two types: (1) implants lost due to lack/loss of osseointegration and (2) fractured implants. Primary failures were the failures occurring until/at the day of the 2o stage surgery (abutment connection). A patient was considered as presenting a cluster behavior of failures when having at least three dental implant failures. In order to diagnose patients as bruxers, the authors followed the definition of bruxism proposed by Lobbezoo et al.,10 and the sign and symptoms of bruxism were listed according to the International Classification of Sleep Disorders,11 following the same guidelines used in a recent study.12
Inclusion and exclusion criteria. Only patients receiving at least three implants were included.
Patients with all modern types of implants with cylindrical or conical design were included. Zygomatic implants were not included in the study, as well asimplants detected in radiographies, but without basic information about them in the patients’ files.
Data collection. The dental records of all patients ever treated with implants in the
aforementioned clinic were read in order to collect the data. The data were directly entered into a SPSS file (SPSS software, version 23, SPSS Inc., Chicago, IL, USA) as the files were being read. The following data were collected:
(a) Implant-related factors: implant surface (turned/machined or enhanced surfaces, the latter including sandblasted, acid-etched, sandblasted + acid-etched, anodized, hydroxyapatite-coated surfaces), implant diameter and length, and implant design (cylindrical or conical);
(b) Site-related factors: implant jaw location (maxilla/mandible), anterior or posterior location of the implant (sites from right canine to left canine teeth were considered anterior location), bone quantity and quality of the implant sites, which were classified at the time of surgery according to the Lekholm and Zarb13 classification, and implant sites with previous implant failures (reoperation).
(c) Patient-related factors: patient’s sex, age of the patient at the implant insertion surgery, general health, and behavioral history. The presence of a medicament list in the patients’ records was also use to correlate the use of certain drugs to specific health conditions. Health factors assessed: diabetes types I or II, hypertension, hypercholesterolemia, hypothyroidism, asthma, psoriasis, chemotherapy, and irradiation of the head-neck region. The patients were also classified according to the intake of the following medication types: antidepressants, immunosuppressives, bisphosphonates, antithrombotic agents (antiplatelet, anticoagulant, thrombolytic drugs), hormone replacement therapy in women, and medicaments to reduce the acid gastric production. Behavioral factors assessed: smoking habits, use of snuff, bruxism.
(d) Other factors: prescription of antibiotics (the prophylactic antibiotic regimen was usually starting 1-2 hours before surgery and going from 5-7 days postoperatively), bone graft procedures, reason for tooth extraction (periodontal disease, fracture/trauma, advanced caries, agenesia, other), type of implant-supported prosthetic restoration (single crown, partial bridge with 2-6 prosthetic elements, partial bridge with 7-10 prosthetic elements, full-arch, overdenture), number of days until failure, and follow-up time (≤1 year, 1 year<x≤5 years, 5 years<x≤10 years, 10 years<x≤20 years, >20 years).
As the standard protocol in the clinic, the patients’ dental hygiene was followed up by a dental hygienist within 6 months after the final implant-supported/retained restoration. Each patient then attended a dental hygiene recall program based on individual needs.
Statistical analyses. The mean, standard deviation (SD), and percentage were calculated for
several variables. Differences between implants of cluster and non-cluster patients were compared with the student’s t-test or Mann-Whitney test for continuous variables, depending on the normality and, the Pearson’s chi-squared or Fisher’s exact tests for categorical variables, depending on the number of samples in a 2x2 contingency table. Statistical significance was set at P<0.05. Logistic regression models were used at the patient-level as well as at the implant-level. The patient-level analysis considered the patient as the statistical unit, with patients presenting or not presenting
implant failures. Regression at the patient-level was used to evaluate the effect of explanatory health variables on the cluster behavior of implant failures, i.e. health factors there are inherently associated to the patient, not to the implant. First, a univariate effect of each health factor on the implant failure was evaluated. Odds ratios (OR) and their 95% confidence intervals (CI) were computed. The Wald test based on robust standard errors was used to assess the significance of each factor. A factor was excluded from further multivariate analysis if the univariate logistic regression resulted in a clearly non-significant odds ratio (P>0.1). In the second step a multivariate logistic regression gave the effects on different risk factors when controlling for other factors. The results of the final model were presented as an estimated OR of each significant prognostic variable (P<0.05).
An implant-level model was performed in order to assess the effects of the implant-related and local bone factor on the implant failures, also including the health variables. A generalized estimating equations (GEE) method was used to account for the fact that repeated observations (several implants) were available for a single patient. All models were adjusted for clustering of subject and implants in a binary logistic regression model using GEE with a binomial distribution and a logit link function, while assuming an exchangeable working correlation structure to assess the relationship between patients with cluster behavior and the risk factors. Initially a univariate GEE on each of the variables was performed. In order to verify multicollinearity, a correlation matrix of all of the predictor variables with a significant odds ratio (P-value cut-off point of 0.1) identified in the univariate GEE was scanned, to see whether there were some high correlations among the predictors. Collinearity statistics obtaining variance inflation factor (VIF) and tolerance statistic were also performed to detect more subtle forms of multicollinearity. Then a multivariable model with a forced entry method was used to evaluate the effect of the factors that were univariately significant (P<0.1) and didn’t present multicollinearity. A Wald chi-square test was used to analyze the statistical significance of each parameter within the model. The results of the final model were presented as an estimated OR of each significant prognostic variable (P<0.05).
Results
A number of 766 patients (390 men, 376 women) received only one implant, and presented 17 implant failures (2.22%; 15 lack/loss of osseointegration, 2 fractured implants), and 498 patients (221 men, 277 women) received two implants, and presented 37 implant failures (out of 996, 3.71%; 35 lack/loss of osseointegration, 2 fractured implants). These patients with only one or two implants were not eligible for the analysis.
There were 1,406 patients with three or more implants, totaling 8,337 implants, with 592 implant failures (7.10%; 556 lack/loss of osseointegration, 36 fractured implants). Sixty-seven (4.77%) patients were identified as presenting cluster behavior, who received 620 implants, of which 331 failed (3.37%; 315 lack/loss of osseointegration, 16 fractured implants). Thirty-two of these 67 patients were already deceased when the data collection was performed. There were 328 implants in 33 men (mean age±SD 62.1±10.3, min-max 36.9-83.3) and 292 implants in 34 women (mean age±SD 59.5±9.2, min-max 39.7-79.6). These 4.75% of the patients had 56.8% of all implant failures, when only the failures due to lack/loss of osseointegration were considered. The percentage is 56.0% when all failures are considered together (lack/loss of osseointegration + fracture of implants). Sixty-one (19.4%) of the 315 implants with osseointegration failure in cluster patients were lost until or at the day of the second-stage surgery (primary failures), and 80.6% after loading. The 67 cluster patients had a mean implant failure rate of 53.4% (range 20-100%). Twelve patients lost all their implants. One-hundred-and-thirty-three implants (40.2%) were lost (lack/loss of osseointegration + fracture) until 1 year after surgery, 192 (58.0%) later than 1 year of surgery, and there was no information for 6 implants (1.8%).
A total of 1,339 patients did not present a cluster behavior, and they received 7,717 implants, of which 261 failed (3.38%; 241 lack/loss of osseointegration, 20 fractured implants). In this group, 41.5% of the failures (100 out of 241 implant failures) occurred until/at the abutment connection (primary failures).
All implants were inserted with open flapped surgery. Only 3 implants were immediately loaded, all in non-cluster patients, with no failures. The abutment connection surgery was performed after a mean±SD healing time of 184±66 and 162±128 days for the cluster and non-cluster groups, respectively (P<0.001; Mann-Whitney test). The number of non-submerged implants for the respective groups was 7 (out of 620; 1.13%) and 289 (out of 7717; 3.74%), and the number of implants placed in fresh extraction sockets was 6 (out of 620; 0.97%) and 15 (out of 7717; 0.19%). The cluster group presented 479 implants (77.3%) with turned surfaces, whereas there were 4785 turned-surface implants (62.0%) in the non-cluster group (P<0.001; Pearson’s chi-squared test). The rest of the implants had some kind of enhanced surface. The group of turned-surface implants had a mean follow-up of 4678±2612 days, against 2215±1474 days for the group of enhanced-surface implants (P<0.001; Mann-Whitney test). The mean length of the inserted implants was 12.5±2.7 mm for the cluster group and 12.9±2.4 mm for the non-cluster group (p=0.008; Mann-Whitney test). The mean diameter for cluster and non-cluster groups were 3.76±0.16 and 3.75±0.15, respectively (P=0.042; Mann-Whitney test).
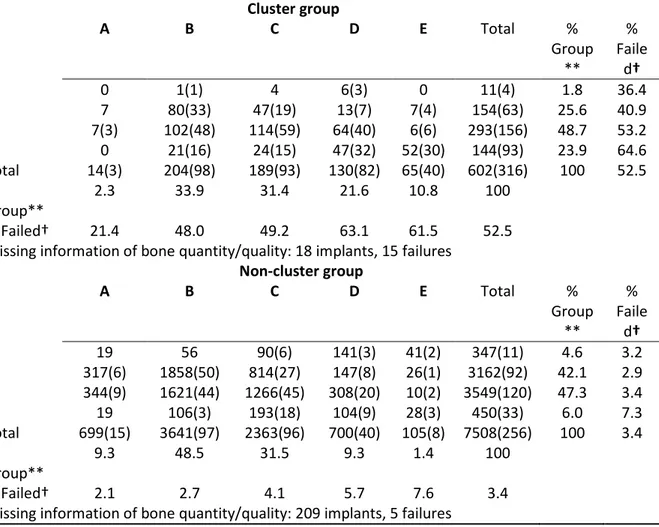
Table 1 shows a comparison of groups according to the distribution of implants with regard to Lekholm and Zarb (1985) classification of bone quantity and quality. It can be observed that a greater percentage of implants were placed in bone sites having been classified as quantities D and E (P<0.001; Pearson’s chi-squared test) and qualities 3 and 4 (P<0.001; Pearson’s chi-squared test) in the cluster patients group, in comparison to the non-cluster group. Table 2 shows a comparison of the difference in failure rates between implants groups of different surfaces, for cluster and non-cluster patients, in relation to bone sites of different quantities/qualities, according to the Lekholm and Zarb (1985) classification.
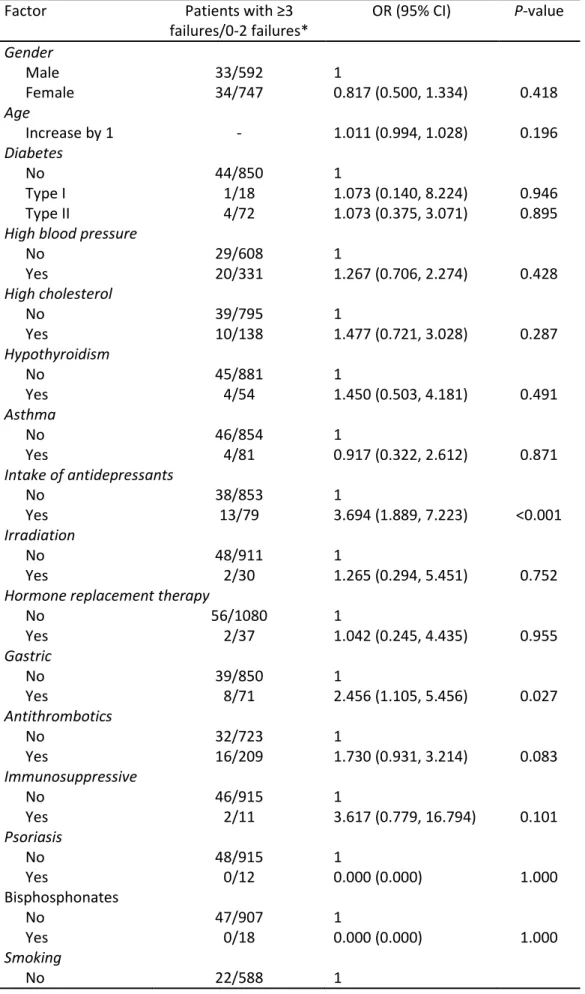
The univariate binary logistic regression at the patient-level showed that the following predictors had a statistically significant odds ratio at the patient-level (Table 3): the intake of antidepressants, the intake of medicaments to reduce the acid gastric production, the intake of antithrombotic agents, smoking, number of cigarettes per day, and bruxism. Only the intake of
antidepressants and bruxism continued to present a statistically significant odds ratio in the multivariate binary logistic regression model (Table 4).
The univariate GEE model at the implant-level showed that the following predictors had a statistically significant odds ratio at the implant-level (Table 5): implant surface, implant length, implant location, bone quantity and quality, reoperation, age of the patient at the time of the surgery, the intake of antidepressants, the intake of medicaments to reduce the acid gastric production, smoking, bruxism, the use of prophylactic antibiotics, bone grafting, and follow-up time. The following factors remained statistically significant in the multivariate GEE model (Table 6): turned implants, short implants, poor bone quality, age of the patient, the intake of medicaments to reduce the acid gastric production, smoking, and bruxism.
Discussion
The results of the present study showed profound differences of implant survival rate in different individuals, i.e. less than 5% of patients showed about 56% of all implant failures, and this suggests a cluster behavior with regard to implant failures, most likely with multifactorial causes.8 The regression analyses performed in this study tried to identify the factors that could possibly be related to implant failure. The univariate regression assessed the relationship between each independent variable and implant failure separately, and the multivariate regression assessed the relationship of the variables that were univariately significant to implant failure, controlling for each other. At the patient-level, the multivariate regression model identified the intake of antidepressants and bruxism as potential negative factors exerting a statistically significant influence on the high failure rates in cluster patients. At the implant-level, the negative factors identified by the multivariate GEE model were turned implants, shorter implants, poor bone quality, younger patients, the intake of medicaments to reduce the acid gastric production, smoking, and bruxism.
Two health-related variables were shown to exert some significant effect on the cluster behavior. The first one was depression. Knowing that a loss of motivation is one of the volitional
symptoms of depression,14 one may presume that depression could have a negative impact on oral hygiene.15 Kurer et al.16 found an association between mean depression scores and oral hygiene in a group of 51 regular dental attenders. Monteiro da Silva et al.17 found significantly increased depression and loneliness in patients with rapidly progressive adult-onset periodontitis compared with a group with regular chronic adult periodontitis and a control group. Among the risk factors associated with periodontal disease and ultimate tooth loss, smoking is the best documented one.18 In some studies smoking has also been associated with depression.19, 20
Some reasons could theoretically account for the suggested association between PPIs intake and the increased likelihood of dental implant failures. The most prominent hypothesis assumes that the reduced acidity in the stomach impairs the intestinal absorption of dietary calcium. Thus, there can be a decreased calcium absorption under PPI therapy.21-23 As the calcium balance is essential for the maintenance of bone health, it seems reasonable to believe that the unbalance of calcium may to some degree affect osseointegration.
Concerning the patients’ habits, bruxism was shown to significantly affect the implant failure rates negatively, agreeing with the results of the two very recent clinical trials assessing the effect of bruxism on dental implants.12, 24 This gives a new perspective on the condition, which was, until very recently, considered to be not related with implant failures.25, 26 Bruxism is suggested to generate overload of prosthetic rehabilitations on implants, which could possibly cause implant fracture or peri-implant marginal bone loss, ultimately resulting in implant failure.27 Implant failure may result in a “domino” effect that could lead to further implant failures in the same individual.5 This kind of effect was noticed in one study,4 where an observed pattern in the study group was that implant failures started in some patients predominantly in one quadrant, causing an unfavorable distribution of the remaining implants. Even if adjustments with shortening of the fixed implant-supported prostheses were made, these situations indicate that an overload could be a contributing factor of importance for some of the cluster failures.
Other patients’ habits such as smoking and the use of smokeless tobacco (snuff) were also analyzed. The results of the multivariate GEE logistic regression model suggest a statistically significant influence of smoking on the cluster behavior. A recent meta-analysis analyzing more than 100 studies has shown that failures of implants inserted in smokers are 2.23 times likely to happen than failures of implants inserted in non-smokers.28 The increase of implant failure rates due to smoking is hypothesized to be related mainly to the effect of smoking in osteogenesis and angiogenesis.29 Moreover, smokers’ health behavior and attitudes appear to be less favorable to oral health than those of non-smokers.30 Studies have shown that smokers brush and floss their teeth less frequently than non-smokers31 and have dental visits less frequently than do non-smokers.32
With regard to the age of the patient, the results of the multivariate GEE model suggest that the odds of implant failure decreases by 3.3% for every 1 year increase in the patient’s age. This could be related to the lower prevalence of bruxism among the elderly in relation to younger adult,33 to the ageing effect in oral physiology, resulting in less muscular strength and weaker mastication forces,34 and to a high prevalence of removable prosthesis opposing implant-supported restorations.35
The patients of the cluster group presented, in comparison to the patients of the non-cluster group, a statistically significant greater percentage of implants placed in sites of poor bone, i.e. bone quantities D and E, and bone qualities 3 and 4. The multivariate GEE model showed a statistically significant negative influence of poor bone on the cluster behavior of implant failures. Poor bone site has been considered an important factor to influence implant survival negatively.3
Concerning the different implant surfaces, the higher failure rate of turned implants is hypothesized to be related to the small differences in the osseointegration process in relation to the enhanced-surface implants. The enhanced surfaces are designed to allow greater bone-to-implant contact, and provide better possibilities for microbiomechanical retention due to larger surface and thus more retention for proteins to attach and new bone formation.36 The longer mean follow-up of the turned implants in comparison to the enhanced-surface implants group may also have some
influence on these results, as a longer period of follow-up can result in an increased failure rate, especially if it extended beyond functional loading, because other prosthetic factors can influence implant failure from that point onward.
With regard to lower hazard ratios for longer implants, although some good results can be obtained with the use of shorter implants, they seem to fail more often than longer ones.37 Increased initial stability, long-term resistance to bending moment forces, expedited healing, and a decreased risk of movement at the interface are listed as advantages of increased implant length.38
The lack of specific information characterizing the patients’ systemic conditions status and the medications dosage, as well as gaps in information in the dental records are limitations also connected to the retrospective nature of this study. Moreover, the implant primary stability was not analyzed, as well as the possible influence of the placement of implants by different surgeons/clinicians.
In the clear advantage of hindsight, it may be said that some patients should have been treated differently than what was done in the first place. Grafting procedures might have been advantageous in the cases with poor bone quantity and quality that displayed large number of failures. Parameters that can be available before the surgical and prosthodontics treatment would certainly be of importance to identify information to allow a careful discussion regarding risks and problems prior to surgery, and also to allow for measures to be taken to reduce the risk by, for example, choosing other surgical or prosthodontic techniques.4 The indication for the use of oral implants should sometimes be reconsidered when alternative prosthetic treatments are available and when possibly multiple interfering systemic or local factors are identified.
Conclusions
A cluster pattern among patients with implant failure is highly probable. Factors of interest as predictors for implant failures could be a number of systemic and local factors, although a direct causal relationship cannot be ascertained. The present study identified shorter implants, turned
implants, poor bone quality, age of the patient, the intake of antidepressants and of medicaments to reduce the acid gastric production, smoking, and bruxism as suggested potential factors exerting a statistically significant influence on the cluster behavior of dental implant failures.
Acknowledgements
Funding and support: This work was supported by research funds from the Oral Health Related Research by Region Skåne (Odontologisk Forskning i Region Skåne, OFRS 414321), Sweden, and from the Scientific Research Council of Sweden (Vetenskapsrådet, Dnr 2015-02971). This work was supported by Folktandvården AB, Region Skåne, Sweden and by CNPq, Conselho Nacional de Desenvolvimento Científico e Tecnológico, Brazil (201318/2012-1).
Trial registration at the U.S. National Institutes of Health (clinicaltrials.gov): NCT02369562 Declaration of conflicting interests: There are no conflicts of interest to declare.
References
1. Adell R, Eriksson B, Lekholm U, Brånemark PI, Jemt T. Long-term follow-up study of osseointegrated implants in the treatment of totally edentulous jaws. Int J Oral Maxillofac
Implants 1990; 5: 347-359.
2. Weyant RJ, Burt BA. An assessment of survival rates and within-patient clustering of failures for endosseous oral implants. J Dent Res 1993; 72: 2-8.
3. Ekfeldt A, Christiansson U, Eriksson T, Linden U, Lundqvist S, Rundcrantz T, Johansson LA, Nilner K, Billstrom C. A retrospective analysis of factors associated with multiple implant failures in maxillae. Clin Oral Implants Res 2001; 12: 462-467.
4. Jemt T, Hager P. Early complete failures of fixed implant-supported prostheses in the edentulous maxilla: a 3-year analysis of 17 consecutive cluster failure patients. Clin Implant Dent Relat Res 2006; 8: 77-86.
5. Schwartz-Arad D, Laviv A, Levin L. Failure causes, timing, and cluster behavior: an 8-year study of dental implants. Implant Dent 2008; 17: 200-207.
6. Lin WS, Ercoli C, Lowenguth R, Yerke LM, Morton D. Oral rehabilitation of a patient with bruxism and cluster implant failures in the edentulous maxilla: a clinical report. J Prosthet Dent 2012; 108: 1-8.
7. Tonetti MS. Determination of the success and failure of root-form osseointegrated dental implants. Adv Dent Res 1999; 13: 173-180.
8. Chrcanovic BR, Albrektsson T, Wennerberg A. Reasons for failures of oral implants. J Oral Rehabil 2014; 41: 443-476.
9. Chrcanovic BR, Kisch J, Albrektsson T, Wennerberg A. Factors Influencing Early Dental Implant Failures. J Dent Res 2016; 95: 995-1002.
10. Lobbezoo F, Ahlberg J, Glaros AG, Kato T, Koyano K, Lavigne GJ, de Leeuw R, Manfredini D, Svensson P, Winocur E. Bruxism defined and graded: an international consensus. J Oral Rehabil 2013; 40: 2-4.
11. AASM. International Classification of Sleep Disorders, Revised: Diagnostic and Coding Manual. American Academy of Sleep Medicine Chicago. 2014.
12. Chrcanovic BR, Kisch J, Albrektsson T, Wennerberg A. Bruxism and dental implant treatment complications: a retrospective comparative study of 98 bruxer patients and a matched group.
Clin Oral Implants Res 2016.
13. Lekholm U, Zarb GA. Patient selection and preparation In: Brånemark PI, Zarb GA, Albrektsson Ts, eds. Proceedings of the Tissue integrated prostheses: osseointegration in clinical dentistry. Quintessence Publishing Company, 1985: 199–209.
14. Beck AT. Depression: causes and treatment. University of Pennsylvania Press Philadelphia 15. Anttila SS, Knuuttila ML, Sakki TK. Relationship of depressive symptoms to edentulousness,
dental health, and dental health behavior. Acta Odontol Scand 2001; 59: 406-412.
16. Kurer JR, Watts TL, Weinman J, Gower DB. Psychological mood of regular dental attenders in relation to oral hygiene behaviour and gingival health. J Clin Periodontol 1995; 22: 52-55.
17. Monteiro da Silva AM, Oakley DA, Newman HN, Nohl FS, Lloyd HM. Psychosocial factors and adult onset rapidly progressive periodontitis. J Clin Periodontol 1996; 23: 789-794.
18. Norderyd O, Hugoson A, Grusovin G. Risk of severe periodontal disease in a Swedish adult population. A longitudinal study. J Clin Periodontol 1999; 26: 608-615.
19. Hall SM, Munoz RF, Reus VI, Sees KL. Nicotine, negative affect, and depression. J Consult Clin
Psychol 1993; 61: 761-767.
20. Escobedo LG, Reddy M, Giovino GA. The relationship between depressive symptoms and cigarette smoking in US adolescents. Addiction 1998; 93: 433-440.
21. Graziani G, Como G, Badalamenti S, Finazzi S, Malesci A, Gallieni M, Brancaccio D, Ponticelli C. Effect of gastric acid secretion on intestinal phosphate and calcium absorption in normal subjects. Nephrol Dial Transplant 1995; 10: 1376-1380.
22. O'Connell MB, Madden DM, Murray AM, Heaney RP, Kerzner LJ. Effects of proton pump inhibitors on calcium carbonate absorption in women: a randomized crossover trial. Am J Med 2005; 118: 778-781.
23. Schinke T, Schilling AF, Baranowsky A, Seitz S, Marshall RP, Linn T, Blaeker M, Huebner AK, Schulz A, Simon R, Gebauer M, Priemel M, Kornak U, Perkovic S, Barvencik F, Beil FT, Del Fattore A, Frattini A, Streichert T, Pueschel K, Villa A, Debatin KM, Rueger JM, Teti A, Zustin J, Sauter G, Amling M. Impaired gastric acidification negatively affects calcium homeostasis and bone mass.
Nat Med 2009; 15: 674-681.
24. Chrcanovic BR, Kisch J, Albrektsson T, Wennerberg A. Bruxism and dental implant failures: a multilevel mixed effects parametric survival analysis approach. J Oral Rehabil 2016; 43: 813-823. 25. Manfredini D, Poggio CE, Lobbezoo F. Is bruxism a risk factor for dental implants? A systematic
review of the literature. Clin Implant Dent Relat Res 2014; 16: 460-469.
26. Chrcanovic BR, Albrektsson T, Wennerberg A. Bruxism and Dental Implants: A Meta-Analysis.
Implant Dent 2015; 24: 505-516.
27. Lobbezoo F, Brouwers JE, Cune MS, Naeije M. Dental implants in patients with bruxing habits. J
Oral Rehabil 2006; 33: 152-159.
28. Chrcanovic BR, Albrektsson T, Wennerberg A. Smoking and dental implants: A systematic review and meta-analysis. J Dent 2015; 43: 487-498.
29. Ma L, Zheng LW, Sham MH, Cheung LK. Uncoupled angiogenesis and osteogenesis in nicotine-compromised bone healing. J Bone Miner Res 2010; 25: 1305-1313.
30. Telivuo M, Kallio P, Berg MA, Korhonen HJ, Murtomaa H. Smoking and oral health: a population survey in Finland. J Public Health Dent 1995; 55: 133-138.
31. Andrews JA, Severson HH, Lichtenstein E, Gordon JS. Relationship between tobacco use and self-reported oral hygiene habits. J Am Dent Assoc 1998; 129: 313-320.
32. Attwood D, West P, Blinkhorn AS. Factors associated with the dental visiting habits of adolescents in the west of Scotland. Community Dent Health 1993; 10: 365-373.
33. Lavigne GJ, Montplaisir JY. Restless legs syndrome and sleep bruxism: prevalence and association among Canadians. Sleep 1994; 17: 739-743.
34. Mioche L, Bourdiol P, Peyron MA. Influence of age on mastication: effects on eating behaviour.
Nutr Res Rev 2004; 17: 43-54.
35. Osterberg T, Carlsson GE, Sundh V. Trends and prognoses of dental status in the Swedish population: analysis based on interviews in 1975 to 1997 by Statistics Sweden. Acta Odontol
Scand 2000; 58: 177-182.
36. Balshe AA, Assad DA, Eckert SE, Koka S, Weaver AL. A retrospective study of the survival of smooth- and rough-surface dental implants. Int J Oral Maxillofac Implants 2009; 24: 1113-1118. 37. Pommer B, Frantal S, Willer J, Posch M, Watzek G, Tepper G. Impact of dental implant length on
early failure rates: a meta-analysis of observational studies. J Clin Periodontol 2011; 38: 856-863. 38. Winkler S, Morris HF, Ochi S. Implant survival to 36 months as related to length and diameter.
TABLES
Table 1. Comparison of cluster and non-cluster groups according to the distribution of implants with regard to Lekholm and Zarb (1985) classification of bone quantity and quality. The number between parentheses represents failures.
Cluster group A B C D E Total % Group ** % Faile d† 1 0 1(1) 4 6(3) 0 11(4) 1.8 36.4 2 7 80(33) 47(19) 13(7) 7(4) 154(63) 25.6 40.9 3 7(3) 102(48) 114(59) 64(40) 6(6) 293(156) 48.7 53.2 4 0 21(16) 24(15) 47(32) 52(30) 144(93) 23.9 64.6 Total 14(3) 204(98) 189(93) 130(82) 65(40) 602(316) 100 52.5 % Group** 2.3 33.9 31.4 21.6 10.8 100 % Failed† 21.4 48.0 49.2 63.1 61.5 52.5
Missing information of bone quantity/quality: 18 implants, 15 failures Non-cluster group A B C D E Total % Group ** % Faile d† 1 19 56 90(6) 141(3) 41(2) 347(11) 4.6 3.2 2 317(6) 1858(50) 814(27) 147(8) 26(1) 3162(92) 42.1 2.9 3 344(9) 1621(44) 1266(45) 308(20) 10(2) 3549(120) 47.3 3.4 4 19 106(3) 193(18) 104(9) 28(3) 450(33) 6.0 7.3 Total 699(15) 3641(97) 2363(96) 700(40) 105(8) 7508(256) 100 3.4 % Group** 9.3 48.5 31.5 9.3 1.4 100 % Failed† 2.1 2.7 4.1 5.7 7.6 3.4
Missing information of bone quantity/quality: 209 implants, 5 failures
* According to the Lekholm and Zarb (1985) classification, bone quality is broken down into four groups according to the proportion and structure of compact and trabecular bone tissue: type 1 = large homogenous cortical/compact bone; type 2 = thick layer of compact bone surrounding a dense trabecular bone; type 3 = thin cortical layer surrounding a dense trabecular bone; type 4 = thin cortical layer surrounding a core of low-density trabecular bone. The quantity of jawbone is broken down into five groups (A, B, C, D, and E), based on the residual jaw shape following tooth extraction. Bone classified as ‘A’ presents the largest amount of bone among all classes, whereas bone classified as ‘E’ presents the lowest volume of bone.
** Percentage of implants in each bone quantity/quality class, considering all implants in cluster or non-cluster group as 100%
Table 2. Comparison of the difference in failure rates (Pearson’s chi-squared test) between implants groups of different surfaces, for cluster and non-cluster patients, in relation to bone sites of different quantities/qualities, according to the Lekholm and Zarb (1985) classification.
Bone Group Implant P value*
failure/total (% failed) Turned Enhanced
Quantity A/B/C Cluster 145/285 (50.9%) 49/122 (40.2%) 0.047 Non-cluster 154/4010 (3.8%) 54/2693 (2.0%) <0.001
Quantity D/E Cluster 114/176 (64.8%) 8/19 (42.1%) 0.052
Non-cluster 36/655 (5.5%) 12/150 (8.0%) 0.243
Quality 1/2 Cluster 52/115 (45.3%) 15/50 (30%) 0.067
Non-cluster 75/2129 (3.5%) 28/1380 (2.0%) 0.010
Quality 3/4 Cluster 207/346 (59.8%) 42/91 (46.2%) 0.019
Non-cluster 115/2536 (4.5%) 38/1463 (2.6%) 0.002 * Pearson’s chi-squared test
Table 3. Univariate binary logistic regression for cluster behavior: gender and health factors at the patient-level (OR – odds ratio).
Factor Patients with ≥3
failures/0-2 failures* OR (95% CI) P-value Gender Male 33/592 1 Female 34/747 0.817 (0.500, 1.334) 0.418 Age Increase by 1 - 1.011 (0.994, 1.028) 0.196 Diabetes No 44/850 1 Type I 1/18 1.073 (0.140, 8.224) 0.946 Type II 4/72 1.073 (0.375, 3.071) 0.895
High blood pressure
No 29/608 1 Yes 20/331 1.267 (0.706, 2.274) 0.428 High cholesterol No 39/795 1 Yes 10/138 1.477 (0.721, 3.028) 0.287 Hypothyroidism No 45/881 1 Yes 4/54 1.450 (0.503, 4.181) 0.491 Asthma No 46/854 1 Yes 4/81 0.917 (0.322, 2.612) 0.871 Intake of antidepressants No 38/853 1 Yes 13/79 3.694 (1.889, 7.223) <0.001 Irradiation No 48/911 1 Yes 2/30 1.265 (0.294, 5.451) 0.752
Hormone replacement therapy
No 56/1080 1 Yes 2/37 1.042 (0.245, 4.435) 0.955 Gastric No 39/850 1 Yes 8/71 2.456 (1.105, 5.456) 0.027 Antithrombotics No 32/723 1 Yes 16/209 1.730 (0.931, 3.214) 0.083 Immunosuppressive No 46/915 1 Yes 2/11 3.617 (0.779, 16.794) 0.101 Psoriasis No 48/915 1 Yes 0/12 0.000 (0.000) 1.000 Bisphosphonates No 47/907 1 Yes 0/18 0.000 (0.000) 1.000 Smoking No 22/588 1
Yes 26/259 2.683 (1.493, 4.822) 0.001 Former smoker 1/32 0.835 (0.109, 6.394) 0.862 Cigarettes/day Increase by 1 - 1.034 (0.998, 1.072) 0.068 Snuff No 43/839 1 Yes 3/28 2.091 (0.611, 7.148) 0.240 Bruxism No 38/901 1 Yes 11/43 6.065 (2.901, 12.681) <0.001
Table 4. Multivariate logistic regression model for cluster behavior at the patient-level. Only the patient and health factors that were considered statistically significant (P < 0.1) in the univariate model and didn’t present multicollinearity were included in the multivariate model (OR – odds ratio).
Factor OR (95% CI) P-value
Intake of antidepressants No 1 Yes 2.473 (1.026, 5.958) 0.044 Gastric No 1 Yes 2.182 (0.829, 5.744) 0.114 Antithrombotics No 1 Yes 1.247 (0.552, 2.813) 0.596 Smoking No 1 Yes 2.170 (0.629, 7.483) 0.220 Former smoker 0.658 (0.079, 5.481) 0.699 Cigarettes/day Increase by 1 1.003 (0.934, 1.078) 0.932 Bruxism No 1 Yes 6.376 (2.567, 15.834) <0.001
Table 5. Risk factor analysis using a univariate generalized estimating equations (GEE) logistic regression model, at the implant-level (OR – odds ratio).
Factor Failure/survival in cluster patients* Failure/survival in non-cluster patients* OR (95% CI) P-value IMPLANT-RELATED FACTORS Implant surface** Turned 274/205 194/4591 1 Enhanced 57/84 67/2865 0.286 (0.190, 0.430) <0.001 Implant diameter Increase by 1 - - 1.656 (0.783, 3.502) 0.187 Implant length Increase by 1 - - 0.904 (0.849, 0.962) 0.002 Implant design Cylindrical 330/281 257/7297 1 Conical 1/8 4/159 0.174 (0.008, 3.767) 0.265 SITE-RELATED FACTORS Location Maxilla 277/175 160/3795 1 Mandible 54/114 101/3661 0.454 (0.334, 0.617) <0.001 Anterior 231/183 121/4469 1 Posterior 100/106 140/2987 1.233 (1.007, 1.510) 0.043 Bone quantity A 3/11 15/684 1 B 98/106 97/3544 1.529 (0.777, 3.011) 0.219 C 93/96 96/2267 2.398 (1.204, 4.778) 0.013 D 82/48 40/660 4.913 (2.346, 10.289) <0.001 E 40/25 8/97 9.251 (3.892, 21.988) <0.001 Bone quality 1 4/7 11/336 1 2 63/91 92/3070 1.193 (0.439, 3.243) 0.730 3 156/137 120/3429 1.640 (0.610, 4.413) 0.327 4 93/51 33/417 5.282 (1.793, 15.565) 0.003 Reoperation No 228/240 260/7392 1 Yes 43/49 1/64 5.423 (3.358, 8.758) <0.001 PATIENT-RELATED FACTORS Gender Male 160/168 108/3494 1 Female 171/121 153/3962 1.052 (0.784, 1.411) 0.735 Age Increase by 1 - - 0.981 (0.972, 0.990) <0.001 Diabetes No 226/174 143/4701 1 Type I 3/0 4/97 1.461 (0.420, 5.086) 0.551 Type II 15/21 17/419 0.968 (0.558, 1.679) 0.908
High blood pressure
No 162/96 104/3394 1
Yes 82/99 59/1813 0.899 (0.625, 1.293) 0.567
High cholesterol
Yes 46/43 30/789 1.124 (0.714, 1.771) 0.614 Hypothyroidism No 231/179 156/4893 1 Yes 13/16 8/286 1.034 (0.478, 2.235) 0.932 Asthma No 231/179 151/4746 1 Yes 19/25 11/438 0.799 (0.427, 1.493) 0.481 Intake of antidepressants No 180/150 145/4737 1 Yes 77/65 15/432 2.523 (1.527, 4.167) <0.001 Irradiation No 241/190 157/5062 1 Yes 7/6 5/151 1.105 (0.430, 2.828) 0.836
Hormone replacement therapy
No 13/9 8/190 1 Yes 273/250 192/6076 1.130 (0.505, 2.531) 0.766 Gastric No 195/157 143/4705 1 Yes 36/33 17/395 1.890 (1.105, 3.233) 0.020 Antithrombotics No 151/127 119/4007 1 Yes 83/71 43/1151 1.289 (0.862, 1.928) 0.217 Immunosuppressive No 227/188 159/5071 1 Yes 7/10 1/59 1.310 (0.388, 4.422) 0.663 Psoriasis No 234/234 159/5072 1 Yes 0/0 2/63 0.000 (0.000) 1.000 Bisphosphonates No 232/190 159/5044 1 Yes 0/0 1/80 0.000 (0.000) 1.000 Smoking No 119/95 96/3179 1 Yes 115/102 51/1495 1.747 (1.202, 2.541) 0.003 Former smoker 7/5 7/159 1.312 (0.555, 3.106) 0.536 Cigarettes/day Increase by 1 - - 1.014 (0.990, 1.038) 0.262 Snuff No 206/173 145/4620 1 Yes 20/13 5/152 1.713 (0.745, 3.937) 0.205 Bruxism No 177/155 150/5001 1 Yes 63/49 20/242 4.449 (2.691, 7.357) <0.001 OTHER FACTORS Antibiotics No 20/20 25/457 1 Yes 130/117 92/3505 0.641 (0.401, 1.025) 0.063 Bone grafting No 267/253 239/7155 1 Yes 64/36 22/301 2.139 (1.083, 4.226) 0.029
Periodontal disease 24/34 28/791 1 Fracture/trauma 1/0 9/140 1.633 (0.809, 3.297) 0.171 Advanced caries 6/4 2/188 0.878 (0.381, 2.020) 0.759 Agenesia 0/0 17/361 0.821 (0.366, 1.843) 0.633 Other 1/2 3/52 1.443 (0.490, 4.250) 0.506 Prosthetic restoration Single crown 2/0 22/414 1 Partial fixed, 2-6 units 50/46 68/1986 0.872 (0.539, 1.410) 0.575 Partial fixed, 7-10 units 17/16 9/328 1.115 (0.457, 2.722) 0.810 Full-arch fixed 220/198 134/4502 1.031 (0.626, 1.696) 0.905 Overdenture 33/25 15/169 1.807 (0.500, 6.533) 0.367
* The information for some conditions is unknown for a variable number of implants
** The turned implants group was comprised by Nobel turned implants only. The numbers (failure/survival) for the enhanced surface implants in cluster and non-cluster patients were, respectively: Nobel TiUnite, 42/56 and 41/1989; Astra TiOblast, 12/12 and 11/285; Astra Osseospeed, 0/0 and 4/139; Straumann, 0/2 and 8/232; XIVE/Frialit-2, 0/6 and 2/89; other, 3/8 and 1/131.
Table 6. Multivariate generalized estimating equations (GEE) logistic regression model at the implant-level. Only the factors that were considered statistically significant (P < 0.1) in the univariate model and didn’t present multicollinearity were included in the multivariate model (OR – odds ratio).
Factor OR (95% CI) P-value
Implant surface Turned 1 Enhanced 0.249 (0.124, 0.498) <0.001 Implant length Increase by 1 0.855 (0.767, 0.954) 0.005 Location Maxilla 1 Mandible 0.779 (0.432, 1.403) 0.405 Anterior 1 Posterior 1.117 (0.761, 1.639) 0.572 Bone quantity A 1 B 1.840 (0.510, 6.639) 0.352 C 1.346 (0.346, 5.234) 0.668 D 3.121 (0.682, 14.295) 0.143 E 4.781 (0.407, 56.173) 0.213 Bone quality 1 1 2 1.055 (0.393, 2.831) 0.915 3 1.030 (0.371, 2.859) 0.955 4 4.131 (1.185, 14.403) 0.026 Reoperation No 1 Yes 0.571 (0.050, 6.534) 0.653 Age Increase by 1 0.967 (0.948, 0.986) 0.001 Intake of antidepressants No 1 Yes 1.079 (0.405, 2.871) 0.879 Gastric No 1 Yes 2.256 (1.016, 5.012) 0.046 Smoking No 1 Yes 1.882 (1.084, 3.268) 0.025 Former smoker 1.865 (0.635, 5.476) 0.257 Bruxism No 1 Yes 6.105 (2.699, 13.808) <0.001 Antibiotics No 1 Yes 0.659 (0.337, 1.287) 0.222 Bone grafting No 1 Yes 2.008 (0.375, 10.768) 0.416